New Highs Expand in the Healthcare Sector By Erin Heim
* February 4, 2017
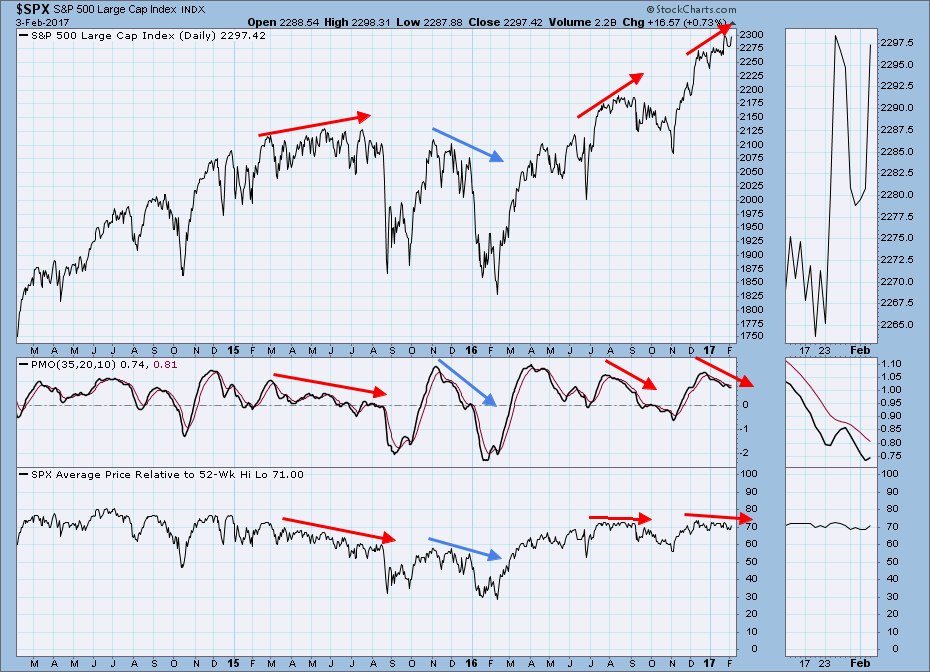
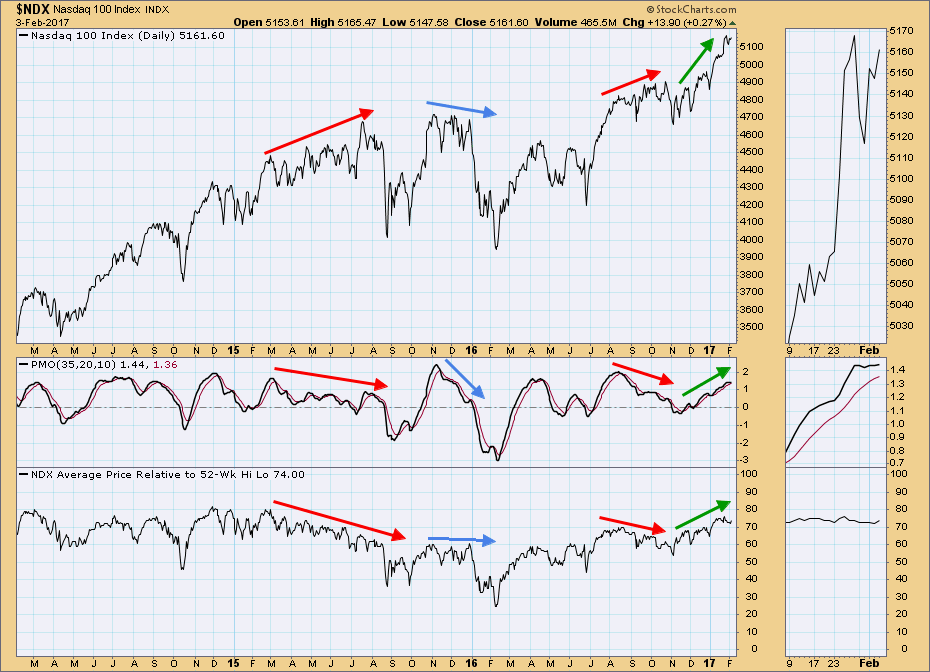
Today during my DecisionPoint Report webinar, I pulled the intermediate-term indicator chart of SPX Stocks Relative to Their 52-Week Hi-Lo to show my viewers the divergences that are all over this chart. After I finished the webinar and reviewed the chart again, I decided it would be great to see what the same chart for the NDX looked like. It's a tale of two very different indexes right now.
What is present in both charts are divergences and confirmations that are quite reliable. The red arrows on the SPX chart below represent negative/bearish divergences. You can see how price tops are rising, but indicator tops are in decline. In the case of the blue arrows, there was a bearish confirmation, meaning declining price tops are matching declining indicator tops. The last few months are our warning that the SPX has problems.
The NDX looks very similar with the same divergences and bearish confirmation. The only and most significant difference is the NDX has a bullish confirmation in effect over the past few months, not a negative divergence as with the SPX. Both price tops and indicator tops are on the rise.
Conclusion: The hope would be that the NDX's bullish bias will soon be shared by the other major indexes. If you go to the DecisionPoint Market Indicator ChartPack, you'll find these same charts for the OEX and INDU. A quick look at those two charts, and you'll see that the OEX and INDU are in line with the SPX. When I reviewed small-caps during today's webinar, there was a bearish bias that does not match the NDX. It seems unlikely that the NDX will be able to completely carry the load. Look for the NDX to cool down, not necessarily a correction, but expect at least sideways trading.
Technical Analysis is a windsock, not a crystal ball.
Click on "In reply to", for Authors past commentaries
Information posted to this board is not meant to suggest any specific action, but to point out the technical signs that can help our readers make their own specific decisions. Your Due Dilegence is a must! • DiscoverGold
Register for free to join our community of investors and share your ideas. You will also get access to streaming quotes, interactive charts, trades, portfolio, live options flow and more tools.


 News
News  Market Data
  Discover