10-Year Treasury Yield Is Bouncing Off It's 50-Day Average, As is The Dollar By John Murphy
* January 21, 2017
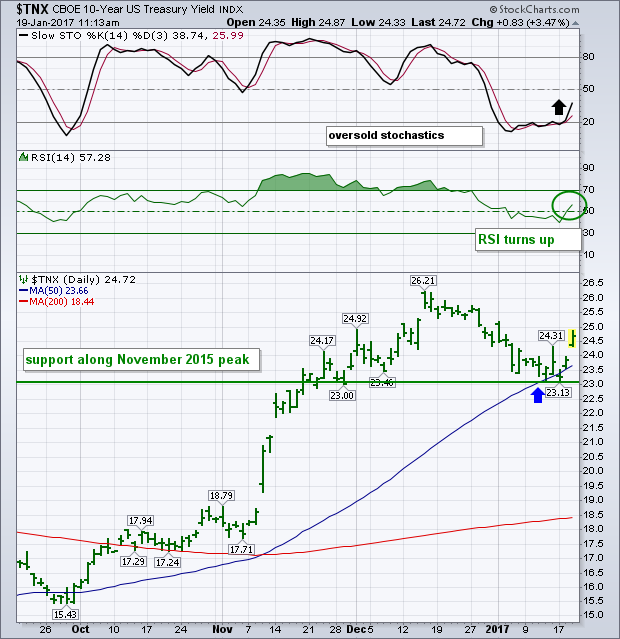
The pullback in Treasury yields (coinciding with an oversold bounce in Treasury prices) may have run its course. Chart 1 shows the 10-Year Treasury Yield ($TNX) bouncing sharply off its 50-day moving average. The two momentum indicators above Chart 1 are also supportive. The 14-day RSI (green) line is back above the 50 level. The more sensitive 14-day Slow Stochastics oscillator (top box) is rebounding from oversold territory below 20. My Saturday message also showed potential support at its November 2015 peak ranging from 2.34% to 2.30%. That may also be providing a floor beneath the TNX. [Pullbacks should find support near previous peaks as resistance turns into support]. Keep in mind also that longer-range weekly and monthly charts support a new uptrend in Treasury yields. Higher yields are pushing Treasury bond prices lower. They may also start to weigh on rate-sensitive stock groups like staples, utilities, and REITS. All three of those groups have rebounded along with bond prices over the past month, but are starting to struggle with resistance at their respective 200-day averages. They could start to weaken along with bond prices. Rising yields should also support financial stocks. Money moving out of bonds may also find its way back into stocks. That's a lot riding on a two-day bounce. But we'll be watching closely over the next week to see if the rebound in yields continue.
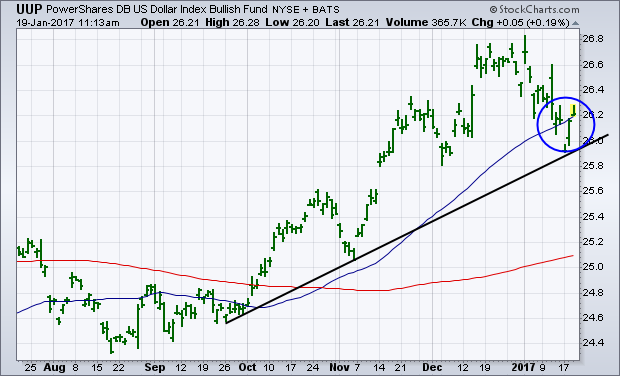
THE DOLLAR IS ALSO BOUNCING... Not surprisingly, the U.S. dollar is bouncing with bond yields. That's not surprising since both rose together after the November election, and have pulled back together over the past month. And it too is bouncing off chart support. Chart 2 shows the PowerShares Dollar Fund (UUP) climbing back over its 50-day average. It's also bouncing off a rising trendline drawn under its September/November lows. [Although not shown here, the Dollar Index is also bouncing off a previous peak formed in November 2015]. The dollar hit a 14-year high last month, which means that its long-term trend is higher. Part of the reason for today's dollar buying is tied to weakness in the Euro. The ECB decision to stand pat on monetary policy in the face of rising eurozone inflation stands to widen the interest rate gap between the U.S. (which plans to raise rates) and the eurozone (which doesn't). Rising Treasury yields are also supportive to the dollar.
Click on "In reply to", for Authors past commentaries
Information posted to this board is not meant to suggest any specific action, but to point out the technical signs that can help our readers make their own specific decisions. Your Due Dilegence is a must! • DiscoverGold
Register for free to join our community of investors and share your ideas. You will also get access to streaming quotes, interactive charts, trades, portfolio, live options flow and more tools.


 News
News  Market Data
  Discover