Dow Smashes Records, But Where's the Nasdaq 100? By Erin Heim
* November 10, 2016
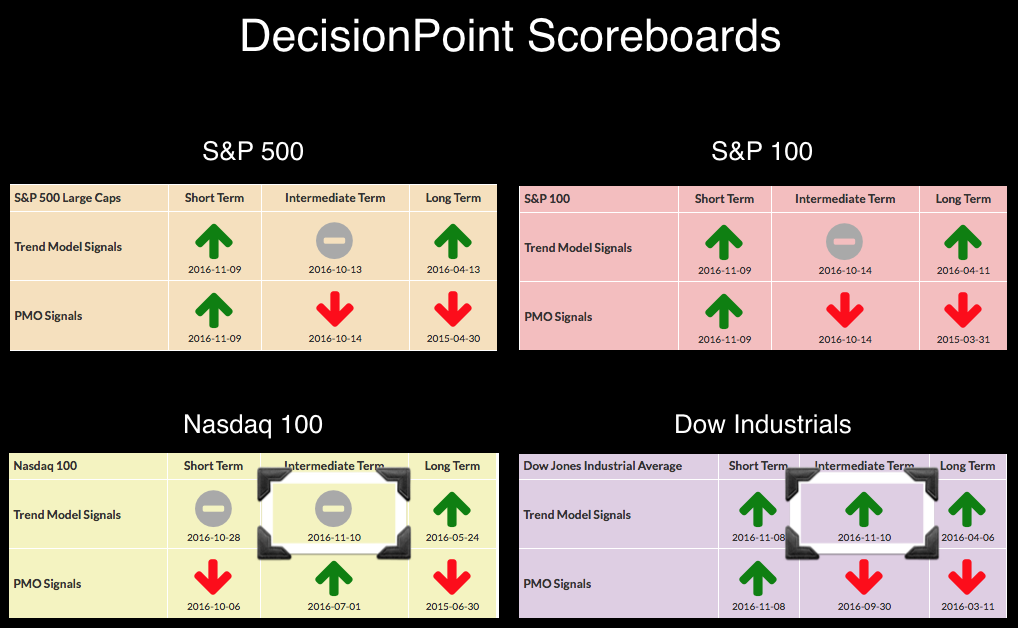
This week has been volatile for the market and the country. After Dow Futures were down well over 5% and even 8% at one point Tuesday night, the Dow surprised everyone with a solid rally on Wednesday. Today that rally was followed by a breakout to new all-time highs. The thrust of this rally pushed the Dow to a new Intermediate-Term Trend Model (ITTM) BUY signal. However, the NDX was down over 1.6% today, clearly not participating in the rally. It isn't just a matter of underperforming the Dow, the indicators are heading south and a new Intermediate-Term Trend Model Neutral signal materialized on the NDX DP Scoreboard shown below.
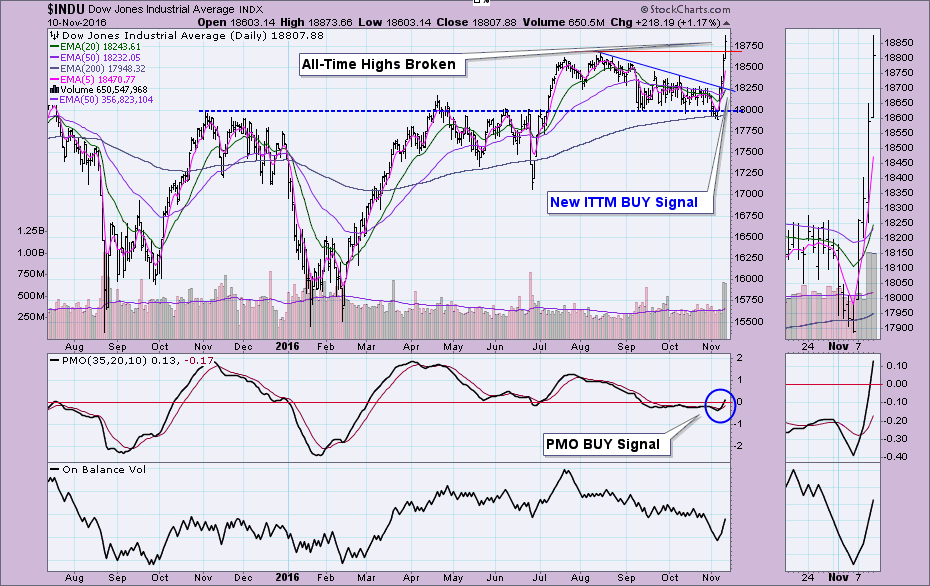
The daily chart for the Dow is impressive. After price breached support at the 200-EMA, it took off. Rather than a BREXIT shake-up decline, the opposite occurred with a strong rally to new all-time highs. The Price Momentum Oscillator (PMO) made an about face and is shooting skyward after a crossover BUY signal. The IT Trend Model triggers its signals based on the 20/50-EMAs in relation to the 200-EMA. For the Dow, it is a simple 20/50-EMA positive crossover that generated the BUY signal.
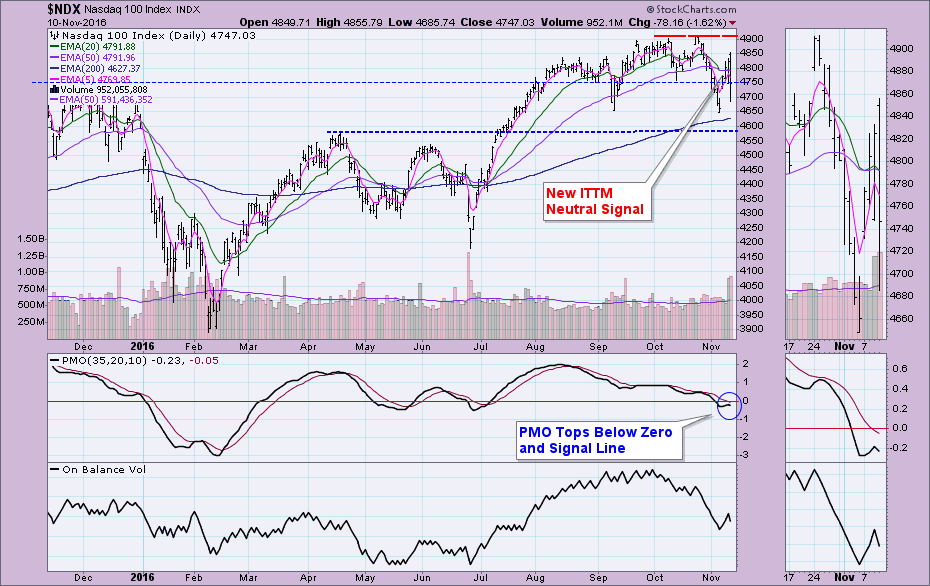
For the NDX, the 20-EMA crossed below the 50-EMA. The crossover occurred above the 200-EMA so the signal is a Neutral, not a SELL. In DecisionPoint terms, if the 50-EMA is above the 200-EMA that index, ETF, etc. is in a bull market. Therefore, we wouldn't want to move to an aggressive SELL signal, the model triggers a Neutral signal instead, "Neutral" meaning moving to cash or fully hedged. The PMO topped below its signal line and below the zero line; both are very bearish for the shorter term. Today's close was right on support at previous all-time highs. The NDX needs a rally of more than 3% to catch up to its all-time highs, certainly not unsurmountable, but negative momentum will likely cause drag.
Conclusion: It seems that only certain sectors, especially industrials, banks, materials, are fueling the rally in the broad market. Unfortunately, that doesn't translate to the NDX which is comprised of mostly tech and consumer services stocks. If a new bull market is to occur, the NDX and other sectors will need to get on board the Dow rally train. At this point, given the deteriorating indicators and complete lack of participation in the rally, the NDX will need a serious shot in the arm.
Technical Analysis is a windsock, not a crystal ball.
Click on "In reply to", for Authors past commentaries
Information posted to this board is not meant to suggest any specific action, but to point out the technical signs that can help our readers make their own specific decisions. Your Due Dilegence is a must! • DiscoverGold
Register for free to join our community of investors and share your ideas. You will also get access to streaming quotes, interactive charts, trades, portfolio, live options flow and more tools.


 News
News  Market Data
  Discover