


Thursday, October 20, 2016 11:04:33 AM
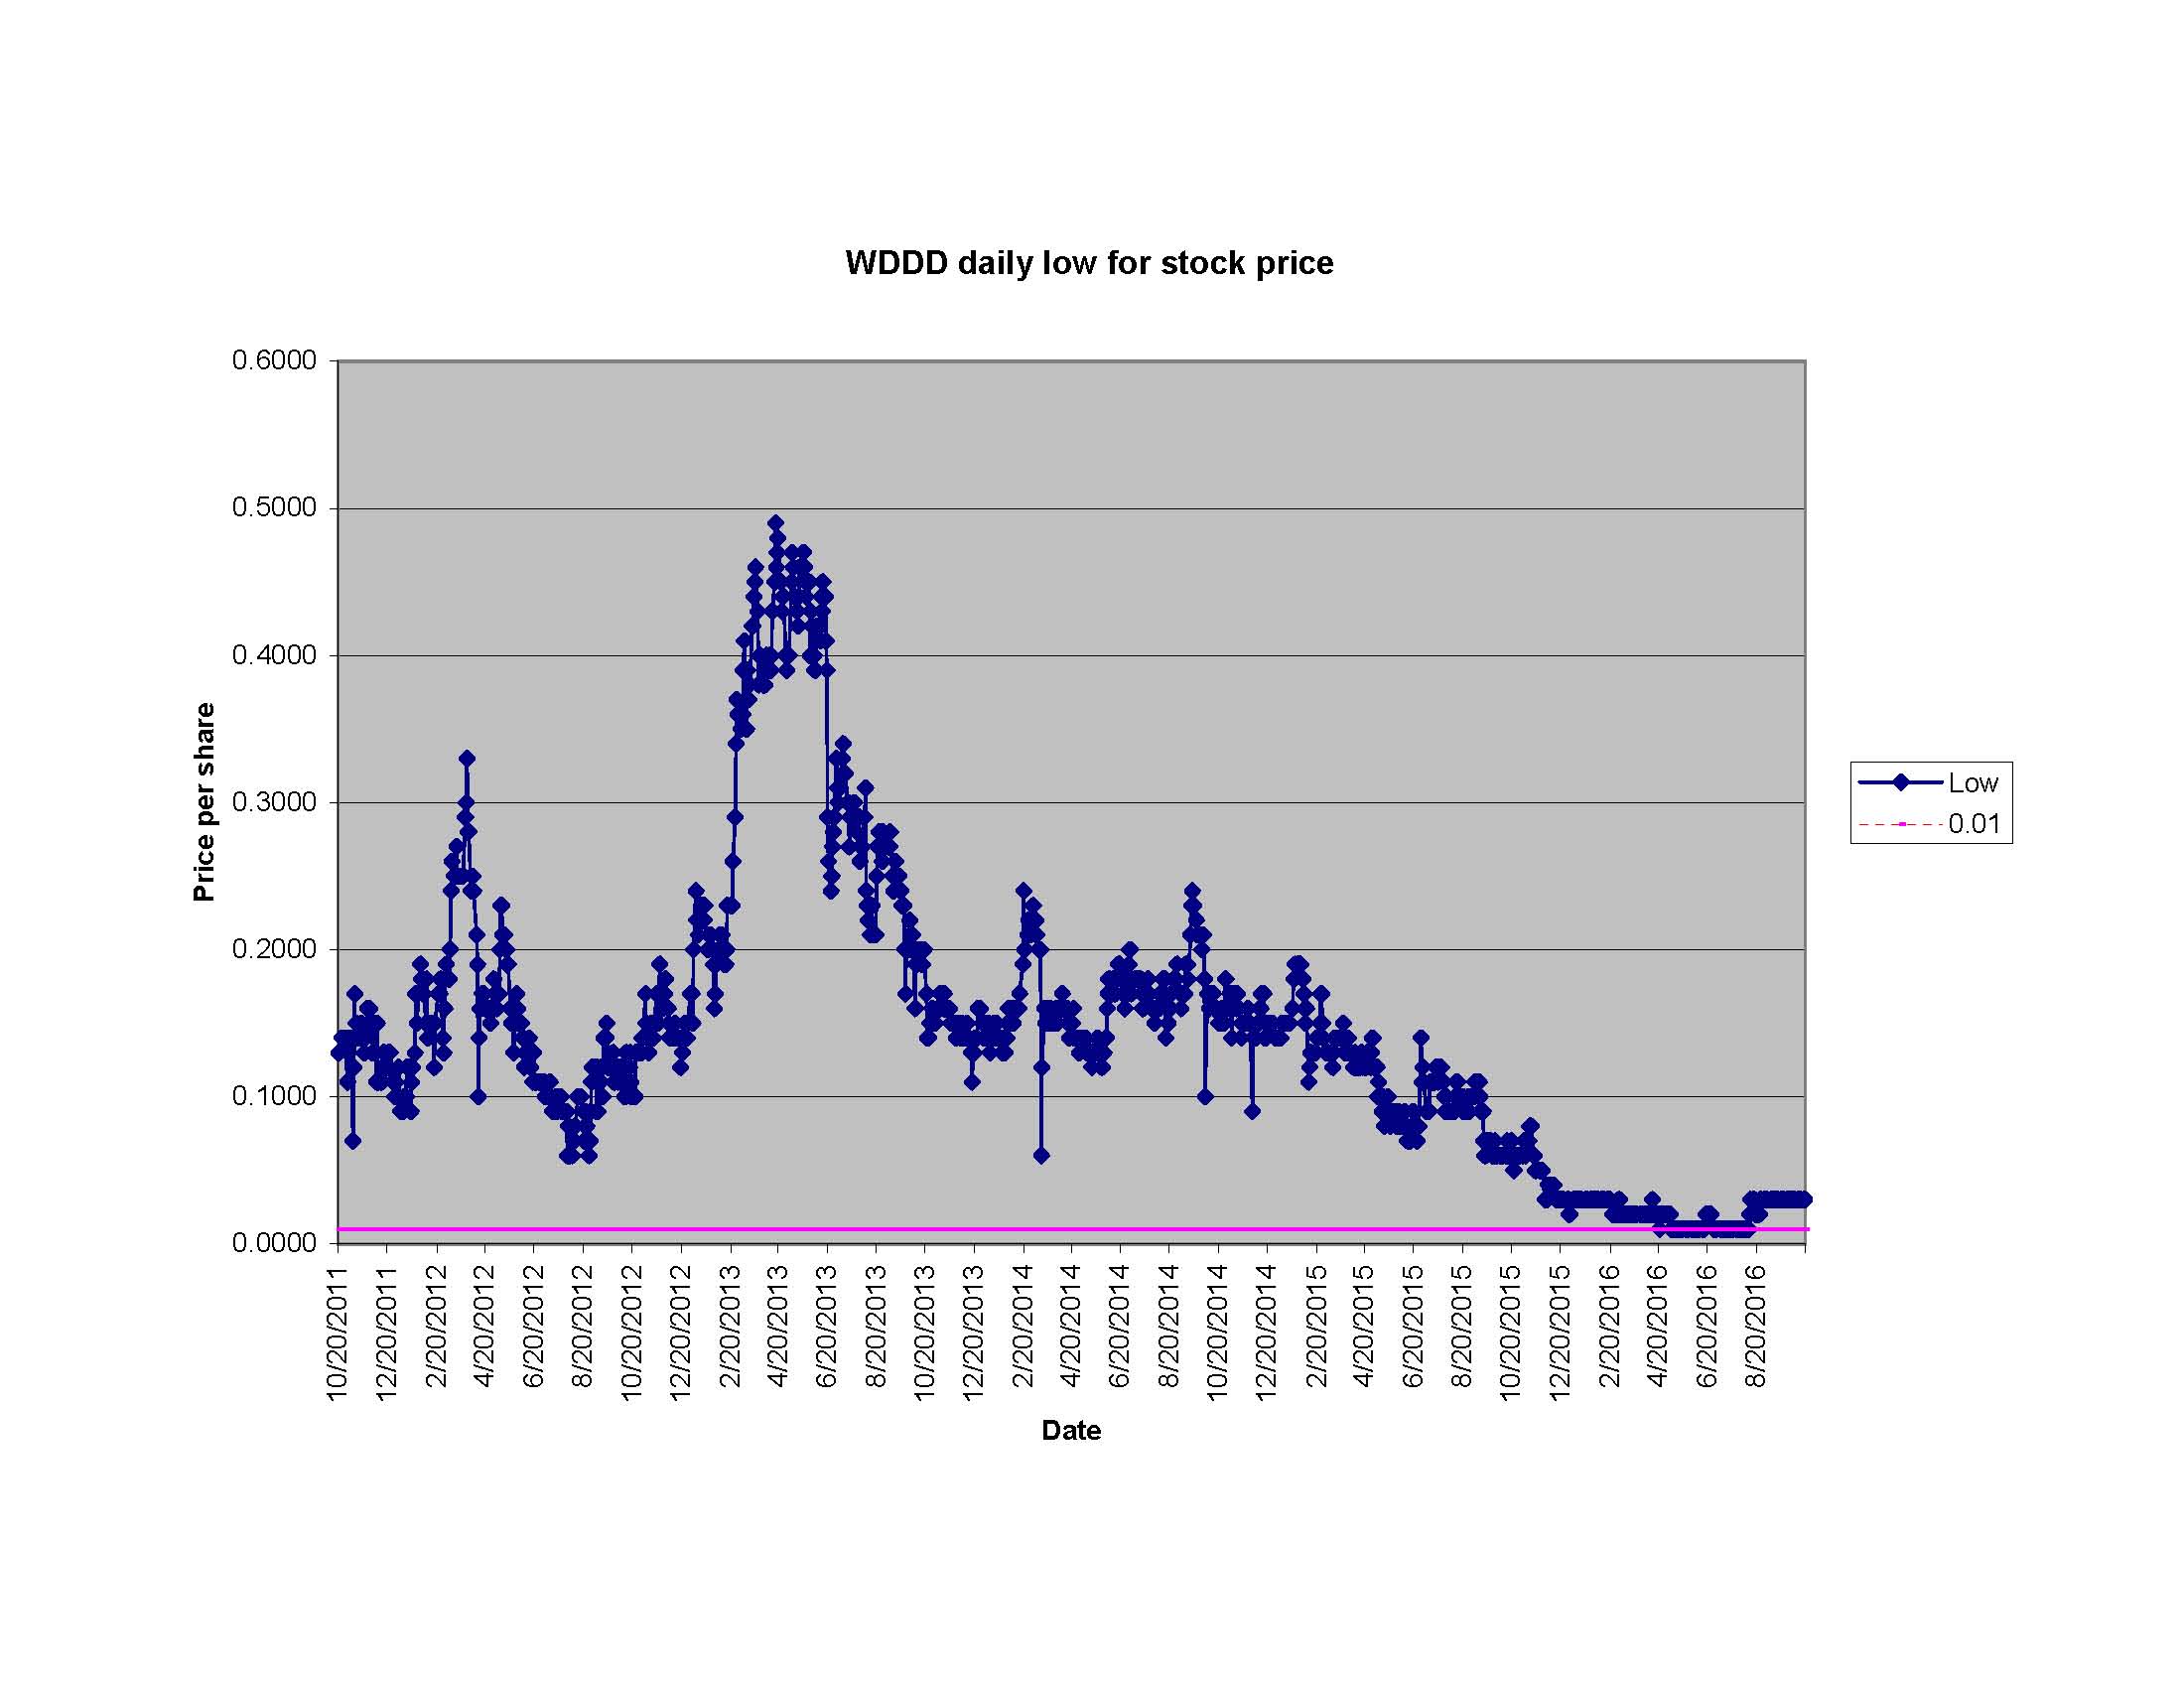
Attached please find a five year chart of the daily lows for WDDD. The data is for 10/20/2011 through 10/19/2016. There are 1,258 trading days of which 63 days had WDDD trading as low or below $0.01 per share.
The blue line shows the daily low for each day.
The red line is $0.01 so one can see when the daily low was at or below $0.01.
The oldest daily trading low at or below $0.01 for WDDD was 04/21/2016 and the most recent was 08/10/2016.
You will note that over time the stock price has trended lower.
Louis J. Desy Jr.
Recent WDDD News
- Form 8-K - Current report • Edgar (US Regulatory) • 12/19/2023 09:30:21 PM
- Form 10-Q - Quarterly report [Sections 13 or 15(d)] • Edgar (US Regulatory) • 08/11/2023 06:34:14 PM
NanoViricides Reports that the Phase I NV-387 Clinical Trial is Completed Successfully and Data Lock is Expected Soon • NNVC • May 2, 2024 10:07 AM
ILUS Files Form 10-K and Provides Shareholder Update • ILUS • May 2, 2024 8:52 AM
Avant Technologies Names New CEO Following Acquisition of Healthcare Technology and Data Integration Firm • AVAI • May 2, 2024 8:00 AM
Bantec Engaged in a Letter of Intent to Acquire a Small New Jersey Based Manufacturing Company • BANT • May 1, 2024 10:00 AM
Cannabix Technologies to Deliver Breath Logix Alcohol Screening Device to Australia • BLO • Apr 30, 2024 8:53 AM
Hydromer, Inc. Reports Preliminary Unaudited Financial Results for First Quarter 2024 • HYDI • Apr 29, 2024 9:10 AM

