


| Followers | 386 |
| Posts | 9065 |
| Boards Moderated | 3 |
| Alias Born | 03/04/2006 |
Wednesday, October 19, 2016 2:59:26 PM
Oct 18, 2016 at 11:01 AM
image
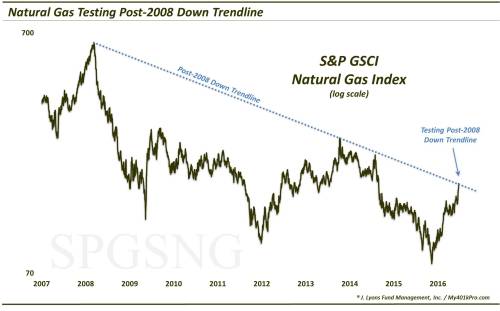
Potential price resistance is among several obstacles posing a challenge to the recent rally in Nat Gas.
As equity managers, we mostly talk about the equity market. And for the past 8 months, much of that talk has centered around the post-February stock market rally. However, stocks aren’t the only thing that have bounced sharply since early in the year. Many commodities have also rallied, including natural gas. In fact, nat gas has more than doubled since bottoming at the beginning of March (we do not trade futures so that performance is measured by the S&P GSCI Natural Gas Index which closely tracks the commodity – unlike the ETP’s [e.g., UNG] that have obvious tracking issues).
That said, there are a few factors that may present a challenge currently to the rally in natural gas. Not the least of which is price. Specifically, the GSCI Nat Gas Index is bumping up against the Down trendline stemming from its 2008 top and connecting the early and late 2014 tops.
image
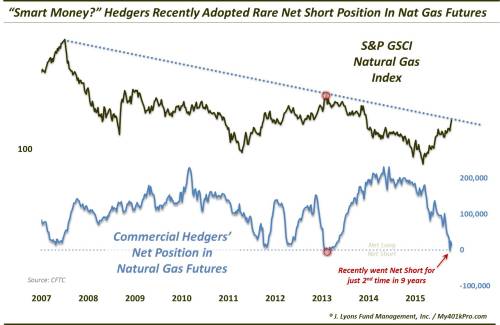
This trendline may present a hurdle for the current extension of the nat gas rally. That is not the only challenge potentially facing it, however. One other red flag comes in the form of positioning in the natural gas futures market. Specifically, according to the CFTC, Commercial Hedgers recently adopted a net short position for just the 2nd time in the past 9 years. The concern is that these Hedgers most often represent the “smart money” once positioning gets to an extreme. Thus, this rare net short position indicates a potential headwind for nat gas prices, at least based on historical behavior.
Early 2014 was the only other time Hedgers went net short in the last 9 years. Nat gas prices peaked immediately and commenced their 2-year ~70% decline. Additionally, other times since 2007 that saw the Hedgers approach a net short position coincided with at least short-term tops, including October 2012, April 2013 and the major, long-term top in 2008.
At least one other red flag for the nat gas rally comes in the way of seasonality. Now, seasonality represents overall historical tendencies and, thus, should not be taken as gospel. However, according to www.sentimentrader.com, on average, by far the best 2 months of the year for natural gas prices are September and October. After that, they tend to peak and the subsequent 4 months have negative average returns, historically.
The rally in natural gas this year has been impressive, including a 20% pop to 2-year highs in just the past 2 weeks. Thus, the bulls are firmly in control. However, at least a trio of obstacles in the form of long-term trendline resistance, futures positioning and seasonality could potentially conspire to extinguish this current leg of this nat gas rally
---------
This article states
Early 2014 was the only other time Hedgers went net short in the last 9 years. Nat gas prices peaked immediately and commenced their 2-year ~70% decline.
But if you look at the chart above it was early 2013 and NG was the same price it was today $3.15-$3.25. NG went on to rally over $1 in next 3 months and over $3 to $6.5 in the next year and 3 months.
Dude that wrote this article cant even read his own chart what a knucklehead
Last Shot Hydration Drink Announced as Official Sponsor of Red River Athletic Conference • EQLB • Jun 20, 2024 2:38 PM
ATWEC Announces Major Acquisition and Lays Out Strategic Growth Plans • ATWT • Jun 20, 2024 7:09 AM
North Bay Resources Announces Composite Assays of 0.53 and 0.44 Troy Ounces per Ton Gold in Trenches B + C at Fran Gold, British Columbia • NBRI • Jun 18, 2024 9:18 AM
VAYK Assembling New Management Team for $64 Billion Domestic Market • VAYK • Jun 18, 2024 9:00 AM
Fifty 1 Labs, Inc Announces Acquisition of Drago Knives, LLC • CAFI • Jun 18, 2024 8:45 AM
Hydromer Announces Attainment of ISO 13485 Certification • HYDI • Jun 17, 2024 9:22 AM

