An increase in bullishness on small-cap stocks is needed to support a new bull market move. Small-cap participation or better yet, small-cap leadership can help determine the health of the market in general.
While reviewing the small-cap ETFs in the DecisionPoint LIVE public ChartList, I noticed some bullish characteristics, especially in comparison to the large-cap SPY which has essentially been traveling sideways. Both IJR and IWM have rising trends. Although both have formed bearish rising wedges, both have also seen a momentum shift. The Price Momentum Oscillator (PMO) on both daily charts has bottomed. I don't like how flat they are and in the case of IWM, it has produced too many signals in the past two weeks to be completely helpful.
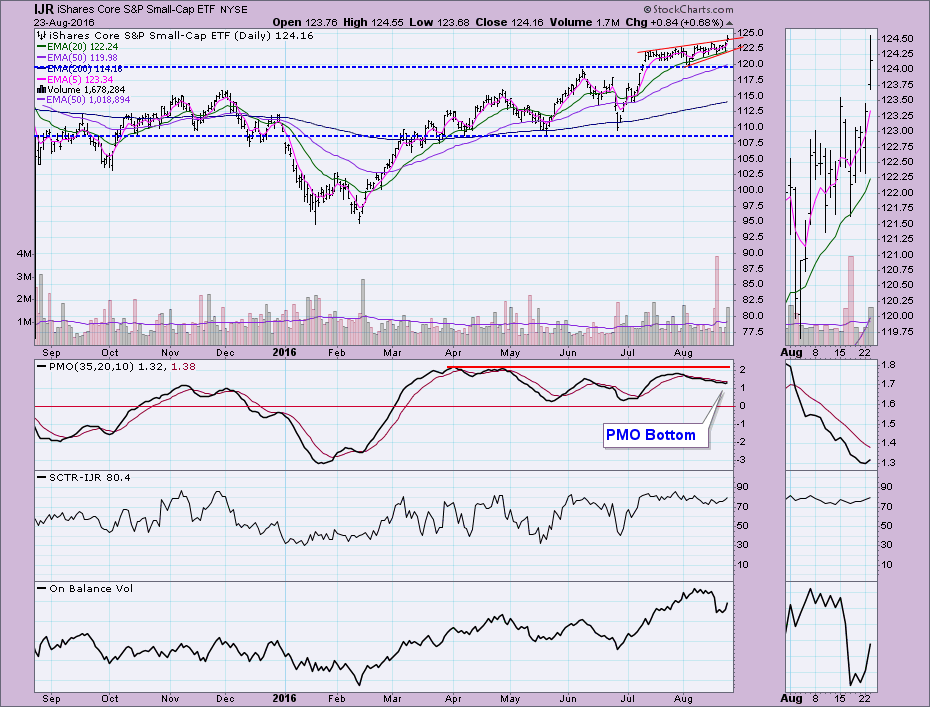
In the case of IJR below, today may've been a bullish breakout from the bearish wedge pattern. Note also that the OBV is recovering from the previous negative price spikes from last week.
The bearish wedge is intact on IWM. OBV has been steadily bullish and the new PMO bottom could be a sign that IWM isn't ready to correct out of the wedge.
The weekly charts are what could override the bearish wedges on the daily charts. Notice that IJR has a clear breakout from the rising trend channel it is trading in (best viewed in the thumbnail). The PMO is rising nicely.
There isn't a breakout on the IWM weekly chart, but the rising trend and PMO are strong. A move to test all-time highs seems likely.
Conclusion: While there are bearish wedges on the daily charts for IJR and IWM, the weekly charts are very encouraging, as are the rising PMOs on both the weekly and daily charts. I recommend you take a quick trip to the DecisionPoint LIVE public ChartList where you can review and compare small-cap daily/weekly/monthly charts to the large-caps.
Technical Analysis is a windsock, not a crystal ball.
Click on "In reply to", for Authors past commentaries.
Information posted to this board is not meant to suggest any specific action, but to point out the technical signs that can help our readers make their own specific decisions. Your Due Dilegence is a must! • DiscoverGold
Register for free to join our community of investors and share your ideas. You will also get access to streaming quotes, interactive charts, trades, portfolio, live options flow and more tools.


 News
News  Market Data
  Discover