


| Followers | 679 |
| Posts | 141047 |
| Boards Moderated | 36 |
| Alias Born | 03/10/2004 |
Saturday, August 06, 2016 11:19:44 AM
* August 6, 2016
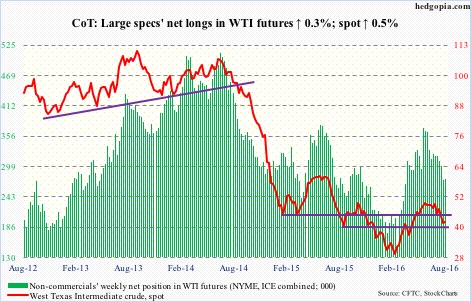
The following are futures positions of non-commercials as of August 2, 2016. Change is week-over-week.
Crude oil: Forced to fight for market share, Saudi Arabia cut prices for Arab Light crude sold to Asia by the most in 10 months. Iran’s production has gone up 25 percent this year, and aims to reach four million barrels per day by year-end. Iraq last month exported a record amount of crude. Here in the U.S., rigs are going up. Markets are once again beginning to worry about oversupply.
Spot West Texas Intermediate crude lost 24 percent in a little less than two months through Wednesday before responding to weekly U.S. data with a 3.3-percent rally, followed by a 2.7-percent rise on Thursday.
The EIA data showed that in the week ended last Friday U.S. crude inventory continued to rise, by 1.4 million barrels to 522.5 million barrels. Stocks are now down 20.8 million barrels from the April 29th high of 543.4 million barrels, which was the highest since the all-time high 545.2 million barrels in October 1929.
Distillate stocks rose 1.2 million barrels to 153.2 million barrels – a 12-week high.
Crude imports rose 301,000 barrels per day to 8.7 million b/d – the highest since October 19, 2012.
On Wednesday, markets instead decided to focus on gasoline stocks, which dropped 3.3 million barrels to 238.2 million barrels – a six-week low.
Crude production dropped, too, by 55,000 b/d, to 8.5 mb/d. Production is down big since peaking at 9.61 mb/d in the June 5th week last year.
Refinery utilization rose nine-tenths of a point to 93.3 percent – a 35-week high.
Spot WTI remains oversold, particularly on the daily chart. If oil bulls put their foot down and push it higher, the area of interest remains $42.50-$43/barrel support, which was broken during the latest sell-off. Then comes the declining 50-day moving average ($46.56), which approximates a falling trend-line resistance from the June 9th high.
Currently net long 275.3k, up 706.
http://www.hedgopia.com/cot-peek-into-future-through-futures-55/
• DiscoverGold.
Click on "In reply to", for Authors past commentaries.
Information posted to this board is not meant to suggest any specific action, but to point out the technical signs that can help our readers make their own specific decisions. Your Due Dilegence is a must!
• DiscoverGold
NanoViricides Reports that the Phase I NV-387 Clinical Trial is Completed Successfully and Data Lock is Expected Soon • NNVC • May 2, 2024 10:07 AM
ILUS Files Form 10-K and Provides Shareholder Update • ILUS • May 2, 2024 8:52 AM
Avant Technologies Names New CEO Following Acquisition of Healthcare Technology and Data Integration Firm • AVAI • May 2, 2024 8:00 AM
Bantec Engaged in a Letter of Intent to Acquire a Small New Jersey Based Manufacturing Company • BANT • May 1, 2024 10:00 AM
Cannabix Technologies to Deliver Breath Logix Alcohol Screening Device to Australia • BLO • Apr 30, 2024 8:53 AM
Hydromer, Inc. Reports Preliminary Unaudited Financial Results for First Quarter 2024 • HYDI • Apr 29, 2024 9:10 AM

