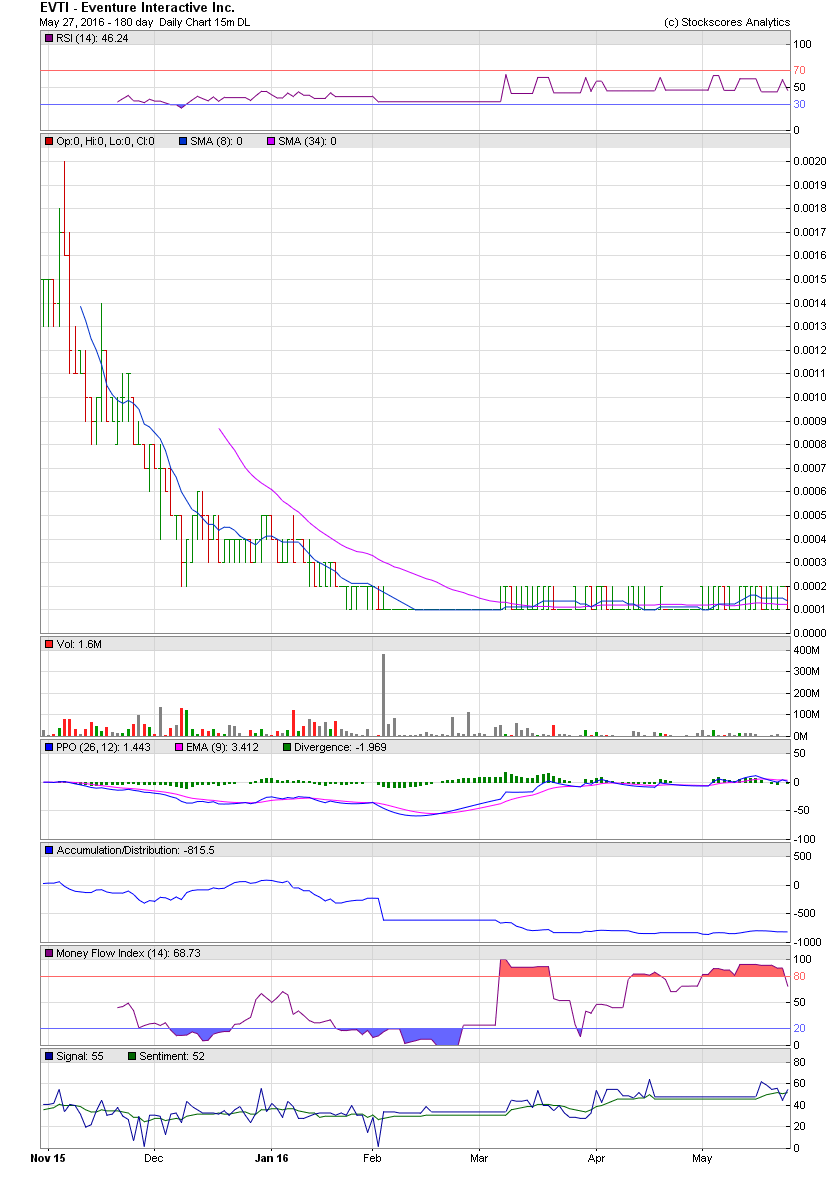
EVTI - will Climb like REDG * Chart Pattern / Share Structure Comparison Analysis EVTI - Targets 0.0007 / 0.001 Note the 400 Million share Grey Volume spike on both charts ! Note the "Musical Chairs" chart pattern of Up and Down Multi-month trading, between 0.0001 and 0.0002 Share Structure Analysis http://investorshub.advfn.com/boards/read_msg.aspx?message_id=123063588 http://investorshub.advfn.com/boards/read_msg.aspx?message_id=123083544 Live! Charts EVTI Chart http://www.barchart.com/chart.php?sym=EVTI&style=technical&template=&p=DO&d=H&sd=&ed=&size=L&log=0&t=CANDLE&v=1&g=1&evnt=1&late=1&o1=&o2=&o3=&sh=100&indicators=&addindicator=&submitted=1&fpage=&txtDate= REDG Chart http://www.barchart.com/chart.php?sym=REDG&t=CANDLE&size=L&v=1&g=1&p=D&d=X&qb=1&style=technical&template= http://www.stockscores.com/chart.asp?TickerSymbol=EVTI&TimeRange=180&Interval=d&Volume=1&ChartType=OHLC&Stockscores=1&ChartWidth=830&ChartHeight=500&LogScale=None&Band=None&avgType1=SMA&movAvg1=8&avgType2=SMA&movAvg2=34&Indicator1=RSI&Indicator2=PPO&Indicator3=AccDist&Indicator4=MFI&endDate=&CompareWith=&entryPrice=&stopLossPrice= http://www.stockscores.com/chart.asp?TickerSymbol=REDG&TimeRange=180&Interval=d&Volume=1&ChartType=OHLC&Stockscores=1&ChartWidth=830&ChartHeight=500&LogScale=None&Band=None&avgType1=SMA&movAvg1=8&avgType2=SMA&movAvg2=34&Indicator1=RSI&Indicator2=PPO&Indicator3=AccDist&Indicator4=MFI&endDate=&CompareWith=&entryPrice=&stopLossPrice= Embedded EVTI Chart http://investorshub.advfn.com/uimage/uploads/2016/5/27/ldejhEVTI_May_27_Chart_1.png Live! REDG Chart http://www.stockscores.com/chart.asp?TickerSymbol=REDG&TimeRange=365&Interval=d&Volume=1&ChartType=OHLC&Stockscores=1&ChartWidth=830&ChartHeight=500&LogScale=None&Band=None&avgType1=SMA&movAvg1=8&avgType2=SMA&movAvg2=34&Indicator1=RSI&Indicator2=PPO&Indicator3=AccDist&Indicator4=MFI&endDate=&CompareWith=&entryPrice=&stopLossPrice=
 News
News  Market Data
  Discover