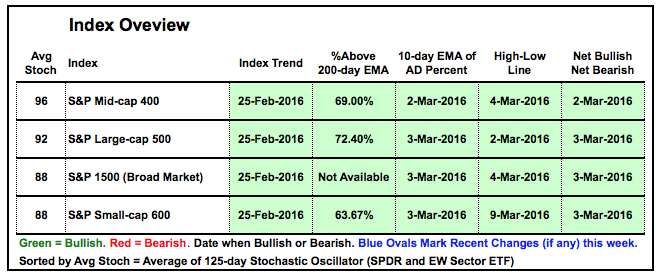
by ART HILL Market Bullish. The table below sums up the breadth and trend signals for the major indexes. I added the 125-day Stochastic Oscillator for ranking purposes. This indicator shows the level of the close relative to the high-low range over the last 125 days (~six months). The index is close to its six month high when above 90 and close to a six month low when below 10. The S&P MidCap 400 has the strongest chart because it is the closest to its six month high.
Register for free to join our community of investors and share your ideas. You will also get access to streaming quotes, interactive charts, trades, portfolio, live options flow and more tools.
 News
News  Market Data
  Discover