


Friday, April 01, 2016 6:12:19 PM
Since 2009, the CWEI Parramore has produced around 70,000bbls and continues to produce. It will likely continue to produce for several years before it is depleted and final tallies are able to be calculated on the success or failure.
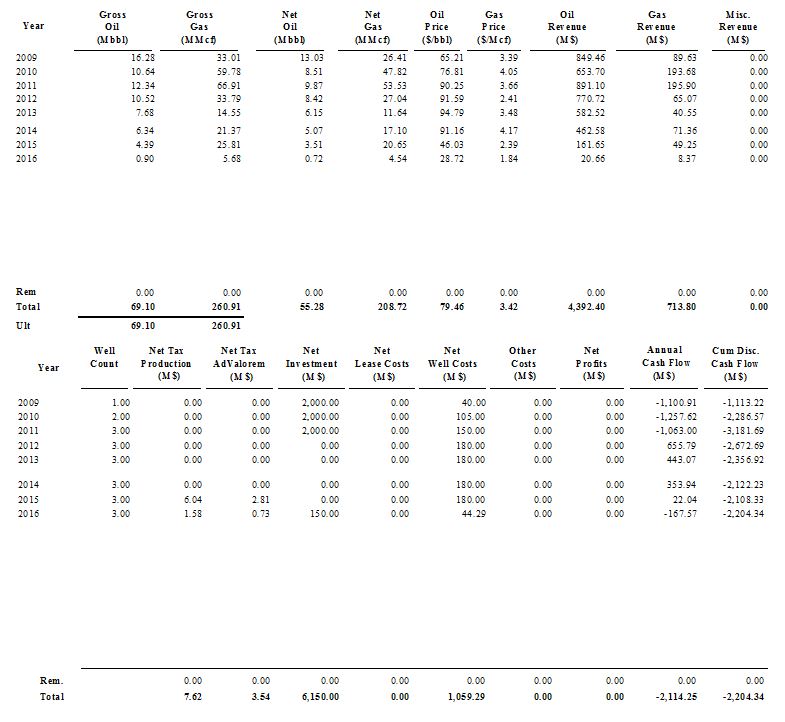
Yes, that is true, except for the years of future production being likely. There are three wells on that lease. The lease has made 23,000 bbls per well. Total cost of the three wells to recover 70 Mbb is optimistically 6 million dollars. That's $86 a bbl in well cost. There is no room for taxes, royalty, and well operating costs. This is a short method of seeing that the wells did not payout, but I calculated it rigorously by taking each month's production for each well and multiplying that production by that month's oil and gas price. I then deducted taxes and royalties and operating expenses, generating a monthly cash flow. Individual well production is not reported to the state, so I used IHS Energy allocated figures for well production. The IHS figures balance back to lease monthly production so any inaccuracy is of little economic consequence.
Here are the prices I used, which are Cushing spot (as reported by EIA) minus 3 dollars differential to adjust to wellhead. Basically same method for gas price, I believe $0.25 differential from Henry Hub spot. Wasn't more than minus $0.30.
Date Oil Gas
01/2009 38.71 4.99
02/2009 36.09 4.27
03/2009 44.94 3.71
04/2009 46.65 3.25
05/2009 56.03 3.58
06/2009 66.64 3.55
07/2009 61.15 3.13
08/2009 68.05 2.89
09/2009 66.41 2.74
10/2009 72.72 3.76
11/2009 74.99 3.41
12/2009 71.47 5.1
01/2010 75.33 5.58
02/2010 73.39 5.07
03/2010 78.2 4.04
04/2010 81.29 3.78
05/2010 70.74 3.89
06/2010 72.34 4.55
07/2010 73.32 4.38
08/2010 73.6 4.07
09/2010 72.24 3.64
10/2010 78.89 3.18
11/2010 81.25 3.46
12/2010 86.15 4
01/2011 86.17 4.24
02/2011 85.58 3.84
03/2011 99.86 3.72
04/2011 106.53 3.99
05/2011 97.9 4.06
06/2011 93.26 4.29
07/2011 94.3 4.17
08/2011 83.33 3.81
09/2011 82.52 3.65
10/2011 83.32 3.32
11/2011 94.16 2.99
12/2011 95.56 2.92
01/2012 97.27 2.42
02/2012 99.2 2.26
03/2012 103.16 1.92
04/2012 100.32 1.7
05/2012 91.66 2.18
06/2012 79.3 2.21
07/2012 84.9 2.7
08/2012 91.13 2.59
09/2012 91.51 2.6
10/2012 86.49 3.07
11/2012 83.53 3.29
12/2012 84.86 3.09
01/2013 91.76 3.08
02/2013 92.31 3.08
03/2013 89.94 3.56
04/2013 89.02 3.92
05/2013 91.51 3.79
06/2013 92.77 3.58
07/2013 101.67 3.37
08/2013 103.57 3.18
09/2013 103.29 3.37
10/2013 97.54 3.43
11/2013 90.86 3.39
12/2013 94.63 3.99
01/2014 91.62 4.46
02/2014 97.82 5.75
03/2014 97.8 4.65
04/2014 99.07 4.41
05/2014 99.18 4.33
06/2014 102.79 4.34
07/2014 100.59 3.8
08/2014 93.54 3.66
09/2014 90.21 3.67
10/2014 81.4 3.53
11/2014 72.79 3.87
12/2014 56.29 3.23
01/2015 44.22 2.74
02/2015 47.58 2.62
03/2015 44.82 2.58
04/2015 51.45 2.36
05/2015 56.27 2.6
06/2015 56.82 2.53
07/2015 47.9 2.59
08/2015 39.87 2.52
09/2015 42.48 2.41
10/2015 43.22 2.09
11/2015 39.44 1.84
12/2015 34.19 1.68
01/2016 28.68 2.03
02/2016 27.32 1.74
For the next 12 months, I used the 02/2016 prices. Then I used $35 and $1.75. Doesn't really about the future prices because the three wells are not commercial. I assumed a royalty burden of 20%.
Wells being brought online more recently seem to be far more efficient than wells drilled in 2009 and 2010
Efficient in what way? There is generally a correlation between sand volume and production rate. It's significant, but not earth shaking (sorry). More sand means more cost. Give me an example of a far more efficient well and I will look into it.
From the time the CWEI Parrramore went into production, up until 2014, $WTIC bounced primarily between $80 and $100.
I'm not seeing that, but the weighted average of the prices I used was 79.46. Adding back the differential it is $82.46
Spot prices from EIA
Apr-2009 49.65
May-2009 59.03
Jun-2009 69.64
Jul-2009 64.15
Aug-2009 71.05
Sep-2009 69.41
Oct-2009 75.72
Nov-2009 77.99
Dec-2009 74.47
Jan-2010 78.33
Feb-2010 76.39
Mar-2010 81.2
Apr-2010 84.29
May-2010 73.74
Jun-2010 75.34
Jul-2010 76.32
Aug-2010 76.6
We are talking about the CWEI Parramore because you claimed Breitling’s position in Sterling County isn’t viable and I don’t understand how your excel spreadsheet provides any verifiable proof of your claims.
You are holding me to a pretty high standard. Don't really care if anyone believes me. Anyone is welcome to do the same calculation and prove or disprove mine. But here you go:
 :
:
If you want individual well numbers, fire up Excel.
Yes, that is true, except for the years of future production being likely. There are three wells on that lease. The lease has made 23,000 bbls per well. Total cost of the three wells to recover 70 Mbb is optimistically 6 million dollars. That's $86 a bbl in well cost. There is no room for taxes, royalty, and well operating costs. This is a short method of seeing that the wells did not payout, but I calculated it rigorously by taking each month's production for each well and multiplying that production by that month's oil and gas price. I then deducted taxes and royalties and operating expenses, generating a monthly cash flow. Individual well production is not reported to the state, so I used IHS Energy allocated figures for well production. The IHS figures balance back to lease monthly production so any inaccuracy is of little economic consequence.
Here are the prices I used, which are Cushing spot (as reported by EIA) minus 3 dollars differential to adjust to wellhead. Basically same method for gas price, I believe $0.25 differential from Henry Hub spot. Wasn't more than minus $0.30.
Date Oil Gas
01/2009 38.71 4.99
02/2009 36.09 4.27
03/2009 44.94 3.71
04/2009 46.65 3.25
05/2009 56.03 3.58
06/2009 66.64 3.55
07/2009 61.15 3.13
08/2009 68.05 2.89
09/2009 66.41 2.74
10/2009 72.72 3.76
11/2009 74.99 3.41
12/2009 71.47 5.1
01/2010 75.33 5.58
02/2010 73.39 5.07
03/2010 78.2 4.04
04/2010 81.29 3.78
05/2010 70.74 3.89
06/2010 72.34 4.55
07/2010 73.32 4.38
08/2010 73.6 4.07
09/2010 72.24 3.64
10/2010 78.89 3.18
11/2010 81.25 3.46
12/2010 86.15 4
01/2011 86.17 4.24
02/2011 85.58 3.84
03/2011 99.86 3.72
04/2011 106.53 3.99
05/2011 97.9 4.06
06/2011 93.26 4.29
07/2011 94.3 4.17
08/2011 83.33 3.81
09/2011 82.52 3.65
10/2011 83.32 3.32
11/2011 94.16 2.99
12/2011 95.56 2.92
01/2012 97.27 2.42
02/2012 99.2 2.26
03/2012 103.16 1.92
04/2012 100.32 1.7
05/2012 91.66 2.18
06/2012 79.3 2.21
07/2012 84.9 2.7
08/2012 91.13 2.59
09/2012 91.51 2.6
10/2012 86.49 3.07
11/2012 83.53 3.29
12/2012 84.86 3.09
01/2013 91.76 3.08
02/2013 92.31 3.08
03/2013 89.94 3.56
04/2013 89.02 3.92
05/2013 91.51 3.79
06/2013 92.77 3.58
07/2013 101.67 3.37
08/2013 103.57 3.18
09/2013 103.29 3.37
10/2013 97.54 3.43
11/2013 90.86 3.39
12/2013 94.63 3.99
01/2014 91.62 4.46
02/2014 97.82 5.75
03/2014 97.8 4.65
04/2014 99.07 4.41
05/2014 99.18 4.33
06/2014 102.79 4.34
07/2014 100.59 3.8
08/2014 93.54 3.66
09/2014 90.21 3.67
10/2014 81.4 3.53
11/2014 72.79 3.87
12/2014 56.29 3.23
01/2015 44.22 2.74
02/2015 47.58 2.62
03/2015 44.82 2.58
04/2015 51.45 2.36
05/2015 56.27 2.6
06/2015 56.82 2.53
07/2015 47.9 2.59
08/2015 39.87 2.52
09/2015 42.48 2.41
10/2015 43.22 2.09
11/2015 39.44 1.84
12/2015 34.19 1.68
01/2016 28.68 2.03
02/2016 27.32 1.74
For the next 12 months, I used the 02/2016 prices. Then I used $35 and $1.75. Doesn't really about the future prices because the three wells are not commercial. I assumed a royalty burden of 20%.
Wells being brought online more recently seem to be far more efficient than wells drilled in 2009 and 2010
Efficient in what way? There is generally a correlation between sand volume and production rate. It's significant, but not earth shaking (sorry). More sand means more cost. Give me an example of a far more efficient well and I will look into it.
From the time the CWEI Parrramore went into production, up until 2014, $WTIC bounced primarily between $80 and $100.
I'm not seeing that, but the weighted average of the prices I used was 79.46. Adding back the differential it is $82.46
Spot prices from EIA
Apr-2009 49.65
May-2009 59.03
Jun-2009 69.64
Jul-2009 64.15
Aug-2009 71.05
Sep-2009 69.41
Oct-2009 75.72
Nov-2009 77.99
Dec-2009 74.47
Jan-2010 78.33
Feb-2010 76.39
Mar-2010 81.2
Apr-2010 84.29
May-2010 73.74
Jun-2010 75.34
Jul-2010 76.32
Aug-2010 76.6
We are talking about the CWEI Parramore because you claimed Breitling’s position in Sterling County isn’t viable and I don’t understand how your excel spreadsheet provides any verifiable proof of your claims.
You are holding me to a pretty high standard. Don't really care if anyone believes me. Anyone is welcome to do the same calculation and prove or disprove mine. But here you go:
 :
: If you want individual well numbers, fire up Excel.
Join the InvestorsHub Community
Register for free to join our community of investors and share your ideas. You will also get access to streaming quotes, interactive charts, trades, portfolio, live options flow and more tools.

