


| Followers | 686 |
| Posts | 142446 |
| Boards Moderated | 35 |
| Alias Born | 03/10/2004 |
Saturday, February 20, 2016 9:30:23 AM
* February 20, 2016
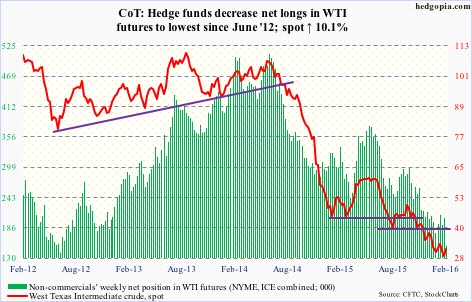
The following are futures positions of non-commercials as of February 16, 2016. Change is week-over-week.
Crude oil: Saudi Arabia, an OPEC member, and Russia (non-OPEC) agreed on Tuesday to freeze crude production at January levels. Qatar and Venezuela (both OPEC) are tagging along. The wildcard Iran remains uncommitted, as is Iraq (both OPEC).
It is a step in the right direction, but it is worth remembering that it is a freeze, not a cut. In a glut situation, a freeze does not help much.
It is this supply-demand imbalance that Deloitte points out that nearly 35 percent of publicly traded oil and gas E&P (exploration & production) companies around the world – about 175 firms – are at high risk of falling into bankruptcy.
For the week ended February 12th, U.S. supply just got worse.
Crude stocks jumped 1.2 million barrels, to a new record 504.1 million barrels. In the past six weeks, inventory has gone up by nearly 22 million barrels!
Gasoline stocks rose by another three million barrels, to 258.7 million barrels – yet another record (data goes back to 1990). This was the 14th straight weekly increase.
Distillate stocks rose by 1.4 million barrels, to 162.4 million barrels. Five weeks ago, stocks (165.6 million barrels) were the highest since the January 21, 2011 week.
As well, crude imports rose by 795,000 barrels per day, to 7.9 million barrels per day.
Here are some positives.
Refinery utilization rose by 2.2 percent, to 88.3 – the first weekly increase in seven weeks. The prior week was a 17-week low. Utilization peaked at 96.1 percent in the August 7th (2015) week.
Crude production dropped by 51,000 barrels per day, to 9.14 mb/d – a 16-week low. Production peaked at 9.61 mb/d in the June 5th (2015) week.
Amidst all this, spot West Texas Intermediate crude hung in there. On January 20th, it made an intra-day low of $27.56. In the next six sessions, it rallied 26 percent. That rally predictably stopped just south of $35. Resistance at $34.50-$35 is heavy.
Once again this Thursday, sellers showed up just north of $34 – just outside the 50-day moving average, which is trying very hard to go flat.
The path of least resistance near-term is down. Non-commercials are not showing much faith in the rally. Net longs have been cut to the lowest since June 2012.
Currently net long 152.8k, down 50.9k.
http://www.hedgopia.com/cot-peek-into-future-through-futures-31/
• George.
Click on "In reply to", for Authors past commentaries.
Information posted to this board is not meant to suggest any specific action, but to point out the technical signs that can help our readers make their own specific decisions. Your Due Dilegence is a must!
• gtsourdinis
Glidelogic Corp. Becomes TikTok Shop Partner, Opening a New Chapter in E-commerce Services • GDLG • Jul 5, 2024 7:09 AM
Freedom Holdings Corporate Update; Announces Management Has Signed Letter of Intent • FHLD • Jul 3, 2024 9:00 AM
EWRC's 21 Moves Gaming Studios Moves to SONY Pictures Studios and Green Lights Development of a Third Upcoming Game • EWRC • Jul 2, 2024 8:00 AM
BNCM and DELEX Healthcare Group Announce Strategic Merger to Drive Expansion and Growth • BNCM • Jul 2, 2024 7:19 AM
NUBURU Announces Upcoming TV Interview Featuring CEO Brian Knaley on Fox Business, Bloomberg TV, and Newsmax TV as Sponsored Programming • BURU • Jul 1, 2024 1:57 PM
Mass Megawatts Announces $220,500 Debt Cancellation Agreement to Improve Financing and Sales of a New Product to be Announced on July 11 • MMMW • Jun 28, 2024 7:30 AM

