Big Candlesticks Form Potential Reversal Pattern in Alcoa By Arthur Hill
* November 23, 2015
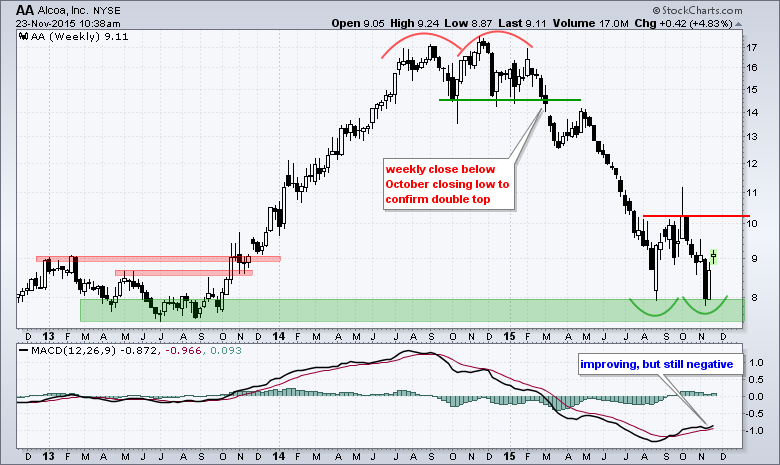
The overall trend for Alcoa is currently down, but the ETF is showing signs of life with a bullish reversal pattern taking shape. The chart shows AA making a round trip from 8 to 8 with a double top at17 in between. Chartists can apply the inverse logic of the double top to the current situation because a double bottom is taking shape. The first low formed in August with a long hollow (white) candlestick and bullish engulfing pattern. The second low formed with a piercing pattern as the stock opened below the prior candlestick low and closed above the mid point of the filled (black) body. Thrown in a long consolidation in the 8 to 9 area in 2013 and there is lots of evidence for support here.
This double bottom is just "potential" because it has yet to be confirmed with a break above the intermittent high. Because of the spike high, I would be tempted to set double bottom resistance at the mid September closing high (9-Oct). A close above this closing high would confirm the double bottom and reverse the downtrend. The indicator window shows MACD turning up in August and moving above its signal line in September. What EXACTLY does this means? This means the distance between the 12-week EMA and 26-week EMA is shrinking as the 12-week EMA draws closer to the 26-week EMA. Note, however, that MACD is still negative and this means the 12-week EMA is still below the 26-week EMA. A MACD cross into positive territory would indicate that the 12-week EMA moved above the 26-week EMA.
**************************************** Thanks for tuning in and have a good day! --Arthur Hill CMT
Click on "In reply to", for Authors past commentaries.
Information posted to this board is not meant to suggest any specific action, but to point out the technical signs that can help our readers make their own specific decisions. Your Due Dilegence is a must! • gtsourdinis
Register for free to join our community of investors and share your ideas. You will also get access to streaming quotes, interactive charts, trades, portfolio, live options flow and more tools.


 News
News  Market Data
  Discover