After the recent bounce off of the September high for the SPY, its short-term indicators finally began to move out of oversold territory. They are only neutral now. I'm looking for these indicators to move into overbought territory. Somewhat overbought territory is fine as this rally appears to be petering out already. It is the short-term indicators that are keeping me short-term bullish right now. Intermediate-term indicators are neutral but falling (check out the chart in the DP Chart Gallery), so I remain intermediate-term/long-term bearish.
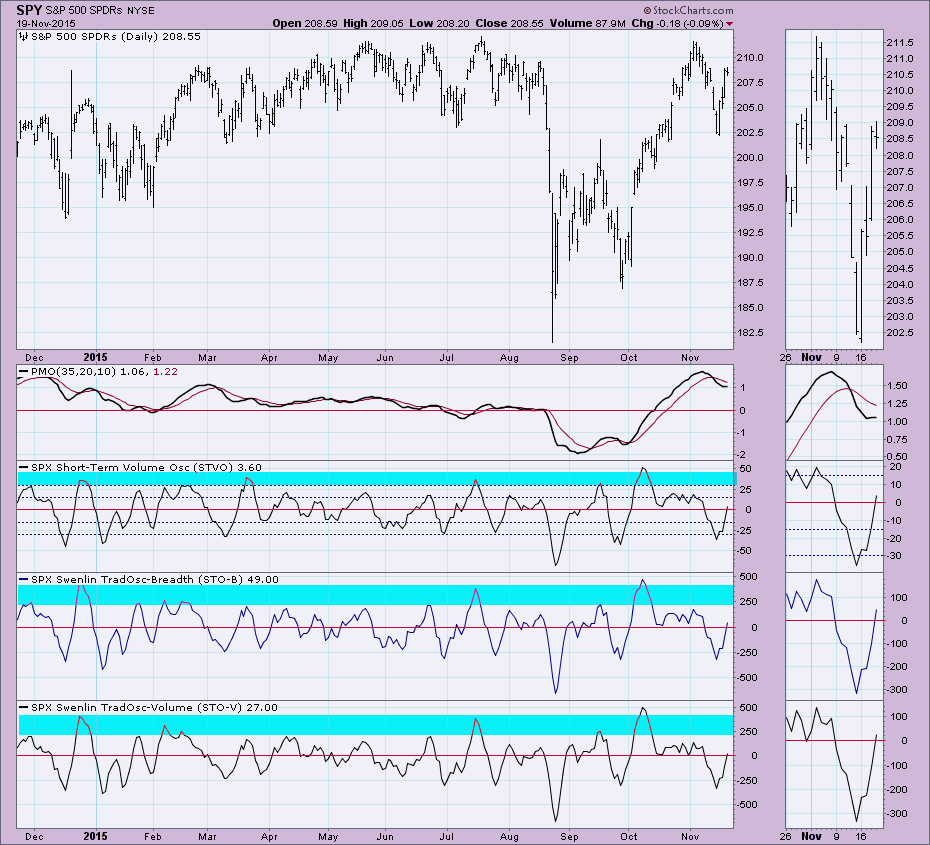
The primary short-term indicators that I follow are the Short-Term Volume Oscillator (STVO) and Swenlin Trading Oscillators (STOs), so let's review that chart first.
All of these indicators are rising which is bullish. The fact that they aren't overbought yet suggests there will be some more upside until they do get overbought. However, and important to note, these oscillators do not require rally days to push their values up, they can also move higher even when the market is consolidating. Today is a case in point. The market spent the day consolidating, yet all of these indicators continued to make their way higher. I've annotated in blue very overbought territory. We have seen these indicators turn down before getting extremely overbought, but I suspect they will move higher and get at least somewhat overbought. That is the plan, anyway.
Conclusion: Looking at where price is, this makes sense. Tomorrow is options expiration so I wouldn't expect to see any major price movement, probably more consolidation on very high volume. Overhead resistance at the November high is looming. This fits right into what these indicators are currently telling us. Short-term expectation is to see more rally and possibly a test of overhead resistance. Even more chop or consolidation should get these indicators to push higher. If we do see price pullback and reverse right now, these indicators would likely top in neutral territory which would be very bearish in the short term.
Technical Analysis is a windsock, not a crystal ball.
Click on "In reply to", for Authors past commentaries.
Information posted to this board is not meant to suggest any specific action, but to point out the technical signs that can help our readers make their own specific decisions. Your Due Dilegence is a must! • gtsourdinis
Register for free to join our community of investors and share your ideas. You will also get access to streaming quotes, interactive charts, trades, portfolio, live options flow and more tools.


 News
News  Market Data
  Discover