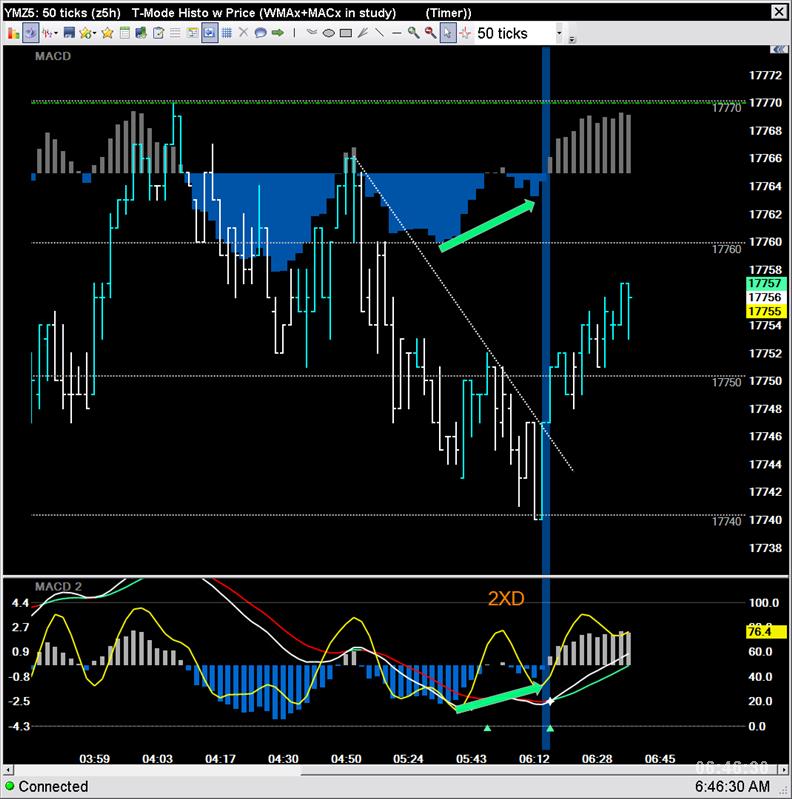
Simple chart reading...2XD DIV TLB To the left of the blue line, the histogram and Stochastic divergences are obvious before the trend line break-out... To the right of the blue line, the EMAs show the trending attributes of MACD...
Register for free to join our community of investors and share your ideas. You will also get access to streaming quotes, interactive charts, trades, portfolio, live options flow and more tools.
 News
News  Market Data
  Discover