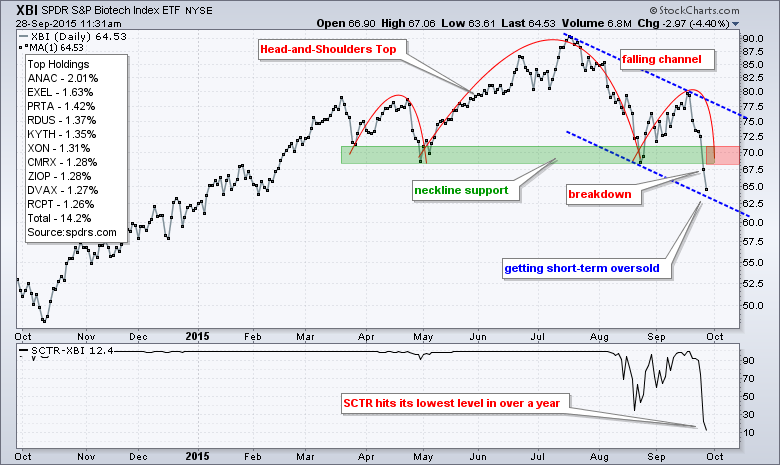
The next chart shows the Biotech SPDR (XBI) forming a head-and-shoulders top from April to September and breaking neckline support with a sharp decline the last two days. Regardless of the pattern, the ETF formed a lower high in mid September and broke below its August low. This lower high and lower low sequence means the ETF is in a downtrend. The blue trend lines mark a falling channel and the ETF is nearing the lower trend line, which suggests that XBI is getting short-term oversold. Broken support in the 70 area turns into the first resistance area to watch should the ETF bounce.
Register for free to join our community of investors and share your ideas. You will also get access to streaming quotes, interactive charts, trades, portfolio, live options flow and more tools.
 News
News  Market Data
  Discover