


Tuesday, July 14, 2015 12:05:43 PM
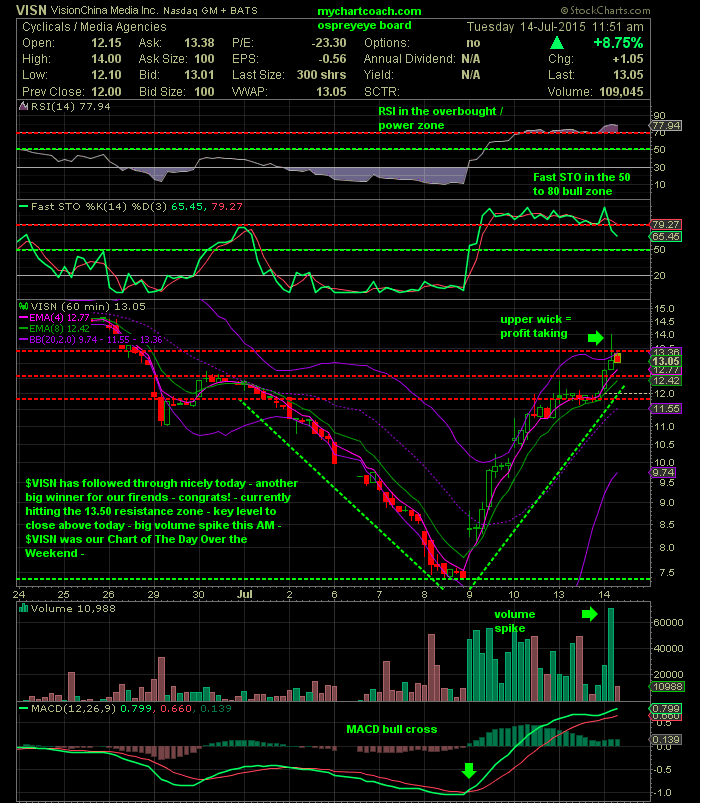
$VISN 60 min. Chart – this is a 60 min. chart – each candle represents 60 min.of trading – very sweet follow through for our weekend “Chart of the Day” – currently hitting the 13.50 resistance zone – Key level to break – the long upper wick on the 2nd hour of trading’s candle shows profit taking off HoD levels – there was also a large volume spike at High of day levels as well – if resistance fails to break it will = downside risk –


Learn how to analyze Charts........link below...........$$$
http://investorshub.advfn.com/boards/read_msg.aspx?message_id=86130044

Recent VISN News
- Form 10-Q - Quarterly report [Sections 13 or 15(d)] • Edgar (US Regulatory) • 04/30/2026 11:13:11 AM
- Form 8-K - Current report • Edgar (US Regulatory) • 04/30/2026 11:07:23 AM
- Vistance Networks Reports First Quarter 2026 Results • Business Wire • 04/30/2026 11:05:00 AM
- Form 8-K - Current report • Edgar (US Regulatory) • 04/30/2026 11:02:35 AM
- Vistance Networks to Sell its RUCKUS Networks Business to Belden Inc. for $1.846 Billion • Business Wire • 04/30/2026 11:00:00 AM
- RUCKUS Networks and Nokia Announce Early Access Availability for their Combined Solution—an Integrated Wi-Fi 7 and Fiber Optical LAN Solution • Business Wire • 04/13/2026 12:00:00 PM
- Vistance Networks to Release First Quarter 2026 Financial Results on April 30th • Business Wire • 04/09/2026 08:15:00 PM
- Form 8-K - Current report • Edgar (US Regulatory) • 04/08/2026 08:09:56 PM
- Vistance Networks announces $10 per share special dividend • IH Market News • 04/08/2026 10:55:27 AM
- Vistance Networks Board Approves Special Distribution • Business Wire • 04/07/2026 11:59:00 PM
- Aurora Networks and HUBER+SUHNER Join Forces to Help Vodafone Germany Develop a Next-Generation Network • Business Wire • 03/24/2026 06:30:00 AM
- Form ARS - Annual Report to Security Holders • Edgar (US Regulatory) • 03/23/2026 08:50:34 PM
- Form DEFA14A - Additional definitive proxy soliciting materials and Rule 14(a)(12) material • Edgar (US Regulatory) • 03/23/2026 08:48:53 PM
- Form DEF 14A - Other definitive proxy statements • Edgar (US Regulatory) • 03/23/2026 08:47:17 PM
- LAFC and RUCKUS Networks Deploy Next-Generation Wi-Fi 7 Network at BMO Stadium • Business Wire • 03/03/2026 01:00:00 PM
- Form 4 - Statement of changes in beneficial ownership of securities • Edgar (US Regulatory) • 02/26/2026 09:21:16 PM
- Form 8-K - Current report • Edgar (US Regulatory) • 02/26/2026 11:32:23 AM
- Vistance Networks Reports Fourth Quarter and Full Year 2025 Results • Business Wire • 02/26/2026 11:30:00 AM
- Form 144 - Report of proposed sale of securities • Edgar (US Regulatory) • 02/25/2026 06:06:17 PM
- Form POS AM - Post-Effective amendments for registration statement • Edgar (US Regulatory) • 02/24/2026 11:30:42 AM
- Vistance Networks to Release Fourth Quarter and Full Year 2025 Financial Results on February 26 • Business Wire • 02/05/2026 09:15:00 PM
- RUCKUS Networks Announces Expanded Pro AV ICX Switch Portfolio for Audio-Visual Over IP Networks • Business Wire • 02/03/2026 01:00:00 PM
- Form 144 - Report of proposed sale of securities • Edgar (US Regulatory) • 02/02/2026 09:00:08 PM
- RUCKUS Networks Announces Official Partnership with TGR Haas F1 Team • Business Wire • 01/21/2026 01:00:00 PM


