


| Followers | 375 |
| Posts | 17014 |
| Boards Moderated | 4 |
| Alias Born | 03/07/2014 |
Friday, March 20, 2015 11:53:42 AM
I'm more a "visual" chart/graph kinda person. I know there's been a lot of dilution on this one from reading their SEC filed 10-Q and 10-K statements. But I wanted to "see" how rapidly or not it's been accelerating and occurring. So I took about 10 minutes and went through the 10-Q/10-K filing links on BHRT's web page- and picked enough files to give me enough data points to get a relatively "smooth" plot.
I just took the O/S share count which is typically PAGE 1 of any 10-Q or 10-K filing (will say something like, "As of date such n such the number of outstanding shares of the registrants common stock was X millions of shares", something like that, always on PAGE 1 or 2 of the SEC filing).
So I just went back to mid 2010 when Tomas took over as CEO and found the O/S share count was then about 27 MILLION shares. As of this just filed 10-K covering to the end of yr 2014, it's now like 647 MILLION shares O/S (668 million shares fully diluted) and climbing rapidly. Here's what it looks like- DILUTION and lots of it. The graph is the date/months/yr on the "X" axis, versus MILLIONS of shares of dilution on the "Y" axis. One can see it's accelerating, going more vertical- not slowing down as some have indicated or implied.
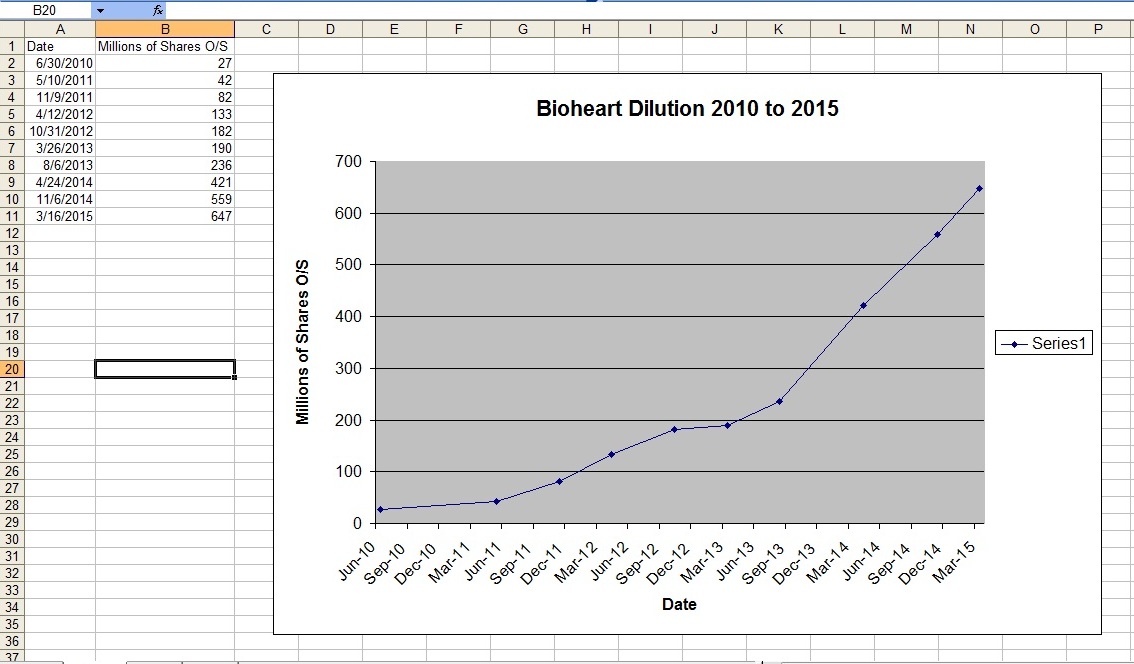
So I just tossed the O/S share numbers and dates real quick into an Excel spread sheet to get a "visual" graph of O/S share dilution and that graph above is what it looks like. IMO it explains a lot of what's happening to the falling share price.
It's one thing to go from say 30 MILLION to 60 MILLION shares in one yr in the past- as that's only 30 million shares the market needed to "soak up". But as the pace picks up and ever accelerates- you now have a past 1 yr where the market now needs to "soak up" 300 MILLION or more shares. It's gonna get harder and harder IMO to "vacuum up" the shear volume of shares hitting the sell-side of the market as the "dilution curve" goes more and more towards vertical as the graph shows.
For an example of what's been happening dilution wise- look at the dates and share count. It took the company from inception/IPO date to about March of 2012 to reach 100 MILLION shares O/S. It then only takes from March of 2012 to about April/May or so of 2013 to double to 200 MILLION shares O/S. It then takes from May of 2013 to only May/June of 2014 to DOUBLE AGAIN to about 400 MILLION shares O/S. And then from May 2014 to now March of 2015 to hit over 640 MILLION shares. Pretty staggering to consider IMO.
And remember, all along the way- the BOD (Board Of Directors) has continually been upping/increasing the A/S (available shares) so they can keep this dilution thing going. The last A/S increase by the BOD increased the available shares now to 2 BILLION available, as they know, they plan to dilute to "no end" essentially IMO. Why else pick a staggering number like 2 BILLION when there was already 950 MILLION shares available when the BOD filed that share-increase authorization SEC filing back in only May of 2014 w/ a SEC Form Schedule 14A filing?
From their IPO in 2008 to mid 2010 when Tomas took over as CEO, BHRT had only reached about 30 million shares outstanding. From mid 2010 to today, about 5 yrs later, the shares O/S have gone up by a factor of more than 23X, just a staggering increase, and still climbing rapidly due to continual use of dilutive financing deals- the most recent deal inked in Feb of 2015 with "Vis Vires" group and also the Magna "credit line" now being tapped, more than likely continually, on-going, for what will be 22 or so more months (if BHRT continues to be in business as a "going concern" for 22 more months, see their latest filed 10-K "going concern warnings" from their auditing firm, PAGES 27, 44, 56, F-2 and F-12.)
Again, just my .009 cents worth. Just some data to look at.
Panther Minerals Inc. Launches Investor Connect AI Chatbot for Enhanced Investor Engagement and Lead Generation • PURR • Jul 9, 2024 9:00 AM
Glidelogic Corp. Becomes TikTok Shop Partner, Opening a New Chapter in E-commerce Services • GDLG • Jul 5, 2024 7:09 AM
Freedom Holdings Corporate Update; Announces Management Has Signed Letter of Intent • FHLD • Jul 3, 2024 9:00 AM
EWRC's 21 Moves Gaming Studios Moves to SONY Pictures Studios and Green Lights Development of a Third Upcoming Game • EWRC • Jul 2, 2024 8:00 AM
BNCM and DELEX Healthcare Group Announce Strategic Merger to Drive Expansion and Growth • BNCM • Jul 2, 2024 7:19 AM
NUBURU Announces Upcoming TV Interview Featuring CEO Brian Knaley on Fox Business, Bloomberg TV, and Newsmax TV as Sponsored Programming • BURU • Jul 1, 2024 1:57 PM

