


Saturday, February 21, 2015 10:41:47 PM
Thoughts on 2014 and ongoing temperature trends
"'Ocean warming (i.e. thermal expansion) and ice sheet loss have been
the dominant contributors to global sea level rise over recent decades.'"
— gavin @ 22 January 2015 .. with links ..
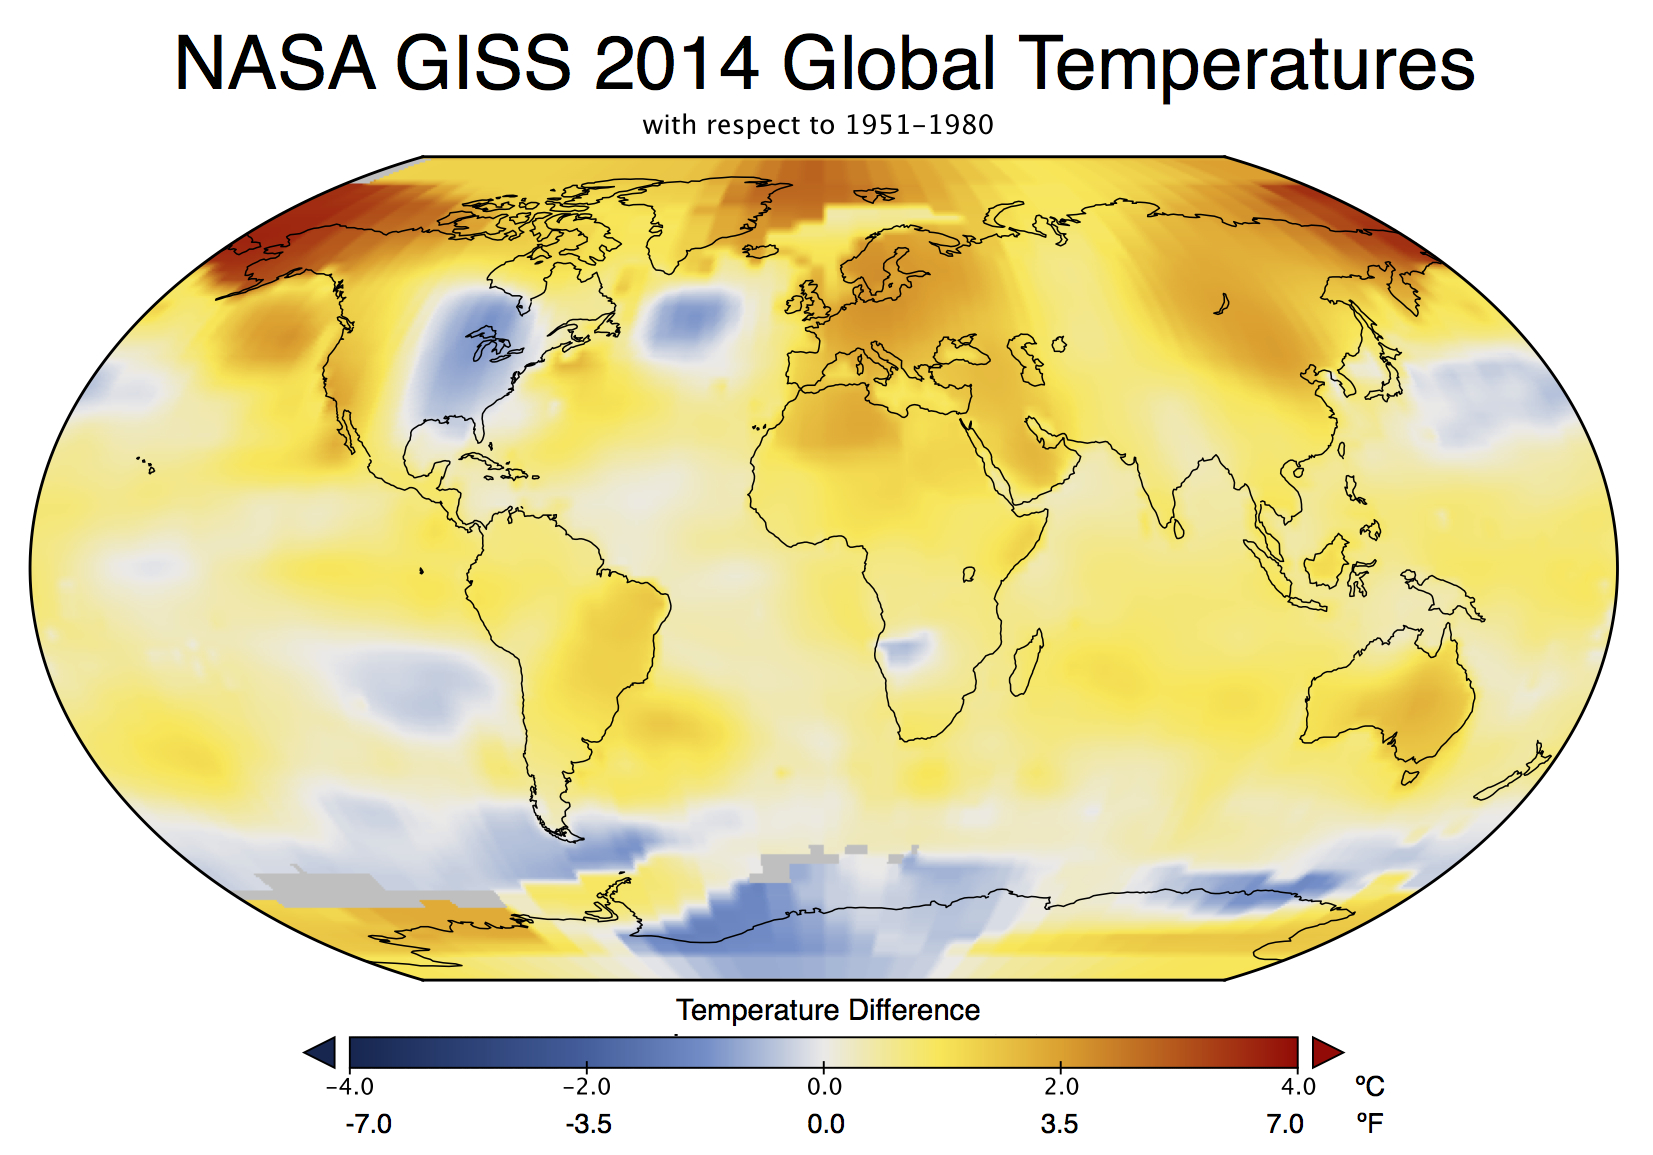
Last Friday, NASA GISS and NOAA NCDC had a press conference and jointly announced the end-of-year analysis for the 2014 global surface temperature anomaly which, in both analyses, came out top. As you may have noticed, this got much more press attention than their joint announcement in 2013 (which wasn’t a record year).
In press briefings and interviews I contributed to, I mostly focused on two issues – that 2014 was indeed the warmest year in those records (though by a small amount), and the continuing long-term trends in temperature which, since they are predominantly driven by increases in greenhouse gases, are going to continue and hence produce (on a fairly regular basis) continuing record years. Response to these points has been mainly straightforward, which is good (if sometimes a little surprising), but there have been some interesting issues raised as well…
Records are bigger stories than trends
This was a huge media story (even my parents noticed!). This is despite (or perhaps because?) the headline statement had been heavily trailed since at least September and cannot have been much of a surprise. In November, WMO put out a preliminary analysis suggesting that 2014 would be a record year. Earlier this month, the Japanese Meteorological Agency (JMA) produced their analysis, also showing a record. Estimates based on independent emulations of the GISTEMP analysis also predicted that the record would be broken (Moyhu, ClearClimateCode).
This is also despite the fact that differences of a few hundredths of a degree are simply not that important to any key questions or issues that might be of some policy relevance. A record year doesn’t appreciably affect attribution of past trends, nor the projection of future ones. It doesn’t re-calibrate estimated impacts or affect assessments of regional vulnerabilities. Records are obviously more expected in the presence of an underlying trend, but whether they occur in 2005, 2010 and 2014, as opposed to 2003, 2007 and 2015 is pretty much irrelevant.
But collectively we do seem to have an apparent fondness for arbitrary thresholds (like New Years Eve, 10 year anniversaries, commemorative holidays etc.) before we take stock of something. It isn’t a particularly rational thing – (what was the real importance of Usain Bolt’s breaking the record for the 100m by 0.02 hundredths of a second in 2008?), but people seem to be naturally more interested in the record holder than in the also-rans. Given then that 2014 was a record year, interest was inevitably going to be high. Along those lines, Andy Revkin has written about records as ‘front page thoughts’ that is also worth reading.
 [img][/img]
El Niños, La Niñas, Pauses and Hiatuses
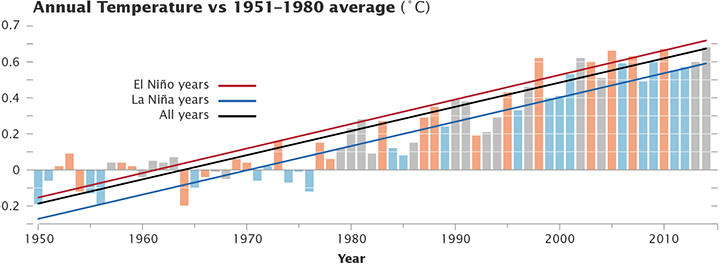
There is a strong correlation between annual mean temperatures (in the satellite tropospheric records and surface analyses) and the state of ENSO at the end of the previous year. Maximum correlations of the short-term interannual fluctuations are usually with prior year SON, OND or NDJ ENSO indices. For instance, 1998, 2005, and 2010 were all preceded by an declared El Niño event at the end of the previous year. The El Niño of 1997/8 was exceptionally strong and this undoubtedly influenced the stand-out temperatures in 1998. 2014 was unusual in that there was no event at the beginning of the year (though neither did the then-record years of 1997, 1990, 1981 or 1980 either).
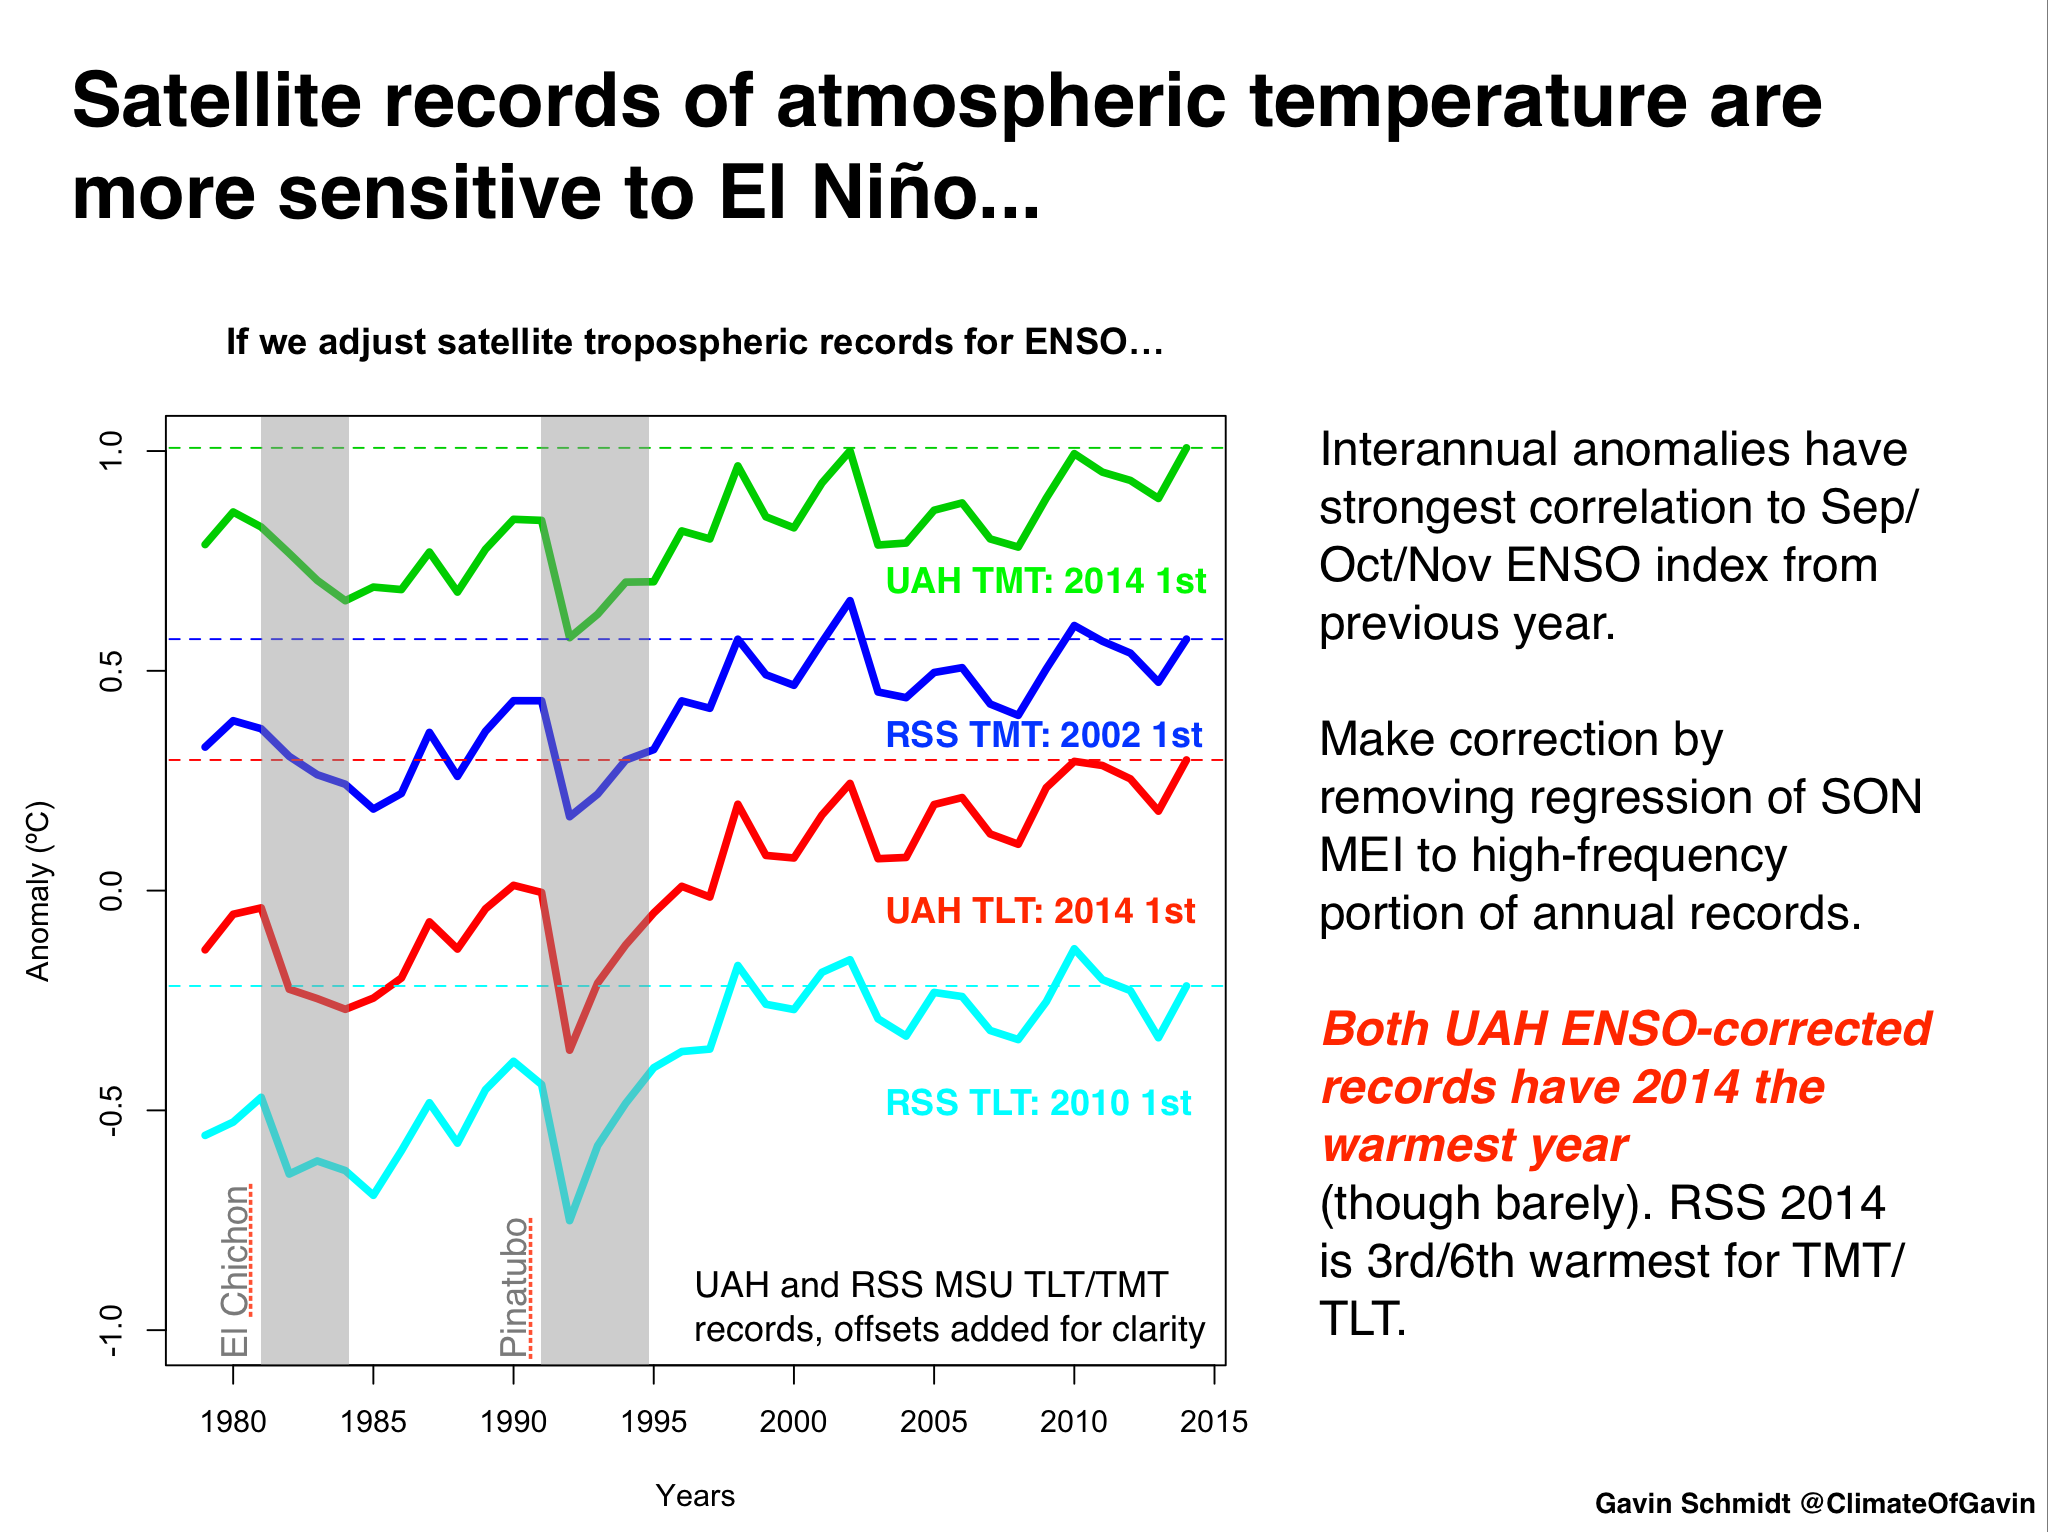
So what would the trends look like if you adjust for the ENSO phase? Are separate datasets differently sensitive to ENSO? Given the importance of the ENSO phasing for the ‘pause’ (see Schmidt et al (2014), this can help assess the underlying long-term trend and whether there is any evidence that it has changed in the recent decade or so.
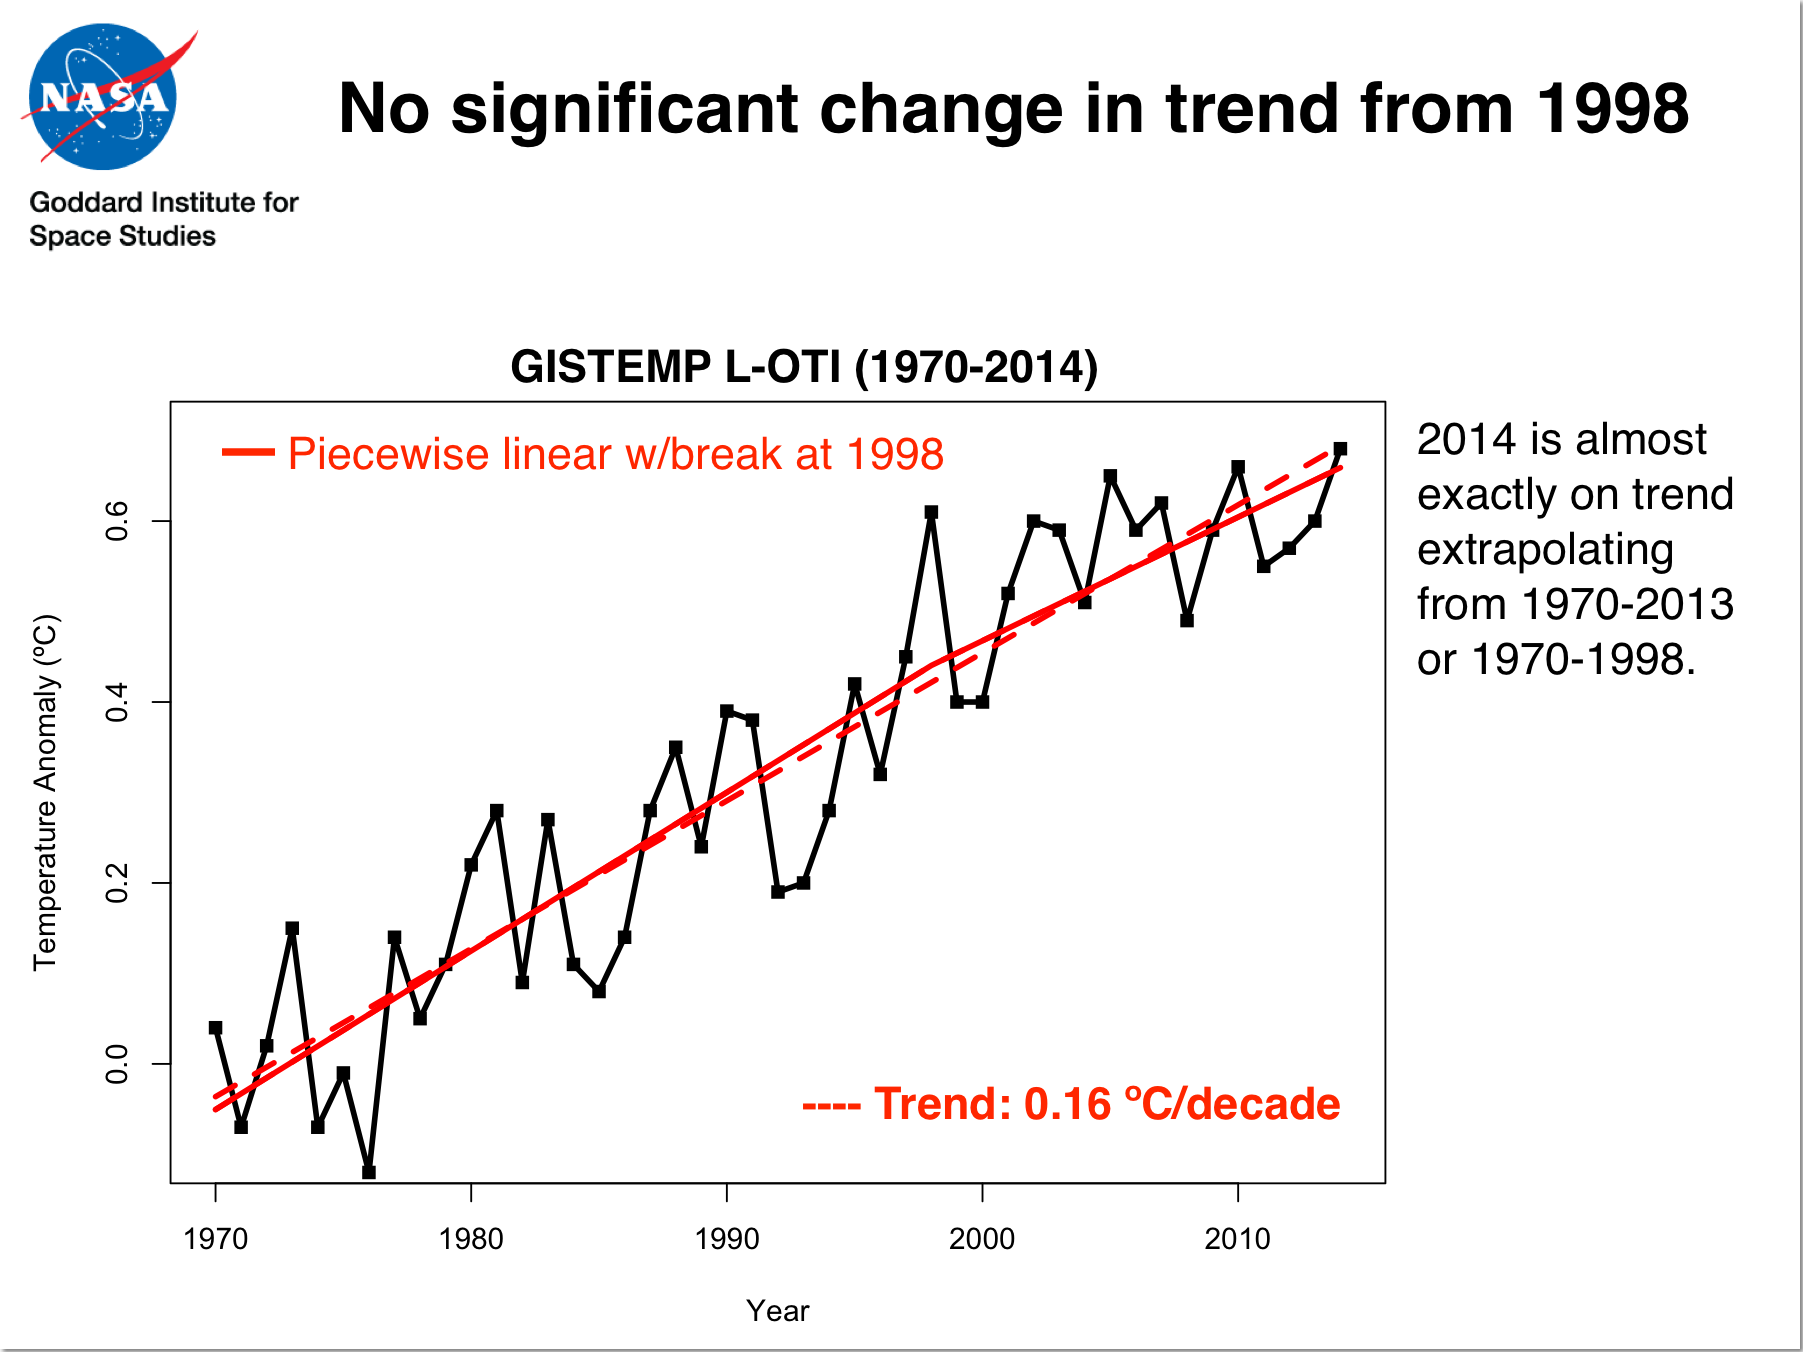
For instance, the regression of the short-term variations in annual MSU TLT data to ENSO is 2.5 times larger than it is to GISTEMP. Since ENSO is the dominant mode of interannual variability, this variance relative to the expected trend due to long-term rises in greenhouse gases implies a lower signal to noise ratio in the satellite data. Interestingly, if you make a correction for ENSO phase, the UAH record would also have had 2014 as a record year (though barely). The impact on the RSS data is less. For GISTEMP, removing the impact of ENSO makes 2014 an even stronger record year relative to previous ones (0.07ºC above 2005, 2006 and 2013), supporting the notion that the underlying long-term trend has not changed appreciably over the last decade or so. (Tamino has a good post on this as well).
Odds and statistics, and odd statistics
Analyses of global temperatures are of course based on a statistical model that ingests imperfect data and has uncertainties due to spatial sampling, inhomogeneities of records (for multiple reasons), errors in transcription etc. Monthly and annual values are therefore subject to some (non-trivial) uncertainty. The HadCRUT4 dataset has, I think, the best treatment of the uncertainties (creating multiple estimates based on a Monte Carlo treatment of input data uncertainties and methodological choices). The Berkeley Earth project also estimates a structural uncertainty based on non-overlapping subsets of raw data. These both suggest that current uncertainties on the annual mean data point are around ±0.05ºC (1 sigma) [Update: the Berkeley Earth estimate is actually half that]. Using those estimates, and assuming that the uncertainties are uncorrelated for year to year (not strictly valid for spatial undersampling, but this gives a conservative estimate), one can estimate the odds of 2014 being a record year, or of beating 2010 – the previous record. This was done by both NOAA and NASA and presented at the press briefing (see slide 5).

In both analyses, the values for 2014 are the warmest, but are statistically close to that of 2010 and 2005. In NOAA analysis, 2014 is a record by about 0.04ºC, while the difference in the GISTEMP record was 0.02ºC. Given the uncertainties, we can estimated the likelihood that this means 2014 was in fact the planet’s warmest year since 1880. Intuitively, the highest ranked year will be the most likely individual year to be the record (in horse racing terms, that would be the favorite) and indeed, we estimated that 2014 is about 1.5 to ~3 times more likely than 2010 to have been the record. In absolute probability terms, NOAA calculated that 2014 was ~48% likely to be the record versus all other years, while for GISTEMP (because of the smaller margin), there is a higher change of uncertainties changing the ranking (~38%). (Contrary to some press reports, this was indeed fully discussed during the briefing). The data released by Berkeley Earth is similar (with 2014 at ~35%~46% (see comment below)). These numbers are also fragile though and may change with upcoming updates to data sources (including better corrections for non-climatic influences in the ocean temperatures). An alternative formulation is to describe these results as being ‘statistical ties’, but to me that implies that each of the top years is equally likely to be the record, and I don’t think that is an accurate summary of the calculation.
Another set of statistical questions relate to a counterfactual – what are the odds of such a record or series of hot years in the absence of human influences on climate? This question demands a statistical model of the climate system which, of course, has to have multiple sets of assumptions built in. Some of the confusion about these odds as they were reported are related to exactly what those assumptions are.
For instance, the very simplest statistical model might assume that the current natural state of climate would be roughly stable at mid-century values and that annual variations are Gaussian, and uncorrelated from one year to another. Since interannual variations are around 0.07ºC (1 sigma), an anomaly of 0.68ºC is exceptionally unlikely (over 9 sigma, or a probability of ~2×10-19). This is mind-bogglingly unlikely, and is a function of the overly-simple model rather than a statement about the impact of human activity.
Two similar statistical analyses were published last week: AP reported that the odds of nine of the 10 hottest years occurring since 2000 were about 650 million to 1, while Climate Central suggested that a similar calculation (13 of the last 15 years) gave odds of 27 million to 1. These calculations are made assuming that each year’s temperature is an independent draw from a stable distribution, and so their extreme unlikelihood is more of a statement about the model used, rather than the natural vs. anthropogenic question. To see that, think about a situation where there was a trend due to natural factors, this would greater reduce the odds of a hot streak towards the end (as a function of the size of the trend relative to the interannual variability) without it having anything to do with human impacts. Similar effects would be seen if interannual internal variability was strongly autocorrelated (i.e. if excursions in neighbouring years were related). Whether this is the case in the real world is an active research question (though climate models suggest it is not a large effect).
Better statistical models thus might take into account the correlation of interannual variations, or have explicit account of natural drivers (the sun and volcanoes), but will quickly run into difficulties in defining these additional aspects from the single real world data set we have (which includes human impacts).
A more coherent calculation would be to look at the difference between climate model simulations with and without anthropogenic forcing. The difference seen in IPCC AR5 Fig 10.1 between those cases in the 21st Century is about 0.8ºC, with an SD of ~0.15 C for interannual variability in the simulations. If we accept that as a null hypothesis, the odds of seeing a 0.8ºC difference in the absence of human effects is over 5 sigma, with odds (at minimum) of 1 in 1.7 million.
None of these estimates however take into account how likely any of these models are to capture the true behaviour of the system, and that should really be a part of any assessment. The values from a model with unrealistic assumptions is highly unlikely to be a good match to reality and it’s results should be downweighted, while ones that are better should count for more. This is of course subjective – I might feel that coupled GCMs are adequate for this purpose, but it would be easy to find someone who disagreed or who thought that internal decadal variations were being underestimated. An increase of decadal variance, would increase the sigma for the models by a little, reducing the unlikelihood of observed anomaly. Of course, this would need to be justified by some analysis, which itself would be subject to some structural uncertainty… and so on. It is therefore an almost impossible to do a fully objective calculation of these odds. The most one can do is make clear the assumptions being made and allow others to assess whether that makes sense to them.
Of course, whether the odds are 1.7, 27 or 650 million to 1 or less, that is still pretty unlikely, and it’s hard to see any reasonable model giving you a value that would put the basic conclusion in doubt. This is also seen in a related calculation (again using the GCMs) for the attribution of recent warming.
Conclusion
The excitement (and backlash) over these annual numbers provides a window into some of problems in the public discourse on climate. A lot of energy and attention is focused on issues with little relevance to actual decision-making and with no particular implications for deeper understanding of the climate system. In my opinion, the long-term trends or the expected sequence of records are far more important than whether any single year is a record or not. Nonetheless, the records were topped this year, and the interest this generated is something worth writing about.
References
http://www.realclimate.org/index.php/archives/2015/01/thoughts-on-2014-and-ongoing-temperature-trends/
See also:
No, Global Warming Has NOT Stopped .. By Phil Plait
http://investorshub.advfn.com/boards/read_msg.aspx?message_id=106548882
Quote NASA: Consensus: 97% of climate scientists agree
http://investorshub.advfn.com/boards/read_msg.aspx?message_id=111046482
"'Ocean warming (i.e. thermal expansion) and ice sheet loss have been
the dominant contributors to global sea level rise over recent decades.'"
— gavin @ 22 January 2015 .. with links ..
Last Friday, NASA GISS and NOAA NCDC had a press conference and jointly announced the end-of-year analysis for the 2014 global surface temperature anomaly which, in both analyses, came out top. As you may have noticed, this got much more press attention than their joint announcement in 2013 (which wasn’t a record year).
In press briefings and interviews I contributed to, I mostly focused on two issues – that 2014 was indeed the warmest year in those records (though by a small amount), and the continuing long-term trends in temperature which, since they are predominantly driven by increases in greenhouse gases, are going to continue and hence produce (on a fairly regular basis) continuing record years. Response to these points has been mainly straightforward, which is good (if sometimes a little surprising), but there have been some interesting issues raised as well…

Records are bigger stories than trends
This was a huge media story (even my parents noticed!). This is despite (or perhaps because?) the headline statement had been heavily trailed since at least September and cannot have been much of a surprise. In November, WMO put out a preliminary analysis suggesting that 2014 would be a record year. Earlier this month, the Japanese Meteorological Agency (JMA) produced their analysis, also showing a record. Estimates based on independent emulations of the GISTEMP analysis also predicted that the record would be broken (Moyhu, ClearClimateCode).
This is also despite the fact that differences of a few hundredths of a degree are simply not that important to any key questions or issues that might be of some policy relevance. A record year doesn’t appreciably affect attribution of past trends, nor the projection of future ones. It doesn’t re-calibrate estimated impacts or affect assessments of regional vulnerabilities. Records are obviously more expected in the presence of an underlying trend, but whether they occur in 2005, 2010 and 2014, as opposed to 2003, 2007 and 2015 is pretty much irrelevant.
But collectively we do seem to have an apparent fondness for arbitrary thresholds (like New Years Eve, 10 year anniversaries, commemorative holidays etc.) before we take stock of something. It isn’t a particularly rational thing – (what was the real importance of Usain Bolt’s breaking the record for the 100m by 0.02 hundredths of a second in 2008?), but people seem to be naturally more interested in the record holder than in the also-rans. Given then that 2014 was a record year, interest was inevitably going to be high. Along those lines, Andy Revkin has written about records as ‘front page thoughts’ that is also worth reading.
 [img][/img]
 El Niños, La Niñas, Pauses and Hiatuses
There is a strong correlation between annual mean temperatures (in the satellite tropospheric records and surface analyses) and the state of ENSO at the end of the previous year. Maximum correlations of the short-term interannual fluctuations are usually with prior year SON, OND or NDJ ENSO indices. For instance, 1998, 2005, and 2010 were all preceded by an declared El Niño event at the end of the previous year. The El Niño of 1997/8 was exceptionally strong and this undoubtedly influenced the stand-out temperatures in 1998. 2014 was unusual in that there was no event at the beginning of the year (though neither did the then-record years of 1997, 1990, 1981 or 1980 either).

So what would the trends look like if you adjust for the ENSO phase? Are separate datasets differently sensitive to ENSO? Given the importance of the ENSO phasing for the ‘pause’ (see Schmidt et al (2014), this can help assess the underlying long-term trend and whether there is any evidence that it has changed in the recent decade or so.
For instance, the regression of the short-term variations in annual MSU TLT data to ENSO is 2.5 times larger than it is to GISTEMP. Since ENSO is the dominant mode of interannual variability, this variance relative to the expected trend due to long-term rises in greenhouse gases implies a lower signal to noise ratio in the satellite data. Interestingly, if you make a correction for ENSO phase, the UAH record would also have had 2014 as a record year (though barely). The impact on the RSS data is less. For GISTEMP, removing the impact of ENSO makes 2014 an even stronger record year relative to previous ones (0.07ºC above 2005, 2006 and 2013), supporting the notion that the underlying long-term trend has not changed appreciably over the last decade or so. (Tamino has a good post on this as well).

Odds and statistics, and odd statistics
Analyses of global temperatures are of course based on a statistical model that ingests imperfect data and has uncertainties due to spatial sampling, inhomogeneities of records (for multiple reasons), errors in transcription etc. Monthly and annual values are therefore subject to some (non-trivial) uncertainty. The HadCRUT4 dataset has, I think, the best treatment of the uncertainties (creating multiple estimates based on a Monte Carlo treatment of input data uncertainties and methodological choices). The Berkeley Earth project also estimates a structural uncertainty based on non-overlapping subsets of raw data. These both suggest that current uncertainties on the annual mean data point are around ±0.05ºC (1 sigma) [Update: the Berkeley Earth estimate is actually half that]. Using those estimates, and assuming that the uncertainties are uncorrelated for year to year (not strictly valid for spatial undersampling, but this gives a conservative estimate), one can estimate the odds of 2014 being a record year, or of beating 2010 – the previous record. This was done by both NOAA and NASA and presented at the press briefing (see slide 5).

In both analyses, the values for 2014 are the warmest, but are statistically close to that of 2010 and 2005. In NOAA analysis, 2014 is a record by about 0.04ºC, while the difference in the GISTEMP record was 0.02ºC. Given the uncertainties, we can estimated the likelihood that this means 2014 was in fact the planet’s warmest year since 1880. Intuitively, the highest ranked year will be the most likely individual year to be the record (in horse racing terms, that would be the favorite) and indeed, we estimated that 2014 is about 1.5 to ~3 times more likely than 2010 to have been the record. In absolute probability terms, NOAA calculated that 2014 was ~48% likely to be the record versus all other years, while for GISTEMP (because of the smaller margin), there is a higher change of uncertainties changing the ranking (~38%). (Contrary to some press reports, this was indeed fully discussed during the briefing). The data released by Berkeley Earth is similar (with 2014 at ~35%~46% (see comment below)). These numbers are also fragile though and may change with upcoming updates to data sources (including better corrections for non-climatic influences in the ocean temperatures). An alternative formulation is to describe these results as being ‘statistical ties’, but to me that implies that each of the top years is equally likely to be the record, and I don’t think that is an accurate summary of the calculation.
Another set of statistical questions relate to a counterfactual – what are the odds of such a record or series of hot years in the absence of human influences on climate? This question demands a statistical model of the climate system which, of course, has to have multiple sets of assumptions built in. Some of the confusion about these odds as they were reported are related to exactly what those assumptions are.
For instance, the very simplest statistical model might assume that the current natural state of climate would be roughly stable at mid-century values and that annual variations are Gaussian, and uncorrelated from one year to another. Since interannual variations are around 0.07ºC (1 sigma), an anomaly of 0.68ºC is exceptionally unlikely (over 9 sigma, or a probability of ~2×10-19). This is mind-bogglingly unlikely, and is a function of the overly-simple model rather than a statement about the impact of human activity.
Two similar statistical analyses were published last week: AP reported that the odds of nine of the 10 hottest years occurring since 2000 were about 650 million to 1, while Climate Central suggested that a similar calculation (13 of the last 15 years) gave odds of 27 million to 1. These calculations are made assuming that each year’s temperature is an independent draw from a stable distribution, and so their extreme unlikelihood is more of a statement about the model used, rather than the natural vs. anthropogenic question. To see that, think about a situation where there was a trend due to natural factors, this would greater reduce the odds of a hot streak towards the end (as a function of the size of the trend relative to the interannual variability) without it having anything to do with human impacts. Similar effects would be seen if interannual internal variability was strongly autocorrelated (i.e. if excursions in neighbouring years were related). Whether this is the case in the real world is an active research question (though climate models suggest it is not a large effect).
Better statistical models thus might take into account the correlation of interannual variations, or have explicit account of natural drivers (the sun and volcanoes), but will quickly run into difficulties in defining these additional aspects from the single real world data set we have (which includes human impacts).
A more coherent calculation would be to look at the difference between climate model simulations with and without anthropogenic forcing. The difference seen in IPCC AR5 Fig 10.1 between those cases in the 21st Century is about 0.8ºC, with an SD of ~0.15 C for interannual variability in the simulations. If we accept that as a null hypothesis, the odds of seeing a 0.8ºC difference in the absence of human effects is over 5 sigma, with odds (at minimum) of 1 in 1.7 million.
None of these estimates however take into account how likely any of these models are to capture the true behaviour of the system, and that should really be a part of any assessment. The values from a model with unrealistic assumptions is highly unlikely to be a good match to reality and it’s results should be downweighted, while ones that are better should count for more. This is of course subjective – I might feel that coupled GCMs are adequate for this purpose, but it would be easy to find someone who disagreed or who thought that internal decadal variations were being underestimated. An increase of decadal variance, would increase the sigma for the models by a little, reducing the unlikelihood of observed anomaly. Of course, this would need to be justified by some analysis, which itself would be subject to some structural uncertainty… and so on. It is therefore an almost impossible to do a fully objective calculation of these odds. The most one can do is make clear the assumptions being made and allow others to assess whether that makes sense to them.
Of course, whether the odds are 1.7, 27 or 650 million to 1 or less, that is still pretty unlikely, and it’s hard to see any reasonable model giving you a value that would put the basic conclusion in doubt. This is also seen in a related calculation (again using the GCMs) for the attribution of recent warming.
Conclusion
The excitement (and backlash) over these annual numbers provides a window into some of problems in the public discourse on climate. A lot of energy and attention is focused on issues with little relevance to actual decision-making and with no particular implications for deeper understanding of the climate system. In my opinion, the long-term trends or the expected sequence of records are far more important than whether any single year is a record or not. Nonetheless, the records were topped this year, and the interest this generated is something worth writing about.
References
http://www.realclimate.org/index.php/archives/2015/01/thoughts-on-2014-and-ongoing-temperature-trends/
See also:
No, Global Warming Has NOT Stopped .. By Phil Plait
http://investorshub.advfn.com/boards/read_msg.aspx?message_id=106548882
Quote NASA: Consensus: 97% of climate scientists agree
http://investorshub.advfn.com/boards/read_msg.aspx?message_id=111046482
It was Plato who said, “He, O men, is the wisest, who like Socrates, knows that his wisdom is in truth worth nothing”
Discover What Traders Are Watching
Explore small cap ideas before they hit the headlines.


