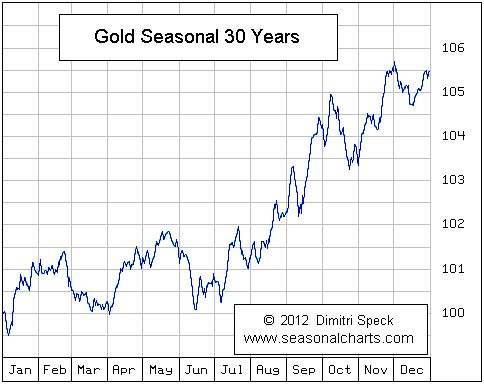
This chart TA the historical trend of the price of gold, based on 30 years of data - the price usually rises until January-February. The challenge is to catch the June lows -
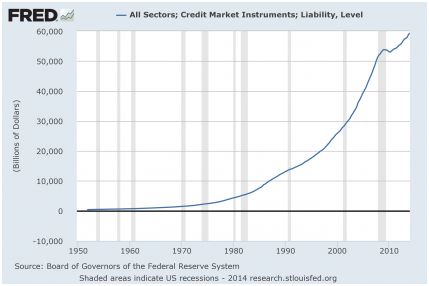
This chart courtesy Federal Reserve Bank of St. Louis shows the total amount of debt in the USA is now 60 trillion dollars. This cannot possibly be paid off, and it will be inflated away. Gold and silver will benefit.
"Gold, unlike all other commodities, is a currency...and the major thrust in the demand for gold is not for jewelry. It’s not for anything other than an escape from what is perceived to be a fiat money system, paper money, that seems to be deteriorating." -– Alan Greenspan, ex-US Federal Reserve Chairman, August 23, 2011
Register for free to join our community of investors and share your ideas. You will also get access to streaming quotes, interactive charts, trades, portfolio, live options flow and more tools.
 News
News  Market Data
  Discover