For the past five weeks, the S&P 500 and NASDAQ Composite have been stuck in choppy, sideways ranges.
This lack of direction has caused the number of low-risk trade setups to dwindle, which is why I said in my most recent blog post that SOH mode (sitting on hands) is the best plan of action until the stock market eventually makes a clear move in one direction or the other.
Are You Ready For Action?
The good news is my top leading technical indicator (explained below) is strongly hinting that stocks may finally be ready to make a significant, definitive move in the coming days…to the downside.
But if stocks are ready to move lower, you may be wondering why that would be considered “good news.”
It would be positive news because, as a technical swing trader, you have the fortunate ability to also profit in weak markets by short selling stocks and ETFs (and any trend is better than no trend).
For traditional “buy and hold” (buy and pray?) investors, on the other hand, a resumption of the selling pressure that began a few months ago would definitely not be good news.
In this blog post, I explain why stocks appear ready to move lower, then follow-up with a brief video analysis of a few stocks and ETFs that are setting up for potential short entry in my daily stock picking newsletter.
The Most Reliable Technical Indicator In Any Market
One of the best technical indicators in a swing trader’s arsenal is volume, which is arguably the most reliable indicator as well.
Yet, volume ironically seems to be one of the least discussed indicators whenever I stumble across other traders’ technical analysis of stocks around the web.
Analysis of volume patterns in the market is crucial because well over half of the stock market’s average daily volume is the result of trading among banks, mutual funds, hedge funds, and other institutions.
As such, the major indices typically follow the money flow of institutional trading.
This means volume is a leading indicator, rather than a lagging indicator (such as moving averages).
If the “big boys” are accumulating stocks (represented by higher volume gains), the market will be forced to move higher.
On the other hand, stocks will move lower when faced with enough institutional distribution (higher volume losses).
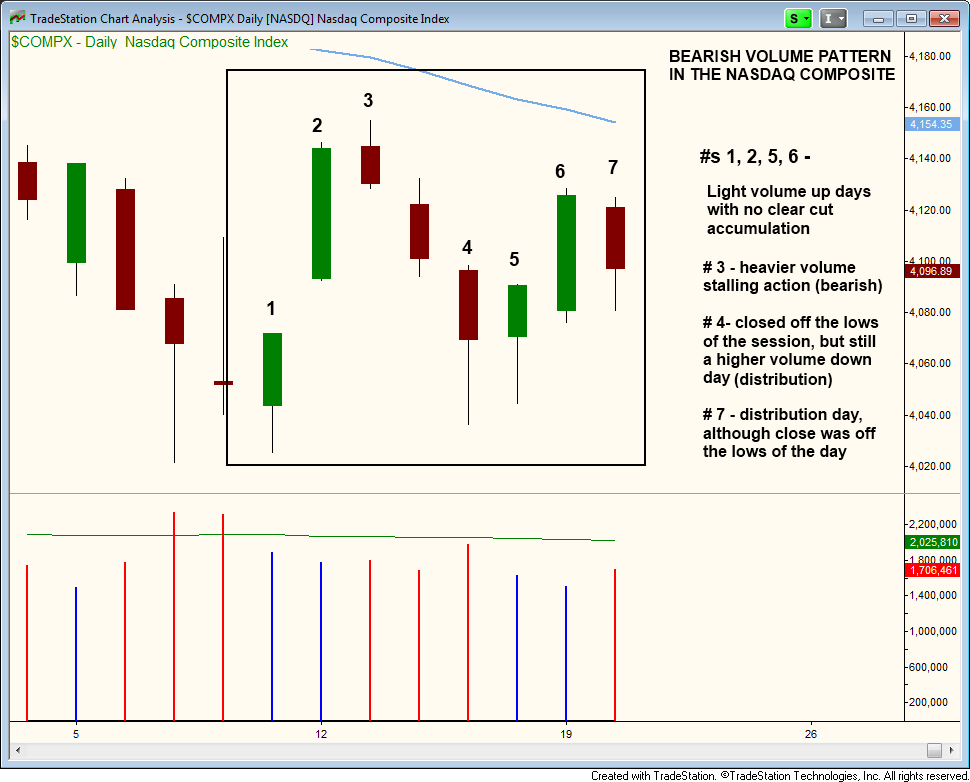
With this knowledge, take a look at the following daily chart of the NASDAQ Composite, which shows the bearish volume pattern of recent weeks (light volume up days, followed by heavier volume down days):
The combination of the bearish volume patterns in the NASDAQ and an abundance of overhead resistance (such as the 50-day moving average), leads me to believe the next move in the stock market will be lower.
To help you make money on the short side of the market if the anticipated breakdown occurs, below is a 3-minute video that highlights a few of the best ETFs and stocks on my radar screen for potential short selling entry in the near-term.
For best viewing quality, select full-screen HD mode by clicking the rectangular icon on the bottom right of video player window:
One of the greatest benefits of momentum trend trading is the ability to profit in both uptrending and downtrending markets.
Although the model portfolio of my nightly swing trading letter has been mostly cash over the past month, I am fully prepared to profit from selling short stocks and ETFs that are rolling over and/or breaking down (assuming the NASDAQ and S&P 500 break down as well).
Register for free to join our community of investors and share your ideas. You will also get access to streaming quotes, interactive charts, trades, portfolio, live options flow and more tools.


 News
News  Market Data
  Discover