News
News  Market Data
  Discover
Support: 888-992-3836
Copyright © 2023 InvestorsHub Inc.


TREND1
![]()
Register for free to join our community of investors and share your ideas. You will also get access to streaming quotes, interactive charts, trades, portfolio, live options flow and more tools.
Register for free to join our community of investors and share your ideas. You will also get access to streaming quotes, interactive charts, trades, portfolio, live options flow and more tools.
40 million unemployed and CGC has never made a profit
You may be right
I bought lots of shares. CGC is still the leader and all the other Cannabis companies know it.
I had no choice and heavily shorted at $23.9 ....
ART HILL 3 XLK INDICATORS
http://www.stockcharts.com/def/servlet/Favorites.CServlet?obj=1401935,40&cmd=show&disp=e
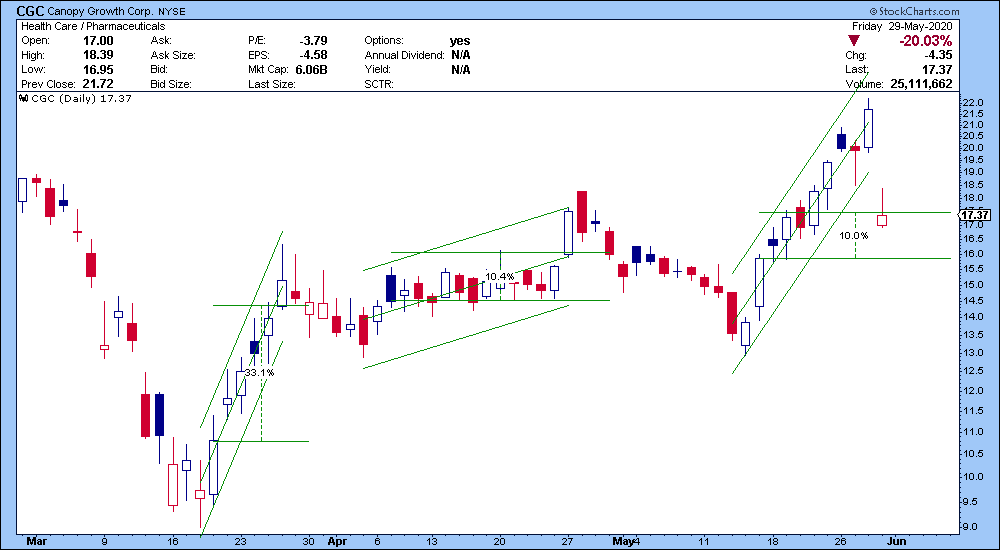
Can you pls explain what the 10 percent means? thx
That is the gain for the trade.
ART HILL BREATH INDICATORS
ART HILL 9 INDICATORS
http://www.stockcharts.com/def/servlet/Favorites.CServlet?obj=1401935,9&cmd=show&disp=e
ART HILL 3 NAS 100 INDICATORS
http://www.stockcharts.com/def/servlet/Favorites.CServlet?obj=1401935,38&cmd=show&disp=e
ART HILL 3 DOW INDICATORS
http://www.stockcharts.com/def/servlet/Favorites.CServlet?obj=1401935,39&cmd=show&disp=e
ART HILL 9 INDICATORS 5 YEARS
http://www.stockcharts.com/def/servlet/Favorites.CServlet?obj=1401935,30&cmd=show&disp=e
ART HILL 3 DOW INDICATORS
http://www.stockcharts.com/def/servlet/Favorites.CServlet?obj=1401935,39&cmd=show&disp=e
CGC TREND SHORT TERM IS DOWN
SHORT TERM TRADE IS DONE.
SEE
http://investorshub.advfn.com/boards/read_msg.aspx?message_id=155935991
Very good question !
And CGC has never made a profit !
The board seems to have taken the earnings drop OK
BACKGROUND DATA
NDX ART HILL INDICATORS
http://www.stockcharts.com/def/servlet/Favorites.CServlet?obj=1401935,33&cmd=show&disp=e
SPXHLP TQQQ
http://www.stockcharts.com/def/servlet/Favorites.CServlet?obj=1401935,28&cmd=show&disp=e
!GT50
http://www.stockcharts.com/def/servlet/Favorites.CServlet?obj=1401935,31&cmd=show&disp=e
10 $BP = A breadth indicator derived from the percentage of stocks on P&F Buy signals.
http://www.stockcharts.com/def/servlet/Favorites.CServlet?obj=1401935,17&cmd=show&disp=e
TRADES 10 MINUTES AND DAY
TQQQ SQQQ 10 MINUTES
http://www.stockcharts.com/def/servlet/Favorites.CServlet?obj=1401935,25&cmd=show&disp=e
TQQQ SQQQ DAY TRADES
http://www.stockcharts.com/def/servlet/Favorites.CServlet?obj=1401935,3&cmd=show&disp=e
ART HILL 3 NAS 100 INDICATORS
http://www.stockcharts.com/def/servlet/Favorites.CServlet?obj=1401935,38&cmd=show&disp=e
SMITHS FALLS, ON, May 29, 2020 /CNW/ - Canopy Growth Corporation ("Canopy Growth" or the "Company") (TSX: WEED) (NYSE: CGC) will release its financial results for the fourth quarter and fiscal year 2020 ended March 31, 2020 before financial markets open on May 29, 2020.
Webcast Information
A live audio webcast will be available at:
https://produceredition.webcasts.com/starthere.jsp?ei=1308617&tp_key=850fd370f4
But by the time you tell us, it will be too late.
A cut off earnings range would be better,
but you want us to find out too late. IMHO
So you cares what you do ?
may 28
ETFs Ranked by StochClose
The image below shows the top 28 ETFs (ranked by StochClose). I chose 28 to include SPY because its StochClose value is above 60, which implies an uptrend. The top 20 ETFs are still dominated by bonds, tech, healthcare and gold. There were big improvements in the Consumer Discretionary SPDR (XLY), Home Construction ETF (ITB) and Retail SPDR (XRT) this past week as their StochClose values exceeded 60.
SPY and StochClose
The next chart shows SPY with StochClose moving above 60 for the first time since late February. Shading turns green with a cross above 60 and red with a cross below 40. This is a trend-following indicator that will never catch the exact top or bottom and whipsaws are possible. For now, the indicator is bullish for the most important broad market ETF (IMHO).

SP 500 is a different market.
There I use Art Hill market breath inidicators
I always trade in direction of the major trend
Based on the last 50 years I use EMA
Surely you understand that the price must stay above the 200 for the 20 EMA to move above the 200 EMA
Today the 200 is still key
20 EMA below 200 EMA says bearish. IMHO
Canopy Growth Corporation will release its financial results for the fourth quarter before financial markets open on May 29, 2020.
NYSE came back Today and moved WEED back below the 200 EMA.
Is WEED going to report positive earnings on Friday ?
WEED BREAKS 200 EMA TO THE UP SIDE

http://www.stockcharts.com/def/servlet/Favorites.CServlet?obj=1401935,19&cmd=show&disp=e
10 $BP = A breadth indicator derived from the percentage of stocks on P&F Buy signals.
http://www.stockcharts.com/def/servlet/Favorites.CServlet?obj=1401935,17&cmd=show&disp=e
QQQ MSFT AMZN GOOGL APPL
http://www.stockcharts.com/def/servlet/Favorites.CServlet?obj=1401935,2&cmd=show&disp=e
MAY 19 7/8 UP COULD BE THE TOP ?
MAY 13 DOWN 5/10