 News
News  Market Data
  Discover
Support: 888-992-3836
Copyright © 2023 InvestorsHub Inc.


solartech
![]()
Register for free to join our community of investors and share your ideas. You will also get access to streaming quotes, interactive charts, trades, portfolio, live options flow and more tools.
Register for free to join our community of investors and share your ideas. You will also get access to streaming quotes, interactive charts, trades, portfolio, live options flow and more tools.
2019 Fourth of July fireworks
Making America great again !
So you see, charts are not only historical records, they predict events before they happen. Only after the financial melt down in 2008/2009 news started to surface in the internet explaining why it happened: Financial institutes have been enticing home buyers to buy by offering second and third mortgages, even without any down payment, also selling mortgage derivatives without insurance to back them up. Many home owners should not be qualified for mortgage at all. In the economic down turn, the massive default in mortgage payment triggered such financial crisis.
Also after the crash in UK:NANO news emerged to explain why the crash occurred: Loss of contracts from its key customer.
The bullish QTMM chart predicts something big is coming, may be just the announcement of money received, but there may be something even more important. So tighten your seat belt for the ride.
In 2001 I applied my chart technicality knowledge learned from Commodities Future Trading to stocks and searched for potential mining stock amid hundreds of mining charts, while most of the charts were erratic and unpredictable there was one stood out like a shining star among dark matters of the Universe, it had a bullish Head&Shoulder pattern bottom similar to that of QMC and was trading at 5 cents. I did research on that junior mining explorer and discovered it had over 6 billion pounds of copper reserves plus gold and silver resources in the Golden Triangle of British Columbia, Canada, so I bought 200K shares at 5 cents and held on to it for long term. In 2011 the company was bought out by a bigger mining company at $2.50 a share. The sale offered me $1/2 million for my early retirement.
Charts don't lie, the 10-year Head&Shoulder pattern with the Neckline at 50 in Fannie Mae (mortgage backed securities), chart forecast severe market crash in 2008. I saw it coming, so I sold my new condo in 2007 just before the crash (I bought at $136K in 2000 and sold at $258K in 2007 for 89% gain) then moved out of downtown Toronto to the suburb.
http://bigcharts.marketwatch.com/advchart/frames/frames.asp?show=&insttype=Stock&symb=FNMA&time=20&startdate=1%2F4%2F1999&enddate=7%2F2%2F2011&freq=3&compidx=aaaaa%3A0&comptemptext=&comp=none&ma=0&maval=9&uf=0&lf=32&lf2=1&lf3=2&type=2&style=320&size=2&x=38&y=5&timeFrameToggle=false&compareToToggle=false&indicatorsToggle=false&chartStyleToggle=false&state=10
Also the Head&Shoulder pattern in UK:NANO forecast imminent crash, I warned the troll on May 23 but the stubborn troll replied "Irony is not dead !":
Note the monthly NANO chart has similar appearance as FNMA, both made a weak "Return Move" above the Neckline before the severe crash.

Intel Corporation (commonly known as Intel and stylized as intel) is an American multinational corporation and technology company headquartered in Santa Clara, California, in the Silicon Valley. It is the world's second largest and second highest valued semiconductor chip manufacturer based on revenue after being overtaken by Samsung Electronics,[3][4] and is the inventor of the x86 series of microprocessors, the processors found in most personal computers (PCs). Intel ranked No. 46 in the 2018 Fortune 500 list of the largest United States corporations by total revenue.[5]
Intel supplies processors for computer system manufacturers such as Apple, Lenovo, HP, and Dell. Intel also manufactures motherboard chipsets, network interface controllers and integrated circuits, flash memory, graphics chips, embedded processors and other devices related to communications and computing.
Intel Corporation was founded on July 18, 1968, by semiconductor pioneers Robert Noyce and Gordon Moore (of Moore's law), and widely associated with the executive leadership and vision of Andrew Grove. The company's name was conceived as portmanteau of the words integrated and electronics, with co-founder Noyce having been a key inventor of the integrated circuit (microchip). The fact that "intel" is the term for intelligence information also made the name appropriate.[6] Intel was an early developer of SRAM and DRAM memory chips, which represented the majority of its business until 1981. Although Intel created the world's first commercial microprocessor chip in 1971, it was not until the success of the personal computer (PC) that this became its primary business.
During the 1990s, Intel invested heavily in new microprocessor designs fostering the rapid growth of the computer industry. During this period Intel became the dominant supplier of microprocessors for PCs and was known for aggressive and anti-competitive tactics in defense of its market position, particularly against Advanced Micro Devices (AMD), as well as a struggle with Microsoft for control over the direction of the PC industry.
https://en.wikipedia.org/wiki/Intel
~~~~~~~~~~~~~~~~~~~~~~~~~~~~~~~~~~~~~~~~~~~~~~~~~~
Microsoft Corporation is an American multinational technology company with headquarters in Redmond, Washington. It develops, manufactures, licenses, supports and sells computer software, consumer electronics, personal computers, and related services. Its best known software products are the Microsoft Windows line of operating systems, the Microsoft Office suite, and the Internet Explorer and Edge Web browsers. Its flagship hardware products are the Xbox video game consoles and the Microsoft Surface lineup of touchscreen personal computers. As of 2016, it is the world's largest software maker by revenue,[3] and one of the world's most valuable companies.[4] The word "Microsoft" is a portmanteau of "microcomputer" and "software".[5] Microsoft is ranked No. 30 in the 2018 Fortune 500 rankings of the largest United States corporations by total revenue.[6]
Microsoft was founded by Bill Gates and Paul Allen on April 4, 1975, to develop and sell BASIC interpreters for the Altair 8800. It rose to dominate the personal computer operating system market with MS-DOS in the mid-1980s, followed by Microsoft Windows. The company's 1986 initial public offering (IPO), and subsequent rise in its share price, created three billionaires and an estimated 12,000 millionaires among Microsoft employees. Since the 1990s, it has increasingly diversified from the operating system market and has made a number of corporate acquisitions, their largest being the acquisition of LinkedIn for $26.2 billion in December 2016,[7] followed by their acquisition of Skype Technologies for $8.5 billion in May 2011.[8]
As of 2015, Microsoft is market-dominant in the IBM PC compatible operating system market and the office software suite market, although it has lost the majority of the overall operating system market to Android.[9] The company also produces a wide range of other consumer and enterprise software for desktops, laptops, tabs, gadgets, servers, etc. including Internet search (with Bing), the digital services market (through MSN), mixed reality (HoloLens), cloud computing (Azure) and software development (Visual Studio).
Steve Ballmer replaced Gates as CEO in 2000, and later envisioned a "devices and services" strategy.[10] This began with the acquisition of Danger Inc. in 2008,[11] entering the personal computer production market for the first time in June 2012 with the launch of the Microsoft Surface line of tablet computers; and later forming Microsoft Mobile through the acquisition of Nokia's devices and services division. Since Satya Nadella took over as CEO in 2014, the company has scaled back on hardware and has instead focused on cloud computing, a move that helped the company's shares reach its highest value since December 1999.[12][13]
In 2018, Microsoft surpassed Apple Inc. as the most valuable publicly traded company in the world after being dethroned by the tech giant in 2010[14] and in April 2019, Microsoft became the third U.S. public company to be valued at over $1 trillion after Apple and Amazon respectively, reached the trillion-dollar market cap in 2018.[15]
https://en.wikipedia.org/wiki/Microsoft
~~~~~~~~~~~~~~~~~~~~~~~~~~~~~~~~~~~~~~~~~~~~~~~~~
Through the operation of QMC, we are witnessing the progress of Intel Corp in its infancy, one day in the future, Quantum Materials Corp will be a big global quantum dot company with a market capitalization of $200 billion and will be narrated in Wikipedia.
http://www.qmcdots.com/

Charts don't lie, the QTMM chart has a look of a "sleeping giant", I have seen this chart pattern hundreds of time in commodities future trading. The astronomical growth potential of quantum dot and the company's steady progress in its product development, licensing, and market penetration corroborate such scenario.

The reason that QTMM share price is at 3 cents is because of "no sustainable revenue yet". QMC is officially in the "Revenue Phase" and when a PR announces the company's FIRST COMMERCIAL SALES REVENUE, the company's image and future potential in the eyes of the investment community will change, so will share price as investors re-evaluate the company's future growth and revenue potential.
Charts don't lie, they forecast the future, the bullish chart formation has confirmed the "fail break" phenomenon and the rocket will be launched upon news announcing "totally $1.5 million has been received for the second half of the licensing fee and for the full payment for the 2 systems of reactors. The 2 reactors have been shipped out to our licensee in India".
The legend of Solyndra
https://en.wikipedia.org/wiki/Solyndra
Production cost for quantum dot solar panel is only a fraction that of silicon version, there will be a replay for all silicon solar panel manufacturers in China and around the world whose production plant takes as much as $1 billion to build and whose production of silicon PV cells are time and labor intensive while Amtronics will simply print the solar films at hundreds of feet per minute, much like printing royalties for QMC's shareholders.
Quantum dot is the ultimate future in Display Sector, in Solid State Quantum Dot LED Lighting sector and in Solar Energy Sector.
Disney Fourth of July fireworks
Six Flags Fiesta Theme Park, Texas
https://www.google.ca/maps/place/Six+Flags+Fiesta+Texas/@29.514306,-97.9404794,8.22z/data=!4m5!3m4!1s0x865c65169b579e37:0x235fc0938c92ce9d!8m2!3d29.5991156!4d-98.6105607
https://www.google.ca/maps/place/Six+Flags+Fiesta+Texas/@29.5901606,-98.1725197,248666m/data=!3m1!1e3!4m5!3m4!1s0x865c65169b579e37:0x235fc0938c92ce9d!8m2!3d29.5991156!4d-98.6105607
2018 Fourth of July firework
Never mind the ruckus on QMC, NANO and NANOSY.
From global trade war to globe nuclear war .... China, Russia, North Korea, Iran ..... US and its allies .....
Count down to ICBM lift off, T MINUS 20 years ...... 1939 ......2039 ......
Higher it crawls, higher the risk, another bad news of contract loss, another plunge and another 76% loss from current price.
$1 million is a drop in the bucket, it will be non-effective to save the sinking ship, it may delay its sinking into sub-pennies.
Those living in glass house with a lot of sunlight are healthier, more intelligent and are richer than those living a sinking ship making quantum dots in batches and selling their products at below cost and followed by blind faith shareholders and customers.
Why richer? They have income from the sales of horticultural products that grow around the clock using QMC's Solid State Quantum Dot Led's that cover 95% light wavelength gamut, that is natural artificial sunlight at night and natural sunlight in day time.
Good bye, NANO, RIP. Good bye to life savings of its shareholders.
https://investorshub.advfn.com/boards/read_msg.aspx?message_id=149550413
Dead cat bounce, sub-penny prices coming in a few months because more contracts loss anticipated by investors for no customers want to associate with a sinking ship.
http://bigcharts.marketwatch.com/advchart/frames/frames.asp?show=&insttype=Stock&symb=UK%3ANANO&time=18&startdate=1%2F4%2F1999&enddate=7%2F2%2F2011&freq=8&compidx=aaaaa%3A0&comptemptext=&comp=none&ma=0&maval=9&uf=0&lf=32&lf2=1&lf3=2&type=2&style=320&size=2&x=52&y=10&timeFrameToggle=false&compareToToggle=false&indicatorsToggle=false&chartStyleToggle=false&state=10
Come on, Pump this dead cat up! There are suckers born everyday.
Introduction to Quantum Materials Corp
New shareholders, welcome to the QMC family, welcome to QTMM, your ticket to an early retirement. Here is some information on QMC for your reference, but do your own diligent research and make your own investment decision.
1) Quantum Materials Corp - Technological Progress in QD Display, QD Solar cell and Solid State QD LED Lighting.
https://investorshub.advfn.com/boards/read_msg.aspx?message_id=149222906
2) Quantum Materials Corp - Emerging quantum dot application products
https://investorshub.advfn.com/boards/read_msg.aspx?message_id=149222913
3) Quantum Materials Corp - Vision for the future
https://investorshub.advfn.com/boards/read_msg.aspx?message_id=149222927
4) Quantum Materials Corp - Potential near term revenues
https://investorshub.advfn.com/boards/read_msg.aspx?message_id=149222943
5) Quantum Materials Corp - Future price chart scenario
https://investorshub.advfn.com/boards/read_msg.aspx?message_id=149222952
6) Introduction to Quantum Materials Corp
https://investorshub.advfn.com/boards/read_msg.aspx?message_id=149222967
Hi rodman and BryanC:
You can learn some technical analysis here:
This linkage does not work, I don't know why, so copy the URL to the address bar in your Explorer or Google Chrome browser, it is a "chart school"
https://stockcharts.com/search/?blogAuthor=&q=head%20and%20shoulder§ion=cs
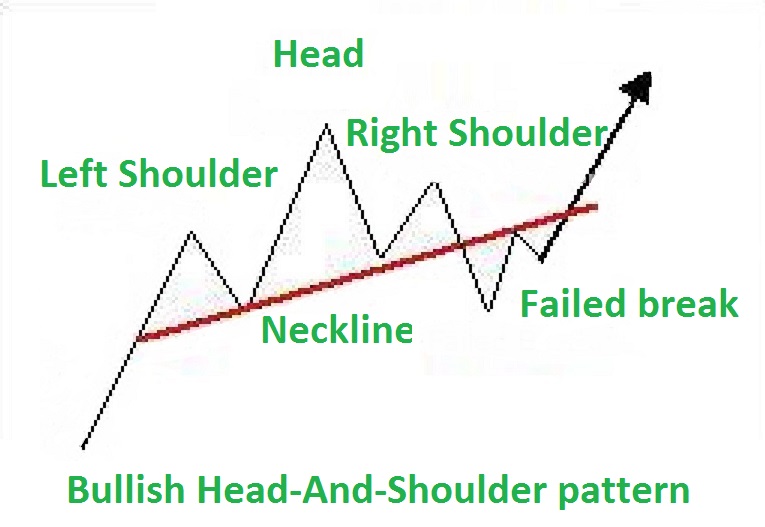
Head and Shoulder pattern
https://www.google.com/search?source=hp&ei=pzwRXd7KJuGhggf0lYWoCw&q=Head+and+shoulder+pattern&oq=Head+and+shoulder+pattern&gs_l=psy-ab.3..0l10.2605.7932..8223...1.0..0.97.2195.26......0....1..gws-wiz.....1..35i39j0i131j0i3j0i10.QctiuoSAa-U
There are basically 8 types of chart patterns including the H&S pattern.
head and shoulder
up trend //
down trend \\
____
____ side way
combining ( ___ and / ) or ( \ and ___ ) or ( \ and / ) or ( / and \ ) you will get:
ascending triagle
descending triangle
symmetric triangle
expanding triangle
Head and shoulder pattern is frequent occurrence in Nature, it is the most reliable and predictable pattern among the 8 patterns.
Common terminology in chart patterns are: head&shoulder, inverted head&shoulder, neckline, breakout, return move, fail break, breakout gap, trivial gap, runaway gap, up trend, exhaust gap, island top, down trend, ascending triangle, descending triangle, expending triangle, side way, inside day, outside day, convergence, double bottom, triple bottom, double peak, triple peak, saucer or round bottom, up reversal, down reversal .....
Like I said, the bullish H&S pattern in QTMM predicts bullish news which when released will send share price soaring. So it is a waiting game. The chart does not tell what event will cause that sharp price surge nor did the bearish H&S pattern in the NANO weekly chart tell what event would cause the imminent sharp price crash, it only reflects the negative/bearish sentiment of the shareholders.
Stock players are not technical traders, they are news dependent and that makes technical trading in stocks difficult. If this bullish QTMM chart is a commodities chart, upon confirmation of "fail break", price would surge sky high without news because CFT traders are all technical traders and they trade by the rules. Price is breaking down from the Neckline right now, but when good news is released in the PR, it will surge sharply, thus the "fail break" phenomenon and the rocket will be launched. It all depends on when Stephen will release the PR confirming receiving the second $500K fee as well as payment for the reactors.
What caused share price surging from 1.76 cents to 5.5 cents? How can there be a rocket launch when the remaining $500K has not been received, nor the payment for the reactors?
Again, it is useless to talk snow to Summer worms because Summer worms never experienced Winter. Only those having an open mind to new idea and humble to learn will gain new knowledge and new found knowledge will enhance their success in investment.
I need to concentrate on my own trading when the rocket is launched, so I will not post anymore. In active high volume trading days, the chart will become very technical and predictable, that is how I nearly sold all my share right at the peak of 24.9 cents in February, 2017, the chart pattern was spectacular and price movement was absolutely predictable. No technical traders deny charts are important tools, but for those who don't understand charts, charts are only Greek to them. I consistently made profit in CFT based 100% on chart technicality proved my point and my May 23 prediction in price crash in NANO stock further corroborated charts are not only historical records, they can predict the future.
The chart anticipates news that announces receiving the second $500K fee and full payment for the reactors and will surge meteorically on that news, disbelievers should sell everything and move on .......
Charts don't lie, they predicted the crash in NANO stock.
The chart forecasts bullish news, has the news come out reporting receiving the second $500K yet? No, investors are news dependent, how can there be rocket launch while the $500K fee and the payment for the reactors have not even been received yet. The chart is testing the "break down" right now, when bullish news is out, "fail break" will be confirmed and the rocket will be launched.
If this chart is in the CFT, it would has surged sky high without news because in CFT traders are technical traders. In stocks, investors are news dependent.
Did the chart lie about the prediction of price crash in Nano weekly chart? I already warned about it on May 23.
Laugh at the charts as you will, I have been buying at the rock bottom and selling right at the peaks because of chart technicality.
Its just like the legend of Noah Ark, the villagers were mocking Noah while he built the Ark on dry land and warned of imminent flood. The villagers were all drown.
No, QTMM will be removed from the "promotion" list this Friday June 28 (15 days since June 13). Also Stephen announced shipment will be made on or before Friday as Saturday and Sunday are not business day.
So the rocket will be launch this week. But if no news this week, expect share price to plunge to 1.75 cents because investors are news dependent and will be disappointed.
In CFT I got stopped out 5 out 10 trades, but I consistently made profit because I limit my loss with buy stop/sell stop orders with my order entry, and in trades that the stop orders did not get fill and price surged in my direction (long or short), I let profit run, that is why even I was wrong 50% of the time I still made profit. It is fortunate that I can hold onto the stock "forever" without getting margin call, there is much less stress in playing stocks than in CFT.
The weekly chart will form a super-strong Up Reversal this week (taking out last week's low and close well above last week's close on Friday).
Final chance for cheap shares.
This chart does not show this week's price, it is updated only after market close, expect share price to close over 5, 6 or 10 cents on Friday when news is out.
All indicator systems go, T MINUS ........
http://bigcharts.marketwatch.com/kaavio.Webhost/charts/big.chart?nosettings=1&symb=QTMM&uf=0&type=2&size=2&sid=4700466&style=320&freq=2&entitlementtoken=0c33378313484ba9b46b8e24ded87dd6&time=8&rand=1338907045&compidx=aaaaa%3a0&ma=0&maval=9&lf=32&lf2=2&lf3=1&height=553&width=579&mocktick=1
News out before Friday announces receiving $1.5 million and the shipment of the 2 reactors, charts never lie. The NANO weekly chart forecasted sharp price crash.
One man's trash is another man's treasure, load up.

..and that made me think of a famous Jesus quote.
http://bigcharts.marketwatch.com/advchart/frames/frames.asp?show=&insttype=Stock&symb=UK%3ANANO&time=7&startdate=1%2F4%2F1999&enddate=7%2F2%2F2011&freq=1&compidx=aaaaa%3A0&comptemptext=&comp=none&ma=0&maval=9&uf=0&lf=32&lf2=1&lf3=2&type=2&style=320&size=2&timeFrameToggle=false&compareToToggle=false&indicatorsToggle=false&chartStyleToggle=false&state=10&x=29&y=10
May 23: "Constantly making bearish Head-And-Shoulder pattern is a bad sign, in the final Head-And-Shoulder pattern, a sharp break below the Neckline towards sub-penny will the last nail in the coffin"
https://investorshub.advfn.com/boards/read_msg.aspx?message_id=148997447
Yes, the irony is dead.
Nanoco captain left the sinking ship, leaving all Nano shareholders behind to go down with the ship.

charts are not only historical records, they predict future events before they happen.
Retirees living on fixed small income beware, do you know that average annual inflation rate over the past 40 years is 10%? That is about 4% annual inflation compounded over 40 years. At annual inflation of 4% compounding over the next 15 years your cost of living will double by then, if you will still be alive and well, will you survive financially? May be QTMM will be more than able to maintain your purchasing power if QMC will emulate Universal Display Corp as quantum dots are more powerful and more efficient than OLED in Display, in solid state QD LED lighting and in solar energy applications. QTMM will still survive 15 years from now, but will its share price still be at 3 cents?
Buy and hold for the long term, that is the only way to secure your financial future.
Rare opportunity comes only once in one's life time. The door of that opportunity is closing fast. I post for seek of humanity, the company's future is on auto pilot, not depending on what is posted in public forum.
Introduction to Quantum Materials Corp
New shareholders, welcome to the QMC family, welcome to QTMM, your ticket to an early retirement. Here is some information on QMC for your reference, but do your own diligent research and make your own investment decision, don't rely on others, for only you and yourself is the master of your own fate. No stoical and diligent work, no wisdom and clairvoyance into the future, no gain. Success in investment is not based on luck, easy come by luck, easy go by luck.
1) Quantum Materials Corp - Technological Progress in QD Display, QD Solar cell and Solid State QD LED Lighting.
https://investorshub.advfn.com/boards/read_msg.aspx?message_id=149222906
2) Quantum Materials Corp - Emerging quantum dot application products
https://investorshub.advfn.com/boards/read_msg.aspx?message_id=149222913
3) Quantum Materials Corp - Vision for the future
https://investorshub.advfn.com/boards/read_msg.aspx?message_id=149222927
4) Quantum Materials Corp - Potential near term revenues
https://investorshub.advfn.com/boards/read_msg.aspx?message_id=149222943
5) Quantum Materials Corp - Future price chart scenario
https://investorshub.advfn.com/boards/read_msg.aspx?message_id=149222952
6) Introduction to Quantum Materials Corp
https://investorshub.advfn.com/boards/read_msg.aspx?message_id=149222967
Introduction to Quantum Materials Corp
New shareholders, welcome to the QMC family, welcome to QTMM, your ticket to an early retirement. Here is some information on QMC for your reference, but do your own diligent research and make your own investment decision, don't rely on others, for only you and yourself is the master of your own fate. No stoical and diligent work, no wisdom and clairvoyance into the future, no gain. Success in investment is not based by luck, easy come by luck, easy go by luck.
1) Quantum Materials Corp - Technological Progress in QD Display, QD Solar cell and Solid State QD LED Lighting.
https://investorshub.advfn.com/boards/read_msg.aspx?message_id=149222906
2) Quantum Materials Corp - Emerging quantum dot application products
https://investorshub.advfn.com/boards/read_msg.aspx?message_id=149222913
3) Quantum Materials Corp - Vision for the future
https://investorshub.advfn.com/boards/read_msg.aspx?message_id=149222927
4) Quantum Materials Corp - Potential near term revenues
https://investorshub.advfn.com/boards/read_msg.aspx?message_id=149222943
5) Quantum Materials Corp - Future price chart scenario
https://investorshub.advfn.com/boards/read_msg.aspx?message_id=149222952
6) Introduction to Quantum Materials Corp
https://investorshub.advfn.com/boards/read_msg.aspx?message_id=149222967
Market Makers / big investors have deep pockets, they have profound influence on share price, the fact that they have not acted is because they are still confused if the second $500K licensing fee and the payment for the reactors have been received as the "Letter Of Credit" myth is so intriguing and ambiguous, they are waiting for a PR explicitly announcing money received and if that PR will be out next week, we all can assure that there will be rocket launching because history proved it.
Also the "fail break" phenomenon as well as technical indicators suggest that time is ripe for a lift off.
http://bigcharts.marketwatch.com/kaavio.Webhost/charts/big.chart?nosettings=1&symb=QTMM&uf=0&type=2&size=2&sid=4700466&style=320&freq=2&entitlementtoken=0c33378313484ba9b46b8e24ded87dd6&time=8&rand=1338907045&compidx=aaaaa%3a0&ma=0&maval=9&lf=32&lf2=2&lf3=1&height=553&width=579&mocktick=1
My prediction was share price would break out from the weekly convergence sharply last week and there would be rocket launching when the bullish PR is out, may be on June 19. Since no PR was out last week explicitly announcing money received, share price broke down sharply to 2.7 cent to test the "fail break" on the down side, but price rallied strongly back above 3 cents at the closing from under 3 cents on Friday confirming the "fail break". Share price will surge upward strongly upon news next week announcing receiving the second half of the licensing fee also the full payment for the reactors. Again, it depends on if there will be any PR released next week, as stock players are not technical traders, they buy and sell randomly on their own discretion and they are news dependent, if this is a commodities future chart, price will surge sky high next week even without news because all CFT traders are technical traders.
If you think investors will sell their shares at lower prices, then sell everything and buy back more shares at lower prices. You will regret big time.
What is the odd of NANO rising 1,000% from 8.5 GPX TO 85 GPX?
What is the odd of QTMM rising 1,000% from 3.2 cents to 32 cents?
Which stock will investors put their investment funds?
A song to soothe the agony of the NANO shareholders
The difference between QMC and NANO is one is a rising star in an up elevator, the other is an incompetent aging star in a down elevator.
Charts are not only historical record, they predict the future, they forecast events before they happen as instantaneous tracking of the company's performance and progress and the evaluation by the collective subconscious mind of the investors determine their sentiment and investment decision and their trading is reflected in price charts. One picture is worth a thousand words.
This chart anticipates proven revenue and success in the licensing deal

This chart reflects incompetence and anticipates lost of contracts. The news of contract loss did not happen suddenly, it has been in incubation and has been anticipated by investors, thus the formation of the bearish chart pattern. 100 million shares dumped in one week reflects extreme negative sentiment in the company's chance to survive. If the CEO of the company has faith in the company's future, he would has been accumulating shares, not dumping his shares. Monkey see, monkey do, so did investors.

Expect press release next week:
http://www.globenewswire.com/Search?organization=Quantum%20Materials%20Corp
The global venture capital industry has trebled in size to $160bn (£124bn) over the past decade, according to new research.
The amount of capital being invested in the sector globally swelled from $53bn in 2008 to $160bn in 2017. The growth has been led by Asia, where the share of global VC capital increased from 4pc in 2008, to 27pc in 2017.
The total amount of capital invested in the UK was at $2.2bn (£1.7bn) in 2008 compared to $7.9bn (£6.1bn) last year, equating to an increase of 255 per cent. Comparatively, investments in France have only doubled over the last decade, taking the total amount invested to $2bn (£1.55bn) in 2017.
Global Venture Capital hits $160 billion
https://www.telegraph.co.uk/technology/2018/11/20/global-venture-capital-industry-has-trebled-size-160-billion/
Nanoco's operation could break even in 2 years but lost of contracts in key partner companies has dampened that hope
https://finance.yahoo.com/news/nanoco-group-plc-lon-nano-111541017.html
A sharp fall in share price below key support in the long term monthly chart to single digit may signal game over tor the company, if it will survive, it will take years for share price to rise back above GPX 40, the Neckline of the 9-year Head&Shoulder formation.
http://bigcharts.marketwatch.com/advchart/frames/frames.asp?show=&insttype=Stock&symb=UK%3ANANO&x=32&y=13&time=13&startdate=1%2F4%2F1999&enddate=7%2F2%2F2011&freq=3&compidx=aaaaa%3A0&comptemptext=&comp=none&ma=0&maval=9&uf=0&lf=32&lf2=1&lf3=2&type=2&style=320&size=2&timeFrameToggle=false&compareToToggle=false&indicatorsToggle=false&chartStyleToggle=false&state=10

