 News
News  Market Data
  Discover
Support: 888-992-3836
Copyright © 2023 InvestorsHub Inc.


SFSecurity
![]()
Register for free to join our community of investors and share your ideas. You will also get access to streaming quotes, interactive charts, trades, portfolio, live options flow and more tools.
Register for free to join our community of investors and share your ideas. You will also get access to streaming quotes, interactive charts, trades, portfolio, live options flow and more tools.
Hi Gang, As Confucius is alleged to have said, "Success depends upon previous preparation, and without such preparation there is sure to be failure." That's why I have a significant stash of cash.
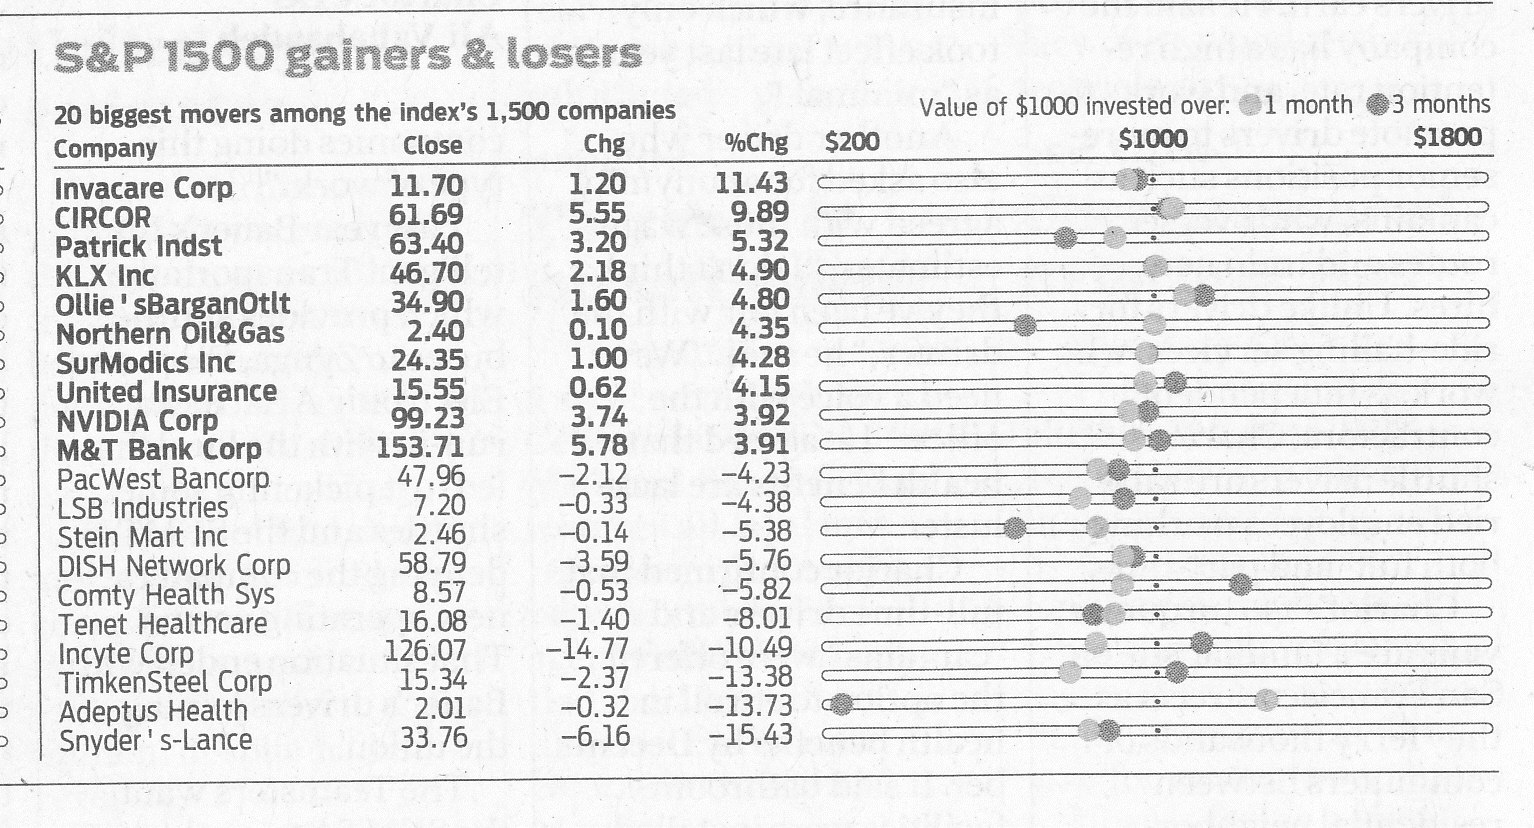
Lately this chart that is in my daily paper has shown almost no position with any significant gain, even the ones that are up. The lighter dots are one month and the darker ones are over three months.
Best,
Allen
Hi Tom, Too true, altogether too true. What with all the backtesting I've done just about the only time you make money is buying from the scared. Mostly it is less than 0.1% difference, and mostly against AIM, in a bull market.
One thing I've noticed is that ETFs are harder because inside them the loses offset the gains. However the options on them have higher volatility. I haven't been able to get the options pricing data to do significant back testing. Does anyone know of a way to get the bid/ask prices as well as last sell price like one does for the ETFs themselves?
It looks like selling covered calls well out of the money is a way to make a few cents while waiting for significant moves of the underlying ETF.
Best,
Allen
Hi Toofuzzy, Well he has been quoted as saying to buy low, but the rest of it would likely mitigate against him using AIM as he says to hold on for the long haul. At least he got half of it right. 
Best,
Allen
Hi Gang, Ya think Warren Buffet knows something we don't? It seems he has over $80 BILLION dollars in cash reserves, more than twice he had in 2008.
Another tidbit from TheoTrade. He says that an old floor trader told him "You make most of your money in a bear market, you just don't realize it at the time." The old floor trader was quoting someone, undisclosed, who borrowed $100,000 and turned it into $800 million.
Best,
Allen
Hi Gang, Sometimes my curiosity gets me and I was looking at the Gummy AIM.xls wondering how to add commission costs to the way it is done. Took a bit of fiddling but eventually got it. But along the way came across a an Excel formula I did not understand.
=Units*Price+Q$8:Q$65536 - It is the Q$8:Q$65536 part I don't get. Can anyone explain?
The I got to fiddling around and wondered how it was getting it's data from Yahoo and if one could get weekly and daily as well as monthly.
Monthly: chart.yahoo.com/table.csv?s=GM&a=3&b=13&c=2015&d=3&e=14&f=2017&g=m&q=q&y=0&z=GM&x=.csv
Weekly: chart.yahoo.com/table.csv?s=GM&a=3&b=13&c=2015&d=3&e=14&f=2017&g=w&q=q&y=0&z=GM&x=.csv
Daily: chart.yahoo.com/table.csv?s=GM&a=3&b=13&c=2015&d=3&e=14&f=2017&g=d&q=q&y=0&z=GM&x=.csv
The bold and italic black is the stock symbol and the red is where the change is for monthly, weekly, and daily. The other parts, a=3&b=13&c=2015&d=3&e=14&f=2017, are for the dates with the first part for the starting month, day, and year while the second part is for the end month, day, and year point for the data.
Hope this proves useful.
Best,
Allen
Hi Tom, Yes, I think that a cumulative risk graph for the v-Wave would be an excellent tool to have.
On another front could you write out the formula for this? I must be reading the wording wrong as I don't get what your picture shows when I try to do it in Excel. It may be I screwed up the formula but it might be the data I'm using, only the last couple of months for the DIA is not quite the same as they were using.
Thanks,
Allen
Hi Tom, Great stuff. In looking at your current NYSE Cumulative Daily Breadth chart I have the sense, just guessing mind you, that it might look similar to early 2007. The way I've looked at that market is that it hit its peak in the week of October 8th 2007 for both the DOW and the S&P 500, From there they slip slided down, sometimes up for a bit but overall down until somewhere late September, early October 2008 when it started falling off the cliff. Some people say it hit bottom in early February or early March of 2009. I use the week of March 2, 2009 as that is when both the DOW and the S&P 500 hit bottom.
As to the consumer index falling off the cliff when it did it is not uncommon for things to go in waves, first the market, then, after a bit the consumer spending once they feel the panic around them.
In looking at predictive cycles I've noticed that roofing seems to slow down before most other things. I haven't looked recently so I wonder how roofing companies are doing.
Well, we'll see soon enough,
Best,
Allen
Hi Tom, You say:
I think the markets have just reached a steeper part of the Wall of Worry. They need to rest before the next Ascent.
Earl Thompson, formerly of UCLA, takes a different approach. He reckons that the market for tulips was an efficient response to changing financial regulation—in particular, the anticipated government conversion of futures contracts into options contracts. This ruse was dreamt up by government officials, who themselves were keen to make a quick buck from the tulip trade.
In plain English, investors who had bought the right to buy tulips in the future were no longer obliged to buy them. If the market price was not high enough for investors’ liking, they could pay a small fine and cancel the contract. The balance between risk and reward in the tulip market was skewed massively in investors’ favour. The inevitable result was a huge increase in tulip options prices (see below right). (The price of options collapsed when the government saw sense and cancelled the contracts.) Spot prices (the price that traders paid for immediate delivery of tulips) and futures prices (the prices that traders would be compelled to pay for future delivery of tulips) were not volatile. And any movement of the spot/futures price was determined by simple supply and demand—the fall-out from the Thirty Years’ War, one of the bloodiest in European history, was one important factor.
Hi Tom, I guess we couldn't have lunch because the West Coast was not on your list. Well, perhaps next trip, or much better a meeting for all of us?
Also, why it has been quiet might be that the fear index by Credit Suisse’s in-house fear barometer is way up: https://finance.yahoo.com/news/one-measure-investors-almost-never-nervous-stocks-154743756.html
Best,
Allen
Hi Firebird400, I just ran a daily backtest on IGXT for the last year and got a 27.94% gain with AIM-Hi. This was at $1000 minimum trade and 5% minimum stock trade, but that was getting in at $0.58. Nothing happened for 3 months and then there was a buy when it got down to $0.49. This was with $20,000 for the position total, 20% cash and a 10% buy safe and a 0% sell safe.
At what point did you get into IGXT?
Interestingly there was no trading at all when I dropped down to $2,000 total for the position size and a position return of 15.17% for the year. At $3,000 there was one sell, and a 20.66% return as opposed to the B&H of 18.97%. At $5,000 total position size the gain is 24.83% with minimum trade shares from 1 up to 1223 (17.7349% of a total shares of 6896) but if I set the minimum trade size to 1224 (17.74941%) the return dropped to 16.11%.
So then I said, let's try $50,000. With 1 share minimum trade the return was 26.58%. It starts to improve when the minimum shares gets to 1230 (1.7835%) and keeps getting better until 3329 minimum shares trade (4.8271% of 68965 shares) for a return of 28.79% and drops to 27.59% at 3330 minimum shares trade, or 4.8285%. Tricky!
BTW, all the testing was done with 10% buy safe and a 0% sell safe.
Just shows to go ya that selecting the right dollar amount for a given position as well as the best minimum trade size is quite important for the best return.
Based on this one test it seems like the more money in a position the more critical the minimum trade size is. It also seems like there is a minimum position size for a given position to get good returns.
I'll do a bit more checking and get back to everyone on this.
Best,
Allen
Hi Orcroft, I was talking generically, not trends. I agree with you that MACD, and other measures, can predict a likely, probabilistic or statistical trend. We know that the probability of a coin toss is 50% heads and 50% tails in the long run but that doesn't mean that there can't be 10 or even 100 heads in a row. Would an analysis like MACD tell us when the streak will start or end?
From what I see in recent events is that MACD trends are not always showing in advance what most likely will happen when events occur that are either not predicted or are like lighting strikes. It seemed to me that the market moving the way it did after the election in November was not predicted or would have shown up with MACD prior to the election. Then there are events like Black Monday, October 19, 1987, when stock markets around the world crashed, shedding a huge value in a very short time.
Unless I misunderstand MACD, from what I've looked at its distant future vision is somewhat limited. We can look at the history of bull markets and bear markets and see that they happen from time to time but MACD can't tell us when the exact inflection point will be, but we know, historically, they will happen.
MACD, after all is a moving "average" of prior data and as such short, sharp events, like the latest Congressional failure around health care, don't typically show up in the charts for a few days and are not predicted in advance. However, there is a degree of mushiness and time spread to most events such that there is time for MACD, and such like, to begin to show a possible direction.
Best,
Allen
Hi Toofuzzy, Only sometimes? Ha! I suspect that self interest is the reason that they have fought so hard to beat back the fiduciary rule.
Anyway, although PHDG might not seem like a great AIM position, it has been a reasonable place to just earn dividends since it started in 2012. $1674.83, using AIM-Hi, is certainly better than putting it a bank or under your mattress. B&H with 797 shares, alas, does better with a dividend of $2331.06 and stock value of $19964.85 for a total of $22295.91 or 2.61%/year versus AIM of 2.13%/year.
It is these figures, and SHY's that make it clear to me that AIM can be improved on during a bull or low volatility markets. Exactly how, I don't know but I'll keep poking around looking at possibilities.
For example, with PHDG one could do a 100% stock/0% cash AIM-Hi and never run out of cash during the downdraft but still not earn as much as B&H because of cash sitting on the sidelines as a result of the cash on hand. But if one set minimum stock sale to 15% then one gets 5.38%/year. So playing with various possibilities is worth doing.
But, of course, one can not predict the direction the market is going even a week into the future. Too often what we see is the rear view mirror image and not the pot holes, or massive road destroying mudslides ahead of us. Hey, we know it's storming but when is the mountain going come down on us, who knows, I sure don't, though knowing the history of stormy weather I know it is possible.
Best,
Allen
Hi Toofuzzy, Actually the problem with my mother's account was the broker guided her to positions that high dividends but often that was a return of capital, or some such crazy accounting thing I never completely understood. Some of the positions were not actually "stocks" that you could find on the exchanges, some as REITs and others as limited partnerships, things like what was GNL before it was a listed stock. It was bought at $10/share but with the various crazy accounting it went on the market at around $8.95/share.
Another was a bond for an Indian Casino that is now in bankruptcy. All crazy stuff to sort out that I still have not completely solved. One more to go, also another bankruptcy issue.
Ah well, the joys of high finance.
Best,
Allen
Hi Lostcowboy, I don't do Kindle as it tends to light my eyeballs on fire, but I do read paper books, a lot in fact. When I moved a few years ago I gave away over 50 boxes of books, and that was after I sold two collections, one a cookbook collection and the other some rare French books by Gaston Leroux. I decided I needed the space for new books.
Mostly, if I can't get a book from the library, or I want my own copy, I go to the world's largest independent new and used bookstore, Powell's Books - www.powells.com or I go to Alibris Books - www.alibris-com. The neat thing about Alibris is that a lot of the sellers there are libraries that are weeding out their copies that haven't been read in years. Often the books only cost a buck or so so the shipping at $3.95 is more than the book, but it helps keep the Post Office alive even though Congress has been trying to kill it off over the years.
So, if possible, give me the title and author in the future.
I do greatly appreciate the tips, both for web resources and books to understand them.
Best,
Allen
Hi Gang, Here is one of the Gummy Stuff that helps with understanding the posts of Clive and others about a combo of something like gold and SPY, or similar, then re-balancing from time to time.
Volatility Pumping
Motivated by e-mail from Ralph J.
So I get this e-mail asking about volatility pumping and ...
>And, as usual, you've never heard of it before, right?
Uh ... yeah. Anyway, it goes like this:
Scenario #1: A stock has an annual return of either 100% or -50%, with equal probability ... that is, a Gain Factor of 2 or 0.5.
The succession of annual returns are then R1%, R2%, R3% etc. where the Rs are either 1.0 or -0.5 ... meaning +100% or -50% return.
After N years, you'd expect N/2 returns of 100% and N/2 returns of -50%: that is, Gain Factors of 2 and 0.5.
You'd then expect that $1 invested in this stock would end up (after N years) with the value: 2N/2 (0.5)N/2 = $1.
>Isn't that obvious? I mean you've got equal probability of doubling or halving and ...
Wait. I haven't finished.
Now consider this:
Scenario #2: You start with $1 invested in that Stock (described above) and $1 in Cash for an initial portoflio of $2.
At the end of each year you rebalance so that you have equal dollar amounts in the Stock and in Cash.
If the Stock doubles in value, you sell some Stock to put into Cash to maintain the 50:50 Stock/Cash Ratio.
If the Stock halves in value, you buy more Stock with money from your Cash account to maintain the 50:50 Stock/Cash Ratio.
At the end of each year, after rebalancing, you have equal dollars in each of your Stock and Cash accounts.
Each year you start with equal amounts, say $A (after rebalancing), in each account.
Before rebalancing, if the Stock doubles by the end of the year, you'll have A + 2A = 3A in total for a Gain Factor of 3A / 2A = 1.5.
Before rebalancing, if the Stock halves, you'll have A + 0.5A = 1.5A in total for a Gain Factor of 1.5A / 2A = 0.75.
After rebalancing, you'll again have equal amounts in each account of, say, $B + $B.
After N years you'd expect N/2 Gain Factors of 1.5 and N/2 Gain Factors of 0.75.
You'd then expect that your initial $2 invested in this Stock/Cash portfolio would end up (after N years) with the value: 2(1.5)N/2 (0.75)N/2 = 2(1.125)N/2.
That is, your Compound Annual Growth Factor would be: 1.1251/2 ... taking the Nth root of (1.125)N/2
That's a Compound Annual Growth Rate of: CAGR = 1.1251/2 - 1 = 0.06 or 6%.
>You expect to make money by rebalancing as opposed to the first buy-and-hold scenario #1, eh?
Yes ... make money by having two assets (Cash & Stock) each of which have an expected return of 0% ... just by rebalancing.
>Is that what you do?
No. I can't find a stock that has equal probabilities of doubling or halving.
If you change the two possible returns from +100% and -50% to something else (more reasonable) and the probability of getting the first isn't 50% but something else, then ...
>Then you lose money, right?
Sometimes.
Here's a spreadsheet to play with. You can change the +100% and -50% and the probability of getting the former from 50% to something else.
Click the picture to download the spreadsheet.
Each time you press F9 you get a different set of returns.
You can also click a button to have the spreadsheet press F9 for you ... 100 times.
For example, if you get a 10% return 65% of the time, but a -20% return 35% of the time, then that's a horse of a different hue.
Further, if you include trading fees for that rebalancing ritual ...
Hi Lostcowboy, and Gang; To find the single spreadsheets on the http://www.wiley.com/WileyCDA/WileyTitle/productCd-0470049774.html site, click on the "More" link.
Thanks a whole bunch, Lostcowboy, for the tip about Gummy Stuff. The http://gummy-stuff.org/index.shtml site does not always connect, but, fear not, as it is all archived at http://www.financialwisdomforum.org/gummy-stuff-tutorials/ The tutorials are well worth reading.
Here is an example: http://www.financialwisdomforum.org/gummy-stuff/buy-sell.htm The lines that start with a ">" are the snarky "comments" of his "students." Great fun to read.
a Buy & Sell Strategy
I've always felt that people over-react to good or bad news ... especially stock traders.
Earnings come in a penny below estimates, everybody yells "the sky is falling!" and the stock plummets ... only to quickly recover.
>Yeah, so?
So I figured I could take advantage of that as follows:
I look for a high-volatility stock. One that often changes by 3 or 4% in a day.
If the closing price is significantly lower than the open, I buy at the close ... figuring that it's an over-reaction and the stock will recover quickly.
If the close is significantly higher than the open, I sell at the close.
>You always buy or sell at the close?
Yes. I have my finger on the Buy / Sell button when the market closes.
>And it works? I mean, have you made a bundle with that strategy?
Last year, 2007, I was heavily into CBQ and was quite succesful, making 25% for the year.
>And this year, 2008 ... it still works?
Uh ... no, but I thought it was interesting nevertheless. (Of course it didn't work as well in 2008 but he didn't know the market was crashing to one the worst bear markets in recent history.)
>Where do you find them stocks that plummet then recover?
You can try DSA. (It is a link to javascript:OpenWin('DSA.htm') that you can get to on the site.)
Here's a spreadsheet that employs this buy-sell strategy:
Hi Lostcowboy, Hey, it's great if you're a month behind in your reading if you keep coming up with tips like these.
Thanks A Bunch!
Allen
Hi Toofuzzy, "It's all interconnected." Yep, and often we don't see the hidden connections until well after the disaster a move brings on.
I agree with you about healthcare. Why are we last, #17 of 17 industrialized nations, in health care and yet it costs about 50% more than France, the next most spent, per capita.
Cuba, a quite poor country overall, has a lower infant mortality rate and a longer average lifespan. This makes no sense.
And the talk of cutting science research spending is just plain dumb. We'll lose whatever place we have in the world when it comes to innovation if we cut it.
It's kind of like the change of public opinion that I've heard about Brexit after people became aware of the potential consequences.
Ah, well....
Warmest Regards,
Allen
This e-mail may, and probably does, contain factual errors as well as errors of logic, organization, grammar, and spelling. They are included at no charge. However, you're invited to make a donation.
Hi Gang, Saw this interesting graphic about those who might be hurt by a BAT - Border Access Tax:

Be interesting if there will be a squawk that is loud enough to prevent the BAT, after all it would mean that the cost of those goods that we buy from overseas suppliers will go up and the consumers (~70% of total economy) will get hit in many essentials.
Best,
Allen
Hi Toofuzzy, Do you mean LEAPS (Long-Term Equity AnticiPation Securities)?
Best,
Allen
Hi Toofuzzy, Yes, I've "started" investing and am making a small amount over inflation, about 3.9-4.0% overall but at the same time reduced the inherited losing positions by a lot and am now sitting on about 65% cash while I wait for the market to settle down as to what direction it is likely to head for the next while.
The positions I do have are doing quite well, what with dividends and positions' gains. The return includes the total portfolio, positions and cash, so the positions are doing quite well overall, about 11%, value and dividends combined. However, as one can see, large cash positions don't bring in all that much so I'm looking to find positions with relatively low volatility with some returns to wait out the coming decline.
Best,
Allen
Hi Toofuzzy,
I use very deep in the money CALLS LEEDS...
Hi Clive, Boy, I understand your frustrations with customer service. I've had problems both with TDAmeritrade and the company, ELB, that I am a sub-registrar for. At TDA I've been complaining about the web page display of my positions where the daily gain/loss does not match two other figures they display for the same thing. I keep getting bs reasons as to why that is true and correct even though I point out that those reasons don't apply - ex-dividend, after market pricing, and a couple other I don't recall at the moment - and I am supposed to be getting the "APEX" level of support.
As to ELB, they don't even bother to reply to e-mails or phone calls. They keep sending me French language e-mails that are not even relevant to my issue, but they sure did take my money quickly enough!
As a fairly technical person and President of the BoD of a small credit union I've been trying to help with the upgrade to the burglar/bill trap/video systems. What a pain. They didn't send the camera with the specs we requested, one of the pieces of gear they sent appears to be defective, the techs sent to install the recorder had never done this one before AND they had never had any training on installation AND they were not given a manual or the proper default admin password so they could set the proper time-out for the cameras. To keep it going one had to wiggle the mouse every 29 seconds. Even more frustrating is that they didn't provide the techs with the proper gear to set up the cameras.
I guess they figure there is no ROI on training or manuals but they sure don't understand that bad service eventually results in moving your business to someone who does a better job. It sees like "preventative care" is "too expensive" but fixing it after it is broken is less costly, or at least that is seems that is the thinking. Huh? So, not bothering to change the oil regularly in your car is more expensive than replacing the engine when it fails?
Oh dear.
Best,
Allen
Hi Toofuzzy, Given what I've seen, you are quite right about AIM taking a full cycle to see results.
My question is, before Lichello, did people feel there was no possible improvement to what was advised then? Clearly Lichello felt improvement was possible. It is also clear that he even felt his early efforts could be improved on. Are we to believe that there is no more room for improvement? I hope not.
After all, look at what Clive is working on, what Ken is doing and others we may not know much about like Jeff Weber AIMing LEAPS of the Dogs of the Dow.
My guess is that as things evolve there is always room for improvement and changes. Yep, it can be risky, one can make stupid mistakes, and totally misunderstanding what is going on in the market, but, hey, that's life. Love it or leave it. :)
Best,
Allen
Hi Toofuzzy, Yep, I understand the "smoke pouring out my ears."
I'm not a millionaire yet,... because I only started trying to understand the whole market thing in early 2014, shortly after my mother died and I had to manage two trust accounts. Then I came across AIM because of the book I had bought back in 2002 and never implemented for a variety of reasons. Joined this board in July, 2014 and have been most cautious since then.
The problem I started with is that my mother traded income for declining share values so that all of her positions were in negative territory by up to ~65%, an average of about 35%. That has be almost overcome and the net value of the positions is down only about 8% now and yet the rate of dividend return has declined only about 15%. So, on the whole things are much better and now have a good sized cash pool going forward. But, as CNBC quoted:
Investors are in for a rude awakening about a coming stock market correction — most just don’t know it yet. No one knows when the crash will come or what will cause it — and no one can. But what’s worse for most investors is they have no clue how much they stand to lose when it inevitably happens.
“If you look at the market historically, we have had, on average, a crash about every eight to 10 years, and essentially the average loss is about 42 percent,” said Kendrick Wakeman, CEO of financial technology and investment analytics firm FinMason.
Hi Gang, Of the 113 S&P 500 sector ETFs that I have listed, one had no gain or loss, nine had gains and all the rest had losses today. This is the worst I have noticed recently but not all that much worse.
^MXX (IPC) BOLSA, has been going down the last few days having hit a short term peak on March 6th in a recovery from a low last November, but lower than the previous highs in August and October.
The Bolsa hit its EOD peak before the 2008 crash on 10/12/2007 at 32473.4707 and hit bottom 3/9/2009 at 16964.35938, an almost perfect match to that bear market, starting down, with a couple of peaks on the way down like the S&P 500, slightly earlier than most said the bear market started and ending slightly after the bear market ended by most accounts.
Looking at the most recent charts for the Bolsa, it looks like it might be in the same territory and behaving in a similar way.
Best,
Allen
Hi Orcroft, Can Ray and Toofuzzy, Balbrec2, The various responses are the reason I post some, seemingly crazy, ideas on the list. There is almost some new idea or way of looking at the idea.
Okay, Balbrec2, you said "...I thought AIM was supposed to make market timing unnecessary." This is true to an extent but during some periods of the market, and with some positions, AIM does worse than B&H so if one can find a reason to go all cash, for example, then can do much, much better, overall. Imagine that you had decided to go cash, or an equivalent, in October of 2007 and you waited, using Orcroft's method for reentering the market you would have avoided buying on the way down during the bear market of 2008-9 and gotten back in in March or April of 2009, you would have avoided ~54% drop in the positions you held and you would have bought back in at near bottom. Check one of your positions and see what would the results be.
For goofs and grins I ran this on SHY, which we have seen from other posts tends to do better with B&H over some periods of time. B&H of $20,000 invested 9/1/2007 (131 shares) would have a gain of 4.77%/year. Straight AIM would have a gain of 5.42%/year, but to get this you need to hold 50% cash to avoid going into negative cash. Still quite good. However if you pulled your money and put it into a cash equivalent you would have been able to buy back in 4/1/2009 at $87.42, the second up from the bottom of $73.93 per Orcroft's method. Given history and paying attention to what has happened in the past you have studied you could gone in with only 20% cash, never go negative cash and get a gain of 7.41%/year. In actuality one could, if you are up to the risk, could have gone in with 5% cash and gotten 10.19%/year and never hit negative cash. And this doesn't include any monies you might have earned with cash/cash equivalent in the 19 months you sat out of the market.
All, in all, it seems that while following AIM without looking at the market as a whole, bull versus bear or snoozing, won't kill you it is possible to do significantly better.
As to Can Ray's caution about such a high Altman Z-Score, Orcroft told us about another metric to watch, the Beneish M-Score. The combo of the two looks like it would really help qualify the potential position one might be looking at. Add the Piotroski F-Score and we have a third perspective, two of which have no rating for EMMD. A clear signal that EMMD is not likely to be a good risk.
Best,
Allen
Hi Gang, I think I might have a better handle, or might only be delusional, about the time frame for the next downturn in the market. Of course this is only a wild hare guess but from looking at a number of historical cycles and and how current indexes are playing out, my guess is that the earliest possibility is about 4 months from now and that we are likely to see the downturn start somewhere around or before 52 weeks from now.
I don't think it will start in four months because there is too much chaos in the political world at the moment and it will take a while before we see a truer sense of direction for the market. The exuberance that has been playing out since November is, I think, based on assumptions and, to some degree, wishful thinking.
Look at GLD, it started at about $45 at the tail end of 2004 and is now at almost $115, but inflation contributed about 25% of that so the constant dollar would be about $86, quite good overall, but..., when one looks at the prices it has run through since 2004 until now one sees that it peaked at about $184 in August of 2011 and has been downhill since then except for the last period when it went up from a low of about $108 just before Christmas last year to a high of about $120 during the last week of February and down to almost $115 now. Up a quarter the last day of last week, but will it continue? No clue but my guess it that the overall trend will be down, especially since the Fed is likely to raise rates, which makes bonds a slightly better deal than they have been. It'll take a bit to play out but that is my best guess.
And it is this guess that parallels my thinking about the market as a whole. Plus it has been 8 years since this bull market began, making it the third longest bull market in history and only 10 months less than the second longest bull market, but 24 months shorter than the longest. I'm guessing that there is too much chaos in too many areas for the bull market to last another 2 years.
Best,
Allen
Hi Adam, I understand your concern and it is quite legitimate. However the range and velocity/volatility of most ETFs are so small that one can go several years before anything can happen. I'm most certainly not suggesting any great amount of money, more like Firebird400's Pocket Change Portfolio. See post #41728 and the earlier post #40329 for the basics behind the reason for looking at EMMD and similar possibilities.
Had I jumped on EMMD when I first heard of it, about the 1st of February, I would have made 257%, $12,858.60 on $5,000, with 1000 share minimum trade, $1000 minimum trade, 10% buy safe, 0% sell safe, and 50% cash. Had I really gambled with only 20% cash I would have made $22,663 or 453%.
Frankly I was too concerned that it was a pump and dump like one I lost $200 on about 30 years ago. That experience kept me totally out of the market until my mother needed a hand a few years ago. I clearly was thinking about trying again in April of 2002 as I recently found the receipt for buying the 4th edition of Lichello's book, but I never followed through. Now I need to make up for lost time in learning how and what to do rather than twiddling my thumbs in retirement.
Best,
Allen
Hi Toofuzzy, What, isn't auto correct smarter than we are?
Yep, FTR has been a dog for the last three years, but I was only looking at it as a wild hare ride short term. Even that doesn't look good upon further reflection.
Best,
Allen
Hi Toofuzzy, FOR? I was saying FTR. But I got curious about FOR and looked at the last three years on a monthly basis. 20% cash, 5% minimum share trade, 10% buy safe, 0% sell safe and it gets 17.566%/year. 10% minimum share trade gets 18.311%/year. D#$%, I wish I had seen that three years ago.
Best,
Allen
Hi Gang, I've been following two possible crazy AIM positions but only in the abstract, no money on the table. The more rational one is FTR and the truly crazy one is EMMD. Cramer is busy telling people to sell FTR, and given his history of being mostly wrong, it might be worth looking at. See David O. England's challenge: https://davidoengland.com/wp-content/uploads/2016/04/Cramer-Challenge-Returns-4-08-16-Results-FINAL.pdf Note that he paper traded based on $1000/position so fractional shares shown.
As to EMMD, talk about Froggy's wild ride. Yesterday it went down from opening at $2.63 to $0.76 and back up today to $1.31 at 2:30 EST! This after going from $0.29 all the way up to $2.60 in less than a month. Holy Guacamole!
One could make money with this volatility if it didn't give one a heart attack. I guess it's like going to Vegas with $500 in your pocket that you are not worried about losing. Last time I was in Vegas I made $15.75 on $10 in the slots. What do you think? Anyone for a shot in the dark?
Best,
Allen
Hi Clive, When you say: "AIM the inflation adjusted price...," how are you going about adjusting for inflation? Are you adjusting monthly? Or are you taking the previous year's rate and using 1/12th per month, guessing that it is close enough?
Thanks much for the two charts in your post. Very informative about the types of markets that AIM does not do all that well at. I suspected as much but did not think to do an analysis like yours. This is the reason I've been testing a variety of approaches. Also today's market is not at all like the one Lichello created AIM around.
It looks like, from your charts, that AIM does best holding onto its cash in a down market but not all that much better than B&H since about 1995. It almost seems like a horse race where one does better on some stretches of the track and the other does better on other portions.
BTW, sharing such large charts is easier using one of the free cloud repositories such as Dropbox, etc., where one can have ~2-5 GB, or more, of free storage. That way all you have to do is provide the proper link and password.
There is an extensive list of possibilities at:
https://www.thebalance.com/free-cloud-storage-1356638
If you can cope with a translated version of the Chinese site you can have 360 GB!!! of free storage.
Simpler is the 50 GB at Mega. No password required so don't put anything you care about there.
https://www.thebalance.com/mega-review-1356576
Best,
Allen
Hi Tom and Gang, I looked at VNQ and see that it actually is not a bad AIM position. Mind you, this is looking back at five years of a bull market. With $20,000, 20% cash, 30% minimum share trade, 10% buy safe, 0% sell safe, $1,000 minimum trade and adding the dividends to the totals, the return in the last 5 years would have been 7.983%/year. Not all that bad. If you use commonly recommended 5% minimum share trade the return is only 6.727%, at 10% minimum share trade the return is 6.908%.
Then I got curious about how well VNQ would do starting before a bear market and ending when the price got back to about the place it started. I went from 3/1/2006 through 3/1/2013. WOW!
I had to change things around to make it work. I had to use 65% cash to avoid a negative cash position and cut back on the minimum share trade to 15.5% (16 shares of the 103 starting number), greater or lesser % did not do as well. The result was quite good at 6.800%/year, in fact a whole hell of a lot better than B&H. B&H would have bought 294 shares, $19,968 worth, and ended up with $20,532.96, a total gain of $564.48 plus dividends of $5178.22, a total of $5742.70, versus AIM's gain of $11,637.48, including dividends and after commissions, 102% better.
What I have learned from this exercise is that using a bigger than commonly suggested minimum buy/sell gets better returns. Second, keeping your powder dry and ready to fire when the market takes a downturn is critical, but how does one know when the market is about to hit the skids? Sorry, I've no real answer for that.
I'd guess that one has to take into account both the history of the market, the current length of the bull market and what is going on in the economy to see if it is about to rain. Then one has to look at the typical bear market so as to assess when to start reducing the cash stash. Perhaps a switch to Twinvest for utilizing the cash stash might work during the down market.
What I'm going to do is work on the spreadsheet and see if I can put some sort of of variable cash, somewhat like Tom's Veale but rather than delaying sales to avoid too much in cash actually allow cash to build up as the market gets long in the tooth in preparation for the plunge.
Anyway, this has been fun.
Best,
Allen
Hi Gang, So I got to playing with Twinvest Combo and it looked a bit screwy to me given what was used for market prices and fractional share purchases so I redid it a bit so only whole shares would be bought and I used the monthlies for SPY for the last 5 years for comparison and a $250/month investment. Couldn't get the sale of stocks to work yet but what I did get very slightly better results without any sales and no fractional shares. Mind you neither would do as well in the context of having to pay commissions for regular stocks.
Even with TDAmeritrade taking over ScottTrade and lowering commissions to $6.95, the 60 months of trades would be a $417 hit on either, $4521.38 for the original and $4640.05 for the revised.
Anyway, the original got 5.33%/year and the revised got 5.456%/year. Not totally trivial but only $118.67 difference.
AIM doesn't do as well as Twinvest and B&H does much better at $25625.16, or 10.938%/year with a total of $10 in commissions.
Of course it is not fair to compare monthly investments to lump sum investments. And with low volatility AIM can't do anything for you, especially in a bull only market.
The real lessons to be gleaned from this exercise are that selection of the proper position is key to good results, and that easing into a position is often the way to go as one can take advantage of minor dips that AIM can't as you add to the position
Now to figure out how to get sales back and see if that makes any difference.
Best,
Allen
Hi Ken, PGX looks interesting from the point of view of having very low volatility; therefore it might be a good place to park money as it is paying ~4.88%, although it skipped last March and April.
BTW, I see TDAmeritrade is lowering its commission to $6.95, including options which will be $6.95 plus $0.75/contract.
Another thing is that GNL did a reverse split, 1 for 3 and it actually went up a bit. TDAmeritrade changed the closing price all the way back to it's start but Yahoo did not, though it s#$%^d up its closing price column and had it in the $2 range rather than than the $8 range it had been in. Oh, well.
Best,
Allen
Hi Toofuzzy, No, I'm not a member of Stock Charts, I just experimented with the settings to see what each did. Here are the four key ones.

Have fun,
Allen
Thanks, Jon. I'll look for it, but I'm guessing that, on the whole with the correct position selection, AIM does better overall given how little difference he showed between Dollar Cost Averaging and Value Averaging. Not that 0.5-1.00% is to be sneezed at.
I'm going to look closer at TwinVest Combo as that might be a good choice to use for the cash I have on hand, over 70% of total value, while waiting for the crash that's somewhere in the future and then transfer to AIM when I see some bottoming.
I've been sitting on mucho cash for a while as I did not see much happening in the positions I've looked at for income for the trusts. I'm guessing that I want something that has had a short range over the last several years, perhaps back to 2000 so as to include the last two major downturns. I'm guessing that it would be best to spread it out over a few positions to avoid risk. Anyone got a suggestion(s)?
Thanks,
Allen
Hi Gang, As I said, the variety of symbols in use is confusing. Stock Charts uses ^MXX for the Bolsa. Anyway, looking at the ZigZag for ^MXX, it shows a lot of volatility. (http://stockcharts.com/h-sc/ui)

This is with 15% for the ZigZag over 5 years. With 10% it has 13 moves in the same 5 years. Most interesting.
Then I got to playing with the chart and discovered I could look all the way back to 2008.

Looks like a prime AIM candidate to me. Think I'm going to add it to my watchlist and wait for the next downturn.
Best,
Allen
Hi Gang, Sometimes it is very confusing as to what the correct letters/symbols are to get things. Yahoo online does not seem to like ^MMX for the Mexican Bolsa. You have to search for MEX Bolsa and then you get IPC (^MMX)! Bloomberg uses MEXBOL:IND. Weird.
Anyway, I've been reading "Value Averaging" by Michael Edelson and it is and excellent read. He explains Returns and Compounding, Risk and Standard Deviation as well as having some excellent historical charts. But what is really great is his analysis of DCA and Value Averaging, especially avoiding taxes and trading costs, areas not discussed by Lichello, although Lichello does suggest not entering trades that are too small.
Edelson then goes on to talk about Playing Simulation Games and provides enough information that one can construct a spreadsheet to work with.
His final area is Profiting from Overreaction and is quite interesting as it somewhat ties into AIM in thinking.
I highly recommend reading it even though the data is quite dated being from 1989 and before. The reason I suggest this is that you can refresh your understanding of some basic calculation as well as seeing his comparisons to DCA.
I got my first edition copy from Alibris for $0.99 plus shipping of $3.95. There is a second edition from 1993 for $3.00 and a version from 2006 that costs $6.95, plus, of course, shipping.
Anyway, back to the tax avoidance and transaction cost avoidance I think I accidentally hit on an element of this myself when I upped my % sale from 5% to 30% - see post #41763. Doing this increased my theoretical return on the backtest of SPY by about 3%, taking it above inflation. Had I not tried that I would have gotten less than inflation.
It appears I got bit a bit from the tax angle last year what with the trades I did with AIM, not at all badly but not great either. For the future I'm going to try to calculate taxation when deciding when and how much to sell. TDAmeritrade allows one to sell highest priced positions, which helps a bit and since the trade cost is $9.99/per that is not all that big of a deal but it is not to be sneezed at as someone pointed our a while back.
Best,
Allen

