 News
News  Market Data
  Discover
Support: 888-992-3836
Copyright © 2023 InvestorsHub Inc.


SFSecurity
![]()
Register for free to join our community of investors and share your ideas. You will also get access to streaming quotes, interactive charts, trades, portfolio, live options flow and more tools.
Register for free to join our community of investors and share your ideas. You will also get access to streaming quotes, interactive charts, trades, portfolio, live options flow and more tools.
Belt and suspenders here, before I go off half cocked...
If I read this correctly:
...assuming one's desired fixed income / equity asset allocation is 20/80....
Hi Is7550, AIM-Hi versus LD-AIM
How do the two of them compare, again versus B&H?
I haven't played with Vealies enough - don't have it in my backtest spreadsheet - to understand how they affect results. How much difference would it make if one did not do them but just used the original method?
BTW, this is the greatest general interest forum I've ever been on. Much more help for each other and a whole lot less sniping than even some of the narrow interest, professional forums I'm on. Keep it up gang and we'll conquer the world! (Well, at least the world of investing.)
Warmest Regards,
Allen
RE: S&P A+ rating.
From AAII in reference to the Weiss Screen:
[Has a] Standard & Poor's earnings and dividends quality rankings of A- or better. The ranking, which can be found in the The Outlook from S&P Capital IQ, examines the growth, stability and cyclicality of earnings and dividend over the last 10 years. The rankings are further adjusted based upon corporate size, with minimum size limits placed for various rankings.
Hi orcroft, how did you arrive $29.75 or higher price from the $26.58 price? Using these figures and the BTB AIM formula 1 + 10% + 5% = 1.15 I do not get a sell signal until it is at or better than 30.57. Your figures are 11.9% apart, not the standard 15%.
Thanks,
Allen
Hi jaiml,
Also, my testing shows that one can squeeze another 0.5% / yr when using a lower buy SAFE, even down at 0%. The delayed method will prevent you from trading often.
Hi BowlerBob,
You are correct, I missed the "...as though he bought them at their High Point...." I might have confused his approach with a comment someone (I thought orcroft) made about accumulating buys until there had been an uptick in the price and then buy the accumulated number of shares.
However, in missing that point I was testing as though I had bought at an almost random point in the past, somewhere roughly between a peak and a trough. Then I was applying a "...don't buy until you get a run down and then buy the accumulated buy signals at the first point higher than the last buy signal." Doing this at any original purchase price seems to give a better longer term return than BTB AIM. When combined with following the same approach for sells, the difference between this approach and BTB AIM is significant. Not every stock/ETF does all that much better than BTB AIM and I've only found one that does worse than BTB AIM. But then not every stock/ETF does well with BTB AIM because it does not have enough volatility to kick AIM in the butt to wake it up.
Quote: So what do you do for the initial buy? Follow the advice that others have said, "...buy the worst performer(s)."
This is almost the exact opposite of his method, as far as I can see, unless you are limiting it to those A+ Rated stocks. This is his most basic tenet -- they must still be rated A+ on the date he is considering them.
Hi jaiml, RE:
1) Find a stock that has been dropping from a high point so that a virtual BTB AIM - started at that high point - would've triggered at least one or more buys (no sells in between).
2) If the price today is out of the buy zone, then add up all the buys and buy them in one chunk. If however the price is still in the buy zone (i.e. the downtrend continues or there are still some remaining leftovers to buy), then one can choose to wait, but that is subjective. One can make an exception for an entry point if the trend has not fully reversed yet; it all depends on how much the stock has failed by now.
Great looking interface, jaiml! All the data you might want for a quick glance.
Best,
Allen
Good Morning, Afternoon, Evening, or Night (depending on your time zone) JDerb,
Thank you for your response. Since I see the paper copy it didn't dawn on me at first that the online version was available earlier. I thought that they might release VLAP (ValueLine Appreciation Potential) at the same time the paper one was due to hit you mailbox. Then it hit me that they want to move away from paper delivery so why not release the online version earlier to encourage that to cut costs.
Anyway I got curious and did a spreadsheet at 5% intervals just to see how it tracked.
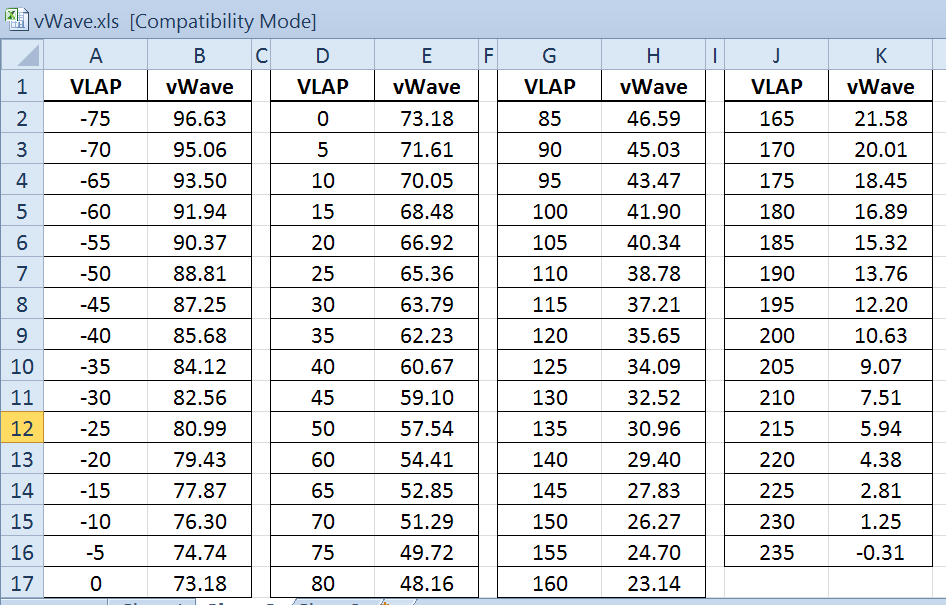
Here is the link to download if anyone desires.
http://investorshub.advfn.com/uimage/uploads/2014/9/30/bkgoqvWaveCalcs.png
Best,
Allen
I'm a bit confused about the change in the vWave. I just looked at this week's VLAP (September 26th issue), last week's VLAP and the prior week's VLAP and they are all 35% so what changed that moved the vWave from 62.23 to 60.67? Or are you getting it online and not from the paper copy and the new figure will be what I see with the next paper issue?
Hi jaiml, Welcome to the newbies, like me, with lots of questions.
Your observations are good stuff. So far I've only found one stock that was better with a by the book AIM compared to orcroft's approach. (I got so involved in double checking the results I forgot to write down the name. Dumb)
As to your question about the initial buy of a position, I don't think attempting to use ocroft's approach can be made to work. My understanding is that it is for an existing AIM position.
So what do you do for the initial buy? Follow the advice that others have said, "...buy the worst performer(s)." What period? It looks to me like the last 6 months to a year. More than a year seems like too long because of market noise, and other economic factors that have their ups and downs.
Finding the worst is a bit of a guessing game, but looking at typical business cycles and where a given position fits into them is a good start. Beyond that it is much like the annual contest that the NY Times (?) and other papers used to run where they selected a portfolio by throwing darts at a list of stocks and compared this to various advisers, etc. Mostly the dart method did as well as the advisers, as I recall. So not to worry too much.
BTW, what is the program you are using to get those charts and the rest of the data you showed?
Warmest Regards,
Allen
Hi Toofuzzy,
I don't have enough spare cash to do a full market down cycle if that is what might happen. Given that I had seen a similar set of curves to the ones that karw referenced when he was suggesting that it might be a good idea to sell any delayed sells we might have, I think that a wait for a week or so might be wise just to see if it is a false signal or the current swings in DOW, etc. are a harbinger of things to come. If nothing else it will allow me to check out a couple of bond funds that a local pension adviser mentioned in his column yesterday. This would also allow for buying in bonds as a starting point. As bonds tend to be less volatile as shown in the chart I posted (#38172) about the 50/50 bond versus all stock that I got from Wells Fargo.
Add in the normal business cycle stuff and Tom's sarcastic comment about not buying $30 stock for $29.95 and I want to see what's up, or down.
If you look back at the last two major down cycles you could see a trend before the major drop off, and they started quite a bit before the big drop. I've seen the same pattern in the Great Depression as well.
This is not forecasting the market, but being aware of gathering clouds and a strengthening breeze as a warning that you might consider furling your sails and battening down the hatches in case it turns into a major storm. Just wise seamanship, IMO.
Best,
Allen
Hey, you're flipping currencies!
Next buy price
PC / ( #S x ( 1 + SAFE + Minimum Trade Size ) )
= 30 / ( 1 x 1.2 ) (assuming 10% safe, 10% min trade size)
= £25 next buy price
Next Sell Price
PC / ( #S x ( 1 - SAFE - Min Trade size ) )
= 30 / ( 1 x 0.8 ) = $37.50
Hi Toofuzzy,
Your points are well taken and that is the direction I'm headed, in general.
As to knowing what the market is going to do, even the guru investors only get it about 60% right and then only for a while before they loose their touch. Hot fund managers are hired away by other funds and are not able to repeat their prior success. A study was done over several years that proved this. Not sure, but I think it was AAII that did the study. Disciplined investors can do about 40%. Most investors 30% or less, primarily because they are not rigorous about following a plan and they let their emotions get in the way of careful planning and following through with their plans.
As to the backtesting, it is only a way to select possible positions and how far one can go in terms of cash level. What I'm finding is that the 60+% is a bit high for stocks and leveraged ETFs and that 40% may be a bit low for plain ETFs. Most seem to need 43-5% over time.
But there is another point to the backtesting that you might not have thought of, the correlation between AIM actions an market direction or cycles. As karw has pointed out in his post, we may be near a market top. If he is correct then it would be foolish of me to buy positions that were likely to go down dramatically. Backtesting helps find positions with lower volatility for starting out. I can adjust slowly over time when market direction is clearer than it appears to be at the moment.
I'm not in such a rush to get into the market that I can't do it a bit at a time, learning as I go.
Best,
Allen
"Money doesn't come with a set of instructions on the back."
Hi K,
I suspect he at least thought "bad painter."
I'm curious, had you heard the story about the jailing of the lawyers and judges before?
I came across the story many, many years ago, around 1964 or 1965. I had happened across a story about a fellow growing marijuana seedlings on a barge in, if I recall correctly, Amsterdam Harbor and giving them away. The police took them away but then returned them about three days later, saying that he was correct, that what he had been doing was legal. They even sent him a formal letter of apology. This really tweaked my interest so I read up on Holland and its history and came across that tidbit about the Germans and the way the laws were changed as a result, which resulted in the laws letting what happened on vessels in Dutch harbors be the responsibility of the vessel's master, not of the local police.
I have come across other stories over the years that have reinforced my general positive feelings about the reasonableness of the Dutch. Then, too, Janwillem van de Wetering's Amsterdam Cops series absolutely charmed me. Grijpstra and de Gier are a hoot.
Warmest Regards,
Allen
Hi Tom, you may be beaten by me as to your age, but you are most certainly not knocked out!
I don't normally tell that much about my situation online but it was beginning to seem that people were becoming impatient with my caution so I felt it was needed.
I've only been here two and a half months so cut me some slack! Over the years I have found it useful to ask questions before acting. It prevents some, but not all, of those Oh, s$%& moments. I really don't have time for too many of those.
On a slightly different note, the experience of taking care of my mother, her estate and related issues, learning about investing, and a whole bunch of other things, like my 21 year old daughter, I've decided that once I get over the hump on the money stuff I'm going to write a brief manual to be used by people of any age. It will have a collection of my, and others', experiences and the solutions we found. Just brief stuff, like bullet lists and lists of resources. I've decided to title it, "Preparing for Senility - You Can't Start Too Soon."
Best,
Allen
RE: Hi Allen, Re: .......you just accumulate the number of shares to sell.... that will teach me to read more carefully what I write in the wee hours. I did mean buy, not sell.
best,
Allen
Hi Tom,
I agree that AIM is a great management tool. But, like all tools, it sometimes needs sharpening as knowledge is gained or other conditions change.
I just read a great example that happened to the Germans in WWII. The book, "The Rape of Europa" describes the response of the Polish and how they bent to will of the Germans after being conquered. But the Germans were completely thrown off their stride when they tried to do a much milder version to the Dutch and the Dutch resisted. They just didn't get that the Dutch were from a Germanic heritage but had changed over time and did not think like "orderly" Germans. The Germans weren't flexible enough in their management style to accommodate the Dutch persona. They never were able to completely subdue them.
One of the great tidbits of WWII lore is that the resistance of the Dutch was so total that the vast majority of the police, the lawyers and the judiciary did not cooperate with the Germans. Their resistance frustrated the Germans to the point that they jailed a lot of them for the duration. After the war was over the lawyers and judiciary compared notes and came to the realization that long prison sentences don't work. Now the Dutch have very short sentences and a much lower recidivism rate than we do.
There are two similar, conflicting, examples from American history, Prohibition, and the drug wars. With Prohibition we learned that managing that aspect of personal choice just did not work. With the drug wars it has taken 100 years to finally come to the same realization and it is still an evolving process.
In the same way the Dutch learned about the reality of how prisons actually functioned, and changed their management, we need to be aware of how things actually work and adjust our management to suit our increased understanding of the stock market. It's much like Lichello did when what he was doing got wiped out in '74, he looked at his choices and management of his investments and analyzed other approaches and then adapted and modified what he knew to come up with AIM. But he didn't stand pat, he tinkered with it as he learned more and as the markets changed. Plus he thought about new investors and retirees and their needs to come up with approaches to managing their investments that would better fit their needs.
My point in posting the information about the business cycle was to help me, and hopefully others, understand what is happening in the world around us better. I find that writing about what I have learned makes the information sink in and stick better.
As karw says
Looking at the numbers this weekend, it looks as if we should execute our (delayed) sells.
Give it a try and attempt to stick with it through a full market cycle and see how you feel about it.
I simply stated it was a tax benefit to not repurchase prior to 30 days.
I don't see how anyone wouldn't know of this benefit.
"Once you sell, to see tax benefits, you have to stay out for 30 days, me thinks"
Well, you would be wrong...not unusual
If when testing delayed trades, you don't have enough cash, that should tell you why you want to start with more cash.
If you don't have enough shares to sell, you are doing something wrong. Standard Aim does not run out of shares.
I was watching a short video and the presenter mentioned the crashes of 2002 and 2009. The 2002 crash actually started in the week of 8/2/2000 and hit bottom in the week of 9/30/2002 for a 47% loss. The 2009 crash started in the week of 10/8/2007 and then finally hit bottom in the week of 3/2/2009 for a loss of 56% if you look at the S&P 500 chart.
What we might want to be on the alert for is that according to the National Bureau of Economic Research (NBER) (http://www.nber.org/cycles.html) there have been 33 business cycles in the last 160 years and 11 since 1945. The typical cycle length from trough to trough is 69.5 months or about 5.75 years. The longest trough to peak in history was 120 months from March 1991 until the peak in March 2001.
The NBER dates do not align perfectly with the S&P 500 but they are close enough that it doesn't matter.
If we take the last full cycle it lasted 73 months from the previous trough to the peak.
So, given the 69.5 average for trough to trough, the last one of 91 months and that it has been 63 months since the last trough one could guess that we have somewhere around 15-18 months to go, at maximum, to hit market peak. I'd bet is is less than that but my crystal ball is a bit cloudy these days.
The concept that there are cycles in business has been documented back to the 1200's. Adam Smith mentions the cycles in wheat in "Wealth of Nations" so if he knew it in the 1700's, then it would be wise if we recognize that business cycles are almost like a force of nature, similar to the 17 or 13 year cycles of cicadas.
Best,
Allen
RE: You could use trailing stops but...
I forgot to mention that I've been buying near the limit of cash and selling near the limit of shares on hand. This happens almost automatically when using the modification of buying on the first up tick after a run down and selling on the first down tick after a run up. What I have found is that doing it this way you almost always are given a cumulative amount to either buy or sell that exceeds current resources on hand. This makes choosing the amount to buy or sell quite easy - all you've got.
I think it is this that makes the return higher than straight AIM because you have a higher percentage of your position in play at any one time. It seems much like when Lichello went from a 50% cash down, in steps, to 20% in AIM-High to get better returns.
Best,
Allen
You could use trailing stops but you would need to increase the numer of shares to be traded as the price increased or decreased.
Thanks Ray. No, you did not duplicate others. Besides even if it overlaps to some degree, having even slightly different views of a subject almost always helps. You know how when one person explains something you don't always get it but then someone else uses a slightly different approach to explain the subject and the light bulb turns on.
Best,
Allen
Hey, Grabber, Grab NetStock Now! Lots of cool features like 52 week hi/lo, ex-dividend date. Plus other stuff I haven't even had time to explore.
Best,
Allen
Thanks Grabber! This is truly a great group. As a COF (Certified Old Fart) having this kind of help is truly a blessing.
Best,
Allen
WOW! Great photo.
Happy B day, you spring chicken, you.
Allen
Hi Tom,
I feel like an idiot. I've been using Netstock for a while and missed that it has an alarm function. It's quite neat and I sent Henrik $50 because it is so good. He even fixed a problem that I had running multiple copies, one for each portfolio I have.
Now on the W%r function. Can I assume that the brown area below -80 in the chart is the area that validates a buy?
In your chart of AIM activity you have + for buy, - for sell and | signs. What do the | signs signify?
BTW, I love your charts, especially where it shows the hold range on the side. I haven't had the time to learn how to do such elegant charts yet. One day, I hope.
Best,
Allen
Hi Grabber,
Where does one find good info about the Williams %r metric?
As to alerts, what are you using for this function?
How would GTC orders work with the Sell on first down move after an upswing and Buy on first up move after a downswing? I can't see how one would set a price, unless it was above/below a selected point that was rather wide.
Also, I notice VIX is trending up but I don't understand the modeling it uses. Is there a good tutorial on VIX around? All I've seen so far is the sort of generic, "measures volatility" stuff.
Thanks a bunch, gang. The discussion keeps the blood flowing to the brain to struggle to understand it all.
Allen
My apologies, I did mean ocroft and just slipped a cog.
AIM can produce same direction trade signals repeatedly. Storing those up and making one larger trade potentially nearer (just after) the trough (peak) can 'average-in (out)' a single larger trade at a better overall average price than the cost-averaged of the individual trades.
Well, it really isn't fair to do a "capture ratio" when it has been basically a bull market for the period you are looking at.
Also, remember that the "game" isn't over yet. Will it be the one with the greatest AIM capture ratio that will win in another 5 years or will it be the one with the greatest price appreciation over that time frame?
Very interesting, especially if you lock the zero point and set the view to all for http://stockcharts.com/freecharts/perf.php?XLB,PYZ,FXZ,IYM,BMPSX . That way you see that PZY and FXZ have the most range change and that BMPSX, while being below the zero point of the chart since August of 2008, clearly has the volatility to be worth AIMing.
Thanks for the pointers on how to use the charts. I've looked at them but did not know about the underlying functionality.
Warmest Regards,
Allen
My bad saying construction staples instead of consumer staples.
Remember, another year might provide different results.
RE: http://stockcharts.com/freecharts/perf.php?[SECT]
In looking at this chart it seems that, relative to the rest, the three worst over the last ~6 month period are Cyclicals (XLY), Construction Staples (XLP), and Industrials (XLI).
Now a couple of questions.
Is Construction Staples (XLP) the same as Staples in the Sector Rotation Model that is below the chart (and the one I posted a modified version of in post #38138)?
If so, then things don't seem to match the sector rotation model currently as staples is in a very different place on the chart. What might be the reason (if there be such a thing as reason in the marketplace) for this?
Next, are there other possible sector funds that match (well, not exactly) XLY, XLP and XLI that I should look at, i.e. Proshares, Vangard, Fidelity or whatever? If so, why?
Thanks for all your patience as I struggle to come up to speed in a short time,
Allen
Hip, Hip, Hooray! Just exactly the tip I needed. There is so much information out there that finding ways of looking at it, and the potential pitfalls, is daunting.
I've gone over what my mother had done in recent years thinking that she had done so well years ago that I was shocked at how poorly she had done recently. This has me a bit spooked, I admit. But, then, (s)he who hesitates is lost. Accepting that one is going to make mistakes is tough given how little tolerance there is for normal human failings there is out there.
Warmest Regards,
Allen
Besides you only have funds for 3 of the 809 sectors at the present time.
Hi Tom, thanks for the comments. I've been looking at the Small and Mid Cap because a lot of the main survey listings tend to be pricey and less likely to have the volatility that AIM likes. As to
"Conservative Stocks Ranked #1 for Relative Safety" where there is room for up to 50 companies. So, I guess they don't think there is much in the way of bargains in the Small and Mid-Cap world right now.

