 News
News  Market Data
  Discover
Support: 888-992-3836
Copyright © 2023 InvestorsHub Inc.


SFSecurity
![]()
Register for free to join our community of investors and share your ideas. You will also get access to streaming quotes, interactive charts, trades, portfolio, live options flow and more tools.
Register for free to join our community of investors and share your ideas. You will also get access to streaming quotes, interactive charts, trades, portfolio, live options flow and more tools.
Hi Grabber, You are correct, but look at the charts for two years prior to the bottom and we may well be in the same position, at the very beginning of the slide. In both of the two previous bear markets the start was signaled quite early.
Best,
Allen
Hi Tom, Certainly too many black swan sightings and other cries by Chicken Littles. It is nice to see someone like your link that is a bit more rational.
I don't think what is going on is anything other than the normal business cycle with all its vagaries. Since even Adam Smith acknowledged cycles of various sorts back in the 1700s I think we can take it as given that they will happen, just like storms, and like storms, we can not predict them accurately, just prepare in case one might be on the way.
Best,
Allen
Hi Gang, Has anyone else noticed that a lot of the positions have a current one year chart that looks a lot like 2007 and 2000 but somewhat more volatile?
In the portfolios for the trusts all but two had a peak somewhere around last July-September and have been down from there. The two exceptions are mostly neutral, neither up nor down overall, but moving around a central point.
If this observation has any validity then we might see the same pattern as then, a bottom somewhere 12-18 months from now. If this is true I'd say we'll likely see a lot of puffery and posturing by the politicos next year. However, it might be a great opportunities for buying so keep your powder dry and available. I may have to do a tax loss sale to have a bit of cash on hand.
Best,
Allen
Hi Tom, Hadn't noticed the gas price jump as I filled up on Thursday to avoid the rush. What you saw matches what I saw a while back when it jumped $0.79/gal over a few days and was much slower to go down, and did not fall quite as much as it went up. Summer and the prices are rising.
Yeah, looks like we'll have a relatively quite summer. 92 of the 93 sector ETFs I watch lost money. Only LTL was up but it is so thinly traded that it doesn't really count.
Of the full list of ETF/ETNs, 330 had zero or less than 1,000 shares trade so I don't count those as indicators, 1155 lost ground and 260 were up for the day, a 4 to 1 loss ratio.
Looking at historical data the downturn is a couple of weeks or so late but not unexpected:

So, if history repeats (but not as farce, we hope), a bit delayed, it would seem likely that somewhere around the third week of June we should see an upturn. Just a short "go away" but the up is not enough to trigger buys overall. In some positions, like energy, we might get some sell signals. I hope EGY is one of them. Morningstar ( http://news.morningstar.com/articlenet/article.aspx?id=698461 ) says XLE is the only sector worth entering at this point as all the others are at "fair value" or above and are not worthy to invest in for gain.
Best,
Allen
Hi Jamil, You think Friday was a down day? Well, today as of 1 pm EDT all but 2 of the 93 S&P 500 Sectors I have a watch list of are down and only one is up! Yep, Froggy's wild ride.
Best,
Allen
Hi Is7550, While it is true that central banks have been buying up a variety of assets, I question the idea that these entities are really "government" in the usual sense. It seems to me that while these entities are nominally, at best, "our government," I see them as gloves worn by the power elite to protect their interests, and as such, they will rob Peter, us, to pay Paul, themselves. It seems to me that the proof is that, so far, none of the manipulators have gone to jail, and like Jon pointed out, not even had the fly swat of an official investigation and a trivial fine and a "Bad boy, don't do it again" injunction.
I'll begin to believe that it is not a coterie of the power elite in charge in all aspects of government when Jamie Dimon goes to jail instead of getting a boost in his pay.
How to deal with a rigged market? Who knows for sure, but AIM helps a lot.
Best,
Allen
Hi Jon, Thanks for the pointer and commentary. It seems that there is lots of manipulation that is known about and even more that we are not aware of yet, right down to local businesses, alas.
Was it ever really different in our history? I suspect not. History seems to gloss over all but the most egregious frauds like Enron.
Best,
Allen
So what does everyone think of the settlement with the big banks over manipulation of the FOREX market?
Given that the FOREX manipulation had gone on from at least 2008 through 2013 does anyone suspect the same is being done in the stock market?
Best,
Allen
Sorry Steve, didn't mean to call you Clive. Was interrupted by a scam phone call threatening me with a Federal lawsuit so I had a bit of a brain fart when I went to write.
I did warn that my posts may contain errors of fact, logic, syntax, etc. so I just proved it.
Best,
Allen
Hi Clive, So, given that we are long in the tooth in this bull market, would you set the buys and sells asymmetrically? Say 3 sells and 10 buys?
Then there was the fellow who said that instead of Portfolio Control being adjusted 50% when you buy one should use 54-58% and you would get better results. Have you played with that and been able to confirm or deny that result?
Thanks,
Allen
Hi Gang, Two new VIX based ETFs, VXUP and VXDN. Out for only two days so far but they might be worth keeping an eye on for future action because one, VXDN, is an inverse fund and so can be traded in a retirement account if you should desire to balance with a short position. This one might prove quite useful when the market "corrects."
Also at http://etfdb.com/compare/lowest-expense-ratio/ there is a list of the lowest cost ETFs.
Additionally at http://etfdb.com/cheapest-etf-for-every-investment-objectives/ there is a list of the cheapest ETFs for various areas, Brazil, TIPs, bonds, metals, etc.
Of course one has to look at things like thinness of trading, 52 week range, pseudo beta and such to make sure they fit your strategy.
Best,
Allen
Hi Jamil, Yea, got to watch for big chuckholes. However, they can provide excellent opportunities for gain if you hold your fire. Something like an index is not likely to stay down forever and so if you slowly buy on the way down and delay selling on the way up there are opportunities that should not be ignored.
My concern on what you were testing is the comparison between B&H and the barbell results. If I recall correctly you only beat B&H in one of the scenarios, not good enough. Messing with the parameters might change that.
My goal is to beat B&H by a little bit, ~0.1%, in an up market and then zoom past when the market takes a dive. If I manage to almost match B&H in an up market then I know I beat it over a full market cycle.
Best,
Allen
Hey Tom, you'd better tell Investopedia so they can be complete! We can't have you go unacknowledged, that just wouldn't be fair given how creative you have been over the years,
Best,
Allen
Be the kind of person that when your feet hit the floor in the morning the devil says, "Oh no, my nemesis is up!"
Thanks Tom for the lesson on stockcharts.com stuff, most useful.
As to the date range for the slider I wasn't all that interested in an exact range but rather a setting that helped visualize what has gone on in terms of market cycles and which sectors are in/out of favor.
I found it quite useful, especially that the metrics being used really affect the way things are perceived. Of course, we've known that a long time otherwise we wouldn't have the old saw about there being liars, damn liars, and statisticians.
Best,
Allen
Hi Gang, Being a little brain dead today I could not remember what ROCAR stands for so I tried to look it up at Investopedia and then on the net. No results, nada..., so, please refresh my memory, is it Return On Cash At Risk?
Thanks,
Allen
Hi Grabber, quite funny you asking the same question about New Math. Wasn't the Tom Lerher song, "New Math" with the line "So very, very simple only a child can do it."
I had not seen yours before I wrote mine. Not trying to gang up on Jamil.
Best,
Allen
Hi Jamil, Thanks for the clarification. It shows that a given position and/or strategy may not be suitable for AIM.
Based on your stuff and what I have played with, AIM really seems to do best with a selected position by buying at or near its 52/104 week low and near, but maybe not at, the top of a business cycle. This is tricky.
Maybe a combination of AIM and B&H, perhaps the Ultimate Buy and AIM (UBA) as been discussed here. Given that we are long in the current business cycle this may be the right time for new positions in the three most out of favor sectors. According to the Bloomberg Sunday chart of last week's and the past rolling year performance these are Energy, Telecom, and Utilities. Oddly, Financials compared to SPY are long time losers but on the Bloomberg chart it is #7 counting from the bottom. Not sure what to think about that.
Best,
Allen
Hi Jamil, Have they changed the rules for math? Back when they taught me (1-0.8)*2 worked this way:
1-0.8 = 0.2
0.2 x 2 = 0.4
I have not played with LD-AIM enough to truly understand it. Down the road a bit, once I have actually mastered basic AIM.
Best,
Allen
Hi Gang, Follow up to last post. Although stockcharts.com says only 10 stocks I though I'd try 11 and it worked. I added SPY, then made them all reference to SPY by clicking on the SPY button at the top of the chart.
Holy Moly! Using 2400 days financials have been going down since March 2007 and now are a bit over -110% down relative to the SPY.
http://stockcharts.com/freecharts/perf.php?SPY,XLY,XLP,XLE,XLF,XLV,XLI,XLB,XLK,XLU
Trying various time frames to display really helps see the bigger picture, which is great for developing the long term patience you need using AIM.
Shorter time frames seem to be better for choosing which sector is out of favor for sector re-balancing or such.
Best,
Allen
Hi Gang, Froggy's Wild Ride!
Thanks for the stockcharts.com stuff when I was asking about ETF betas.
I got to fiddling around and added EGY just for goofs and grins. Then I reset the time frame by clicking on the default 200 days and set it to 730 days, thinking that was 2 years but it is actually June 22, 2012 to May 19, 2015.
http://stockcharts.com/freecharts/perf.php?SPY,IYC,FVL,EGY
Look at the pseudo-beta of EGY! Even before the oil crash it was a wild ride. FVL, IYC and SPY are tame horses for first time riders by comparison.
Then I decided to look at the XL* sectors and played with the time frame displayed in the window. The smaller time frames seem to mask the relationships that we see. Overall it seemed that you got the best broad picture with 2080 days. This really shows the tech bubble and its crash as well as the housing bubble of 2007. Oddly, the tech bubble was much higher than financials (housing, REITs, banks, etc., is part of financials) prior to their crash.
http://stockcharts.com/freecharts/perf.php?XLY,XLP,XLE,XLF,XLV,XLI,XLB,XLK,XLU
Best,
Allen
Hi Tom, Out of curiosity I tried EGY to see its BETA and Moringstar does not list a beta and yet both Google and Yahoo do. Google 1.36, Yahoo 1.18. In fact Morningstar has almost nothing.
Go figure!
BTW, is Moringstar worth the subscription, overall?
Allen
Forget wine. I'll follow the Savior that turns it into coffee.
Hi Gang, Jamil referred to using adjusted Yahoo prices for his XIV backtest. Except for the one stock split there are no differences. However, MORL has different prices for the two columns.
My question is, given that we, in theory, only checking monthly, wouldn't the price we would get would be the price that day? If it was not within 3-4 days of a dividend it seems it would be would be reasonably close to the price of a few days before the dividend. For example daily results around the last dividend are:
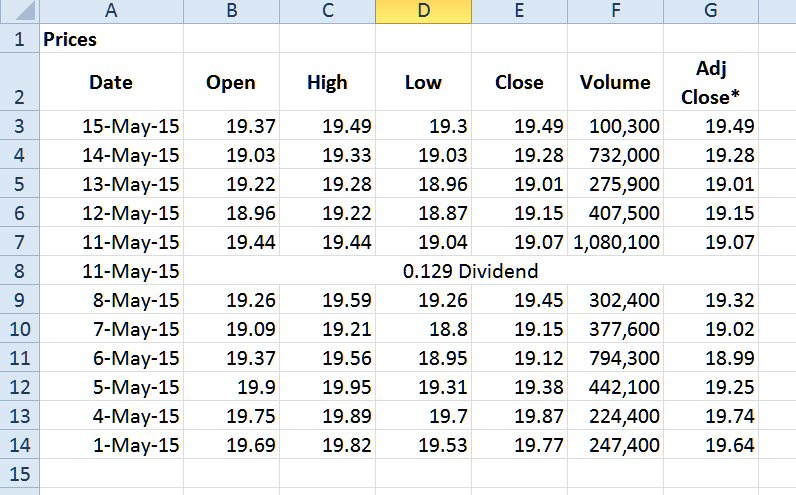
The difference in price between daily close and adjusted close is not much here, but when you go back to the first trades in 2012 it increases, for MORL, the day close is listed as $26.43 but the adjusted only $15.39.
Anyway, I ran a backtest on both and got wildly different results.
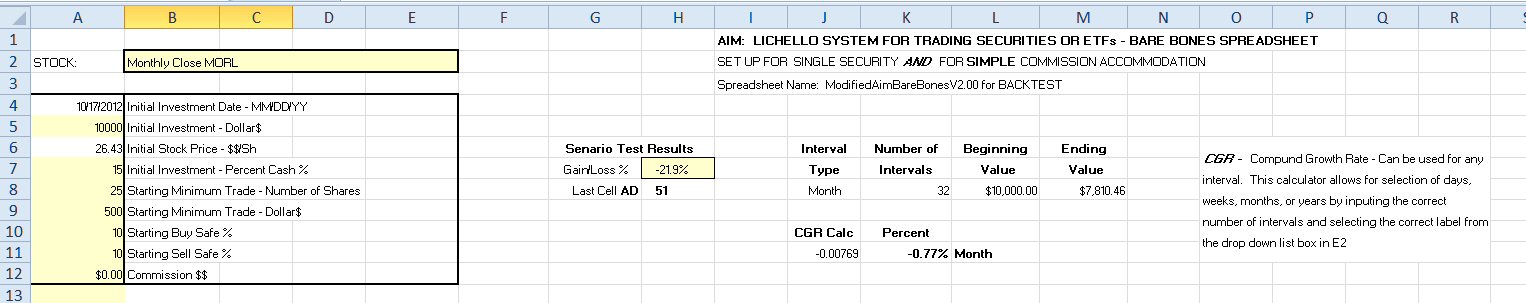
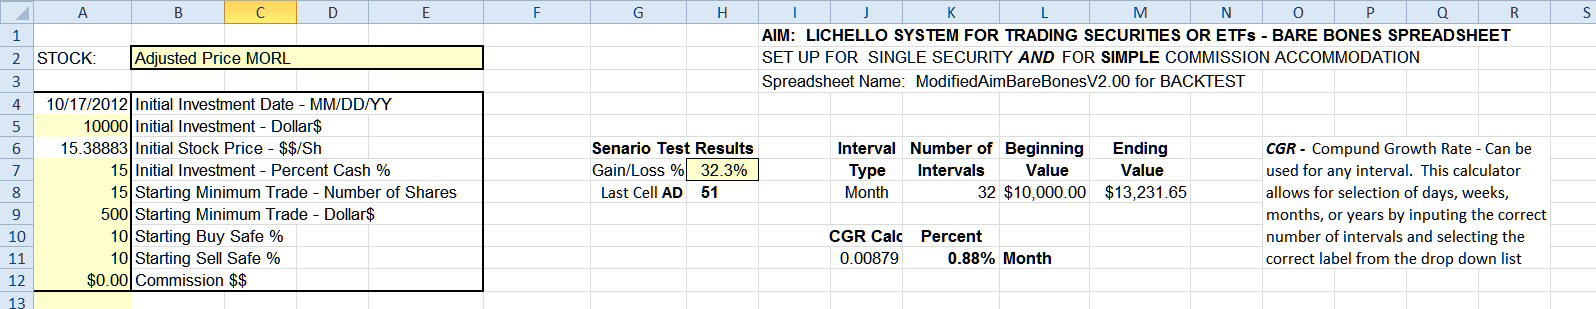
It does not seem reasonable to use the adjusted price as it seems to create a bias of rising prices that are not what it started trading at.
So, which is the reality that we should pay attention to?
Best,
Allen
Hi Jamil, Is the data in the side window the right data or is it the data in the bottom part of of the screenshot? Or is one just a different perspective on the same simulation?
Why I ask is that the side window shows B&H beats AIM in every scenario except when you start at the top of the market. Also it seems that the reason for this that cash is too high and so earning very little (2014 TIPS paid ~1.65%). Given that, it is clear that selecting the right place to put your cash has an important influence on total return.
I wonder what LD-AIM would do with this?
Best,
Allen
Hi Gang, I don't know what other brokers do but one thing that TDAmeritrade does that is quite useful is to allow you to select "Highest Price" when you set up your GTC sell. This meant that when I sold some EGY the other day I got a tax loss while gaining some cash. Neat.
Best,
Allen
Hi Tom, Most interesting thought. I have avoided looking at bond funds because of high costs as so did not know there were leveraged bond funds that might make sense. I'll be looking at them in more depth.
My education on bond funds is weak so could you explain why "there should be no further trading costs"? I may well be missing something here. Using AIM one would, from time to time, be buying or selling, right? So, how does one avoid trading costs?
Also, how does the management costs compare to ETFs or Vanguard bond funds?
BTW, got my first small sale of EGY at 2.52 today. Next at 2.95 but, given the general market volatility I don't expect it any time soon.
Best,
Allen
Hi Toofuzzy, I did not actually buy PGX, just used it as an example for discussion.
As to the 9 (10 in most cases) sector funds, which provider are you suggesting? I have 110 on my list:
DIG, FCOM, FDIS, FENY, FHLC, FIDU, FMAT, FNCL, FREL, FSTA, FTEC, FUTY, FXD, FXG, FXH, FXL, FXN, FXO, FXR, FXU, FXZ, IDU, IPD, IPF, IPK, IPN, IPS, IPU, IPW, IRV, IRY, IYC, IYE, IYF, IYG, IYH, IYJ, IYK, IYM, IYR, IYW, IYZ, LTL, PEZ, PFI, PRN, PSCC, PSCD, PSCE, PSCF, PSCH, PSCI, PSCM, PSCT, PSCU, PSL, PTF, PTH, PUI, PXI, PYZ, RCD, RGI, RHS, ROM, RTM, RXL, RYE, RYF, RYH, RYT, RYU, SPY, UCC, UGE, UNG, UPW, URE, UXI, UYG, UYM, VPU, XAR, XBI , XES, XHB, XHE, XHS, XIV, XLB, XLE, XLF, XLG, XLI, XLK, XLP, XLU, XLV, XLY, XME, XMLV, XMPT, XOP, XRT, XSD, XSLV, XSOE, XSW, XTL, XTN
Within this list there is a great deal of variability as to price, range and dividends.
Best,
Allen
Thanks Tom, most excellent. I've been playing with a higher stock value and lower buy/sell safe. I'll have to try your metrics.
BTW, what is the software you got the screenshot from?
Best,
Allen
Hi Toofuzzy, I'd guess that you have only held ETFs with a 52 week range of 1.5 to 1 or greater because when I do tests of those with a range smaller than that I don't get many, if any, trades unless I get in at the high or the low unless I chose alternate AIM settings.
For example, PGX which pays ~6.95% currently, has a range of $14.28 to $14.95. I defy you to get a trade with anything close to standard settings! But, given current inflation of less than 2%, it does make a great place to park your cash as it adds a nice sum to your total earnings.
It seems clear to me that one has to use somewhat different criteria in selecting ETF/ETNs than other possible positions. This means, I believe, that one may need to adjust the standard AIM settings to get the best out of them.
Best,
Allen
Hi Alton, Damn good question about EGY. It does not seem to be benefiting from the raise in oil prices. I've noticed that others in the energy sector are not doing all that well. A couple of them have reduced dividends. I'm guessing that is a delayed response to the fall in prices and will change down the road, but who knows when, especially given the bull market is getting long in the tooth and is likely no longer a sabre tooth tiger.
Best,
Allen
Hi Toofuzzy, The problem with a 5% value limit is that this is only $500 for a $20k position, 50% stock, 50% cash. This means a relatively high percentage cost in commissions - ~2% with the typical $10 commission rate. When you adjust your returns for commissions this can make your return less than the index.
In addition, even a 15% difference may not get you a buy or a sell with an ETF. Also, with the 10,10 and 5% parameters, using the online calculator the real range is 35.29%, not 30%. Sell would be at $11765 (17.65% up) and $8696 down (35.29% below sell and 14.99% below stock value of $10k)
Of the 110 sector ETFs I have listed 77 have a total 52 week range less than 35.25%. So, unless you bought in at the top or the bottom you would likely never get either a buy or sale barring a massive bull or bear market.
The full list of ETF/ETNs that I have is a tiny bit better as only 1107 of the 1614 have a 52 week range less than 35.29%.
So, as you can see, ETF/ETNs require a different set of parameters to make them work or selecting only those with the broadest range if you are going to get any action. Since action is the key to position grown, it will take some thought.
Best,
Allen
Hi Ray, A couple of issues around ETFs/ETNs/ETPs are that they often have less volatility and a smaller high to low range over time than single stocks/bonds. The problems with AIM and these positions is that the original formulation of AIM was before these products existed and so the parameters used for stocks/bonds don't fit all that well.
For example, if you use standard settings of 10% buy/sell and 10% stock value you will find that the next buy/sell will be beyond the 52/104 week high/low range. Then, in order to keep your trading costs to the minimum, you have to have a larger position size if you reduce any of the three settings. (BTW TradeStation has a commission of a penny a share with a minimum of $1 which helps a lot compared to the $8-10 range of others.)
Also, since the volatility tends to be low, then you have even less activity than a standard AIM position has. This is great if you don't have a lot of time to devote but it slows the process of beating the returns of the indexes.
Hope this helps,
Allen
Hi Clive, Most excellent and helpful explanation. I'm beginning to see how this type of allocation works. So many moving elements it's hard to see how they all fit together.
Best,
Allen
Hi Gang, Ran into something that I got a honk out of, the "Ulcer Index." Perhaps the vWave should be renamed to Ulcer Wave as it reflects that which causes the average trader to move out of the market when it is high.
Best,
Allen
Hi Is7550, Clearly you are correct about not selling your house to use the money to invest in a portfolio, but I don't see that it is a substitute for a real estate investment of some sort, apart from your own property. While it is true that most, but not all, investments have an element of real estate in them, I don't see that as a major or significant element for exposure to both risk and gain.
Almost all corporate bonds, for example, have the owned property of the company that issued the bond as a factor, but it is not the main focus unless it is a real estate venture. Could a bond from GM, say, have any better stability if they did not control the plants that they manufacture their products in? My guess is not. Yes, sale/lease back can work but at the cost of higher cost basis for manufacturing because you have to pay the profit the new owner of the factory wants. True, what a sale/lease back does is reduce current expenses but with triple net leases you don't gain anything on maintenance and other costs associated with the property.
So I'm not clear how the real estate that is part of a bond is all that much a factor such that you don't need some REIT like exposure to help things along. Perhaps I'm just missing some element to understanding this.
Best,
Allen
Hi Is7550, If you go 10% across your portfolio and add 10% US stocks and 10% REIT you improve your results by 128% - $479,822 versus $374,636 - without increasing risk all that much but with a lot smaller max draw-down than an all stock portfolio.
https://www.portfoliovisualizer.com/backtest-asset-class-allocation#analysisResults
I suspect that, among all the asset classes listed one could construct a portfolio that does even better; however, as we all know, past performance, yada, yada, yada...
Given that we have transitioned to a lower inflation rate - at least by official statistics - and very low or no deflation economy plus other things that are different now compared to the 1945/~1980 years I suspect that backtesting that goes back very far is probably not going to give us much better insight into the results that might happen going forward.
Looking at the longest official recent bull run market- March 1991 to March 2001 - it seems noteworthy that both the beginning and the end were just after a presidential election.
The beginning of the current bull run market is June 2009, - the actual low point for the S&P 500 was in February - also just after a presidential election.
So where is this bull run going to end? I'd say, given prior economic cycle history, the stock market election cycle, the bizarre year ending in 5 cycle and the presidential election cycle, we might well lay a bit of money that there will be a starting point for the bears to devour the market sometime over the next 18 months.
Also the current zig-zag sideways movement of the market over the last few months seems to approximately mimic 2007. Will 2016 mimic 2008? Hard to say but historically the election year has not been all that good for the market.
http://www.seasonalcharts.com/zyklen_wahl_dowjones_election.html
Also look at the Vwave, quite high for the last few months
It seems to me that we need to keep our power dry and have enough on hand to kill the bear so that we can feast when the banquet is served roughly 24-36 months from now.
But we must not ignore the possibilities, the black swan events - like earthquakes in Nepal or Fukishima - that could happen in a major economic locale. The editorial cartoon by Tom Meyer says this most eloquently when he compares Nepal's devastation with the possibilities for California's levees, water infrastructure, etc.
Best,
Allen
Hi Gang, Have you noticed that dividends seem to be declining? I've been looking at the position my mother was put into by her broker like IRR, MTGE, LNCO and others and they all seem to be reducing dividends. LNCO, as an example, has cut its dividend by half this year compared to last year. Others are not cut as much but it seems common. The thing is that many are also significantly below their 52 week highs as well.
Are the rest of you seeing similar things or is this just a function of the particular positions my mother had?
Best,
Allen
Hi Is7550, Very interesting as the image for US Inflation is quite different prior to ~1955: BTW, what is the definition of the UK Inflation Index? Is there a comparable chart for the US?
Fundamentally distils down to a short sharp pain i.e. bank depositors losing their money due to the bank failing - or a wider sharing of the cost of failure across a much wider base (entire taxpayers base). Personally I'd rather have seen the former, amputation to get the pain over and done with quickly as often there's a subsequent rebound/recovery after such pain - rather than a prolonged water drip torture (dull pain for much longer).
Central Banks holding all treasury bonds and world equity = death of capitalism.
Protracted declining yields since the 1980's had the tendency to provide above average capital gains (declining/lower yields = higher stock/bond prices).
Recent generations have become accustomed to 6% or 8% real rewards from their investments.
I'm not a paid up member of InvestorsHub like you and the structure of IH's interface for guests hardly attracts them to become members. Without some automated layout reformat code and ad blocking that I run that makes the interface more bearable I wouldn't read/post anywhere on IH at all. I'm reluctant to be a paid up member of a board (IH) that appears to intentionally scare off new users.
Hi Gang, The issue of bond returns has neglected inflation. Currently it is low but historically over the last 50 years it is ~3.85%. See:
http://www.in2013dollars.com/1965-dollars-in-2015?amount=100
Currently it is supposed to be less than 0% according to the FED as reported at:
http://inflationdata.com/articles/
Also, in looking at trends it appears that it has been falling in recent years compared to back in the 60s and 70s.
Nonetheless, it might be wise to assume some level of real inflation exists. One could take the FED's desired rate of 2% but, given that they have only come close to that about 8 times over the last 30 or so years, I think it might be wise to use a figure of ~2.5%.
Now what does one do?
Best,
Allen
Hi Gang, It is amazing what knowledge and help resides in this group! Thanks, everyone, for being so informative. It is not just Irp42, Is7550, OldAIMGuy, or Toofuzzy, but all of you.
So here is my contribution to this outpouring of knowledge. I wouldn't necessarily call it knowledge on my part, just something I stumbled upon. At:
http://www.sectorspdr.com/sectorspdr/tools/sector-tracker
is a great sector tracker that looks at today through five year returns of the ETF XL* sectors. In addition there is charting for each of the sectors and a bunch of other info that helps in seeing where a sector is at and so whether it is in or out of favor now.
Best,
Allen

