 News
News  Market Data
  Discover
Support: 888-992-3836
Copyright © 2023 InvestorsHub Inc.


SFSecurity
![]()
Register for free to join our community of investors and share your ideas. You will also get access to streaming quotes, interactive charts, trades, portfolio, live options flow and more tools.
Register for free to join our community of investors and share your ideas. You will also get access to streaming quotes, interactive charts, trades, portfolio, live options flow and more tools.
Hi Adam, You are absolutely correct. What I didn't say but should of is that this might be a possible place to park cash awaiting and during the early part of a bear market.
Currently I've been able to use tax loss sales and a couple of profitable positions to get cash set aside while I wait out the sideways market and the long bull run possibly changing into s big bear bite as well as figuring out the best, for me and the trust, positions/ETFs which have good prospects for 1-2 year volatility to get AIM action and are not likely to get closed or bankrupt.
My experience so far convinces me that using Lichello's Twinvest/Synchrovest for a few years while learning how it all works today, not what happened historically is a good idea. This approach is both simple and allows a buildup of enough capital to make AIM possible.
Having gotten dumped into it without much understanding I can see how many mistakes are possible. :(
Best,
Allen
Thanks Toofuzzy for the explanation. Very helpful. A couple of questions to see if I truly understood what you wrote.
When you say: "Buying the $10 call was like buying the stock on margin without paying margin interest..." does this mean you do not have the stock in hand but will claim it if it gets that low or near it? Or would you be adding this to what you already have?
When you say: "If it gets called I have a cost of $6.56 + $10 = $16.56" it is being called at $25, right? And you get the stock that called away by exercising your $10 call, right?
When you say: "It cost me $8.28 to buy the $10 call and i took in $1.72 on the $10 call for a net cost of $6.56." Is the $10 a typo and it should be $25?
Then when you say: "I did sell some $20 puts a day or two too early before doing the above trade. I did it when $20.50 (is something missing?) and took in $3.59..."
Sorry about being picky, but I have found that if I think I understand something and don't validate my understanding I make lots of mistakes and options is confusing enough I'm sure I need both belt and suspenders to keep my ass covered.
Best,
Allen
Hi Gang, A couple of possible ETFs that might be worth looking at, USMV which has beat the S&P 500 for the last three years and seems to be less of a loser in a down market. Here is the chart for the last year: https://www.ishares.com/us/literature/investor-education/usmv-smart-beta-benchmark-comparison
IShares has a new ETF, supposedly modeled on the same/similar parameters, SMMV, which is made up of ~370 small cap stocks that are supposed to have less of a downturn when the bear bites.
Given that AAII suggests that Small Cap Growth positions get better returns over the long haul and that the bull market is getting on they might be good holding pattern positions for the near term.
Best,
Allen
Thanks Adam, That makes a lot of sense. One thing I seem to be seeing is that there is less percentage change over time when the price of the position is higher so getting any action is harder, but low priced positions seem to be much riskier, especially with the hungry bear waiting in the wings as the bull market keeps charging on.
Happy Upcoming Turkey Day,
Allen
Hi Toofuzzy, I bought SLW at $17.88 the other day and now want to set up a couple of options trades having done well with another one recently, but I have a couple of questions.
"The Complete Guide to Options Selling" says, on page 51, that buying a call is a bullish strategy and selling a call is a bearish strategy so why the mix? Did you do this because you think that the market is in a doldrums period and is not going to go very far in either direction? Or is there another reason?
Also, what expiration date(s) did you use?
TDAmeritrade shows a $10.0 Call, spread between $7.15 and $8.95 and open interest of 698 for January 20th expiration and zero interest for December.
As to the $25 call TDA shows the $25.0 Call, spread between $0.21 and $0.23 and an open interest of 4,843 for a January 20th expiration.
If I understand this correctly, buying the $10 call cost ~ $800 per contract but selling the $25 call would only get you about $22/contract. So how does one cover the other?
Or did you sell the $10 Call and buy the $25 call? I'm confused.
Thanks,
Allen
Hi Adam, What percentage change did you set for the sell?
Thanks,
Allen
Hi Tom, So when are we going to have another get together?
Given all that is going on and the long in the tooth of the bull market we might well need to meet and greet as well as share what to do next.
Been reading "Investing at Level3" by James Cloonan of AAII fame. Interesting ideas that might well be combinable with AIM. Some of what he writes about is very similar but what is different might well be useful in selecting positions going forward, that is, after waiting until Orcroft's method about when to buy and/or MCAD crossover, it is time to put available cash to work.
BTW, that crazy mistake I made a while back that added ~20% to the tax loss when I did tax loss harvesting is sticking quite well. Not only did I get reduced taxes but also cash to sit on for a while until the right time to get back in. Sweet.
Best,
Allen
Hi karw, Am I correct in understanding that you run your whole portfolio in one AIM basket and also track each position individually in AIM as well and that is what you mean when you say "iAIM"?
Are you using the whole portfolio AIM as a way to re-balance the amount in each position periodically?
Thanks,
Allen
Hi Orcroft, When you use the converging line crossing, how far do you require? .001 or less?
Thanks.
Allen
Hi Toofuzzy, How did you come to add 30% to DHT given that it was up $0.24 (5.76%) today?
Also what do you mean "...macro LD Aim...."?
Best,
Allen
Hi Orcroft, The link to the AIM post shows up but not the links in it. Is MACRO-AIM a software inclusion in AIM or is it like the MACD where one looks at it at Yahoo, or one's broker?
MACD seems like one needs to monitor it daily to catch the moves. Is MACRO-AIM the same, or do you have a schedule you use?
What parameters do you use for each?
In looking at MACD with the default smoothing of 9, and the other two at 12 and 24 then looking at it again at 9, 24, 52 like I have seen suggested, it appears to me that RSI (14) seems to indicate oversold faster than MACD, but not the overbought.
I tried creating a MCAD with 9, 10, 30 parameters and that seems to match RSI (14) on the oversold, and again not on the overbought.
My understanding is that you use the MACD and two upticks for the next buy. Do you look at MCAD on the sell side?
Thanks,
Allen
Hi Gang, An observation. I created a watch list with ETFs split between stock sectors as well as growth and value stocks. Then I added bonds, short term - BSV, BND, long term - BLV, TLT, and treasuries, short, medium, and longer term.
What I have noticed is that an up day for the stock market is a down day for the bonds and treasuries. Well, we all know that, but what I see is that the reversal is happening almost daily. While I have not gone back and done all of them in the 2007-8 time frame, the few I have looked at seem to have done roughly the same back then.
Is it a real clue or just happenstance?
Best,
Allen
Hi Tom, Thanks for the explanation of how Newport works in the background, it helps a lot.
I got frustrated with it when trying to move existing positions into it in a way that made sense and so gave up on it. Now I see that I should not have tried to do that but only new positions as I created them because what you describe makes more sense as a way to go.
The other thing it seemed to me, who knows how accurate this perception was, that in order to generate reasonable levels for buy and sell I had to have larger positions than was possible at that time with the free cash on hand.
So I'm going to go back and try Newport again on the newer positions that I have that I've been tracking with the spreadsheet.
But I still have the concern about ETFs that, for the most part, which trade within a narrow range. This, too, seems to require larger positions than I can create and generate trades within reasonable time frames and have any range of diversity and this concerns me.
How do you handle the tight range issue, Tom?
I've been tracking the Bloomberg sector listings in my Sunday paper for more than a year. I wish I could find out which ETFs or indexes they use to create their charts, probably ETFs as they list market value for each sector. Anyway it seems that Consumer Staples, Utilities, and perhaps Telecom are the ones out most out of step with the general direction of the market. Given this I'd want at least one of these and one or two of the others to create my basic portfolio going forward for the bulk of my portfolio. Does this make sense, especially that we are likely to have at least a correction within the next twelve months?
One fellow I've read calls a ~10% downturn a timid bear, a downturn of ~20% a hungry bear and anything more a ferocious bear. My guess is that we will see a hungry bear this time around, but, who knows?
Best,
Allen
Whoops! I must have been more tired than I realized as I switched the cash for the PC instead of stock value. So the screwy results I got were a result of my screw loose. 80/20, AIM-Hi works just fine with the calculator.
Best,
Allen
Happy Birthday, Tom. Wish you many more.
Allen
Hi Tom, I agree that keeping the commissions a low % of the total of a trade is important. I'm working toward a minimum dollar trade and my first step has been to match the online calculator and then migrate to a dollar minimum. What I was comparing to was the online calculator versus what I was doing for a spreadsheet and my spreadsheet is working essentially the same as the online calculator, barring the difference in the buy price.
Given what you say, perhaps the online calculator is not doing it the way you say: "Next Buy/Sell prices are a relationship between the PC Value and the Share Value (not share price)." This seems to be true only with a 50% stock, 50% PC, as you will see below.
The problems with the online calculator are twofold: using the standard 10/10/10 and 50% cash tends to create a transaction that is too small in dollar terms, the other problem is that the buy signal is closer to the current price than the sell signal which is not good, in my opinion. I believe it promotes buying too soon. Another problem is that, typically, as you increase any of the parameters you increase the price range needed to get a transaction above the minimum $ amount desired, $1000, in this case.
I was using the parameters from a small position that I'm trying to set buy/sell points and is actually too small. So, to make it easier to see I've switched over to the more standard $20,000 with $10,000 PC and stock value of $10,000.
if you increase the buy safe to 20% it actually reduces the dollar size of the buy transaction:@ Stock Value Above $12500
Min Sell Order Size $1250
Min Sell Price $12.5
Min # Shares Sell 100
@ Stock Value Below $8333
Min Buy Order Size $833
Max Buy Price $8.33
Min # Shares Buy 100
and if you increase the stock sale to 15% but leave the buy safe at 10% you get a different problem:@ Stock Value Above $12500
Min Sell Order Size $1250
Min Sell Price $12.5
Min # Shares Sell 100
@ Stock Value Below $7692
Min Buy Order Size $769
Max Buy Price $7.69
Min # Shares Buy 100
Yes, the dollar size is better for the buy but now the range between the buy and sell is is 166.63% (164.9% on my spreadsheet because I can set the minimum buy share % separately) as opposed to 50% with all 10%s for safes. This may not look like much of a problem but, since the recommended positions are ETF/ETNs, many do not have a price range much bigger than 50%. Of the 1641 ETF/ETNs in my list only 22.9% have a 52 week range greater than 150%, or $8.33 to $12.50 as one example. This would mean that the likelihood of any transaction happening anytime soon is unlikely.@ Stock Value Above $13333
Min Sell Order Size $2000
Min Sell Price $13.33
Min # Shares Sell 150
@ Stock Value Below $8000
Min Buy Order Size $1200
Max Buy Price $8
Min # Shares Buy 150
My spreadsheet more closely matches the online calculator for this example:@ Stock Value Above $18750
Min Sell Order Size $1875
Min Sell Price $12.5
Min # Shares Sell 150
@ Stock Value Below $12500
Min Buy Order Size $1250
Max Buy Price $8.33
Min # Shares Buy 150
However the online calculator is totally screwy if one is doing an AIM-Hi, 80% stock, 20% PC for a $10 stock with a $20,000 position, i.e., $16,000 in stock and $4000 in cash as PC:Portfolio Control $15,000
Share Price $10.00
Shares Owned 1500
Share Value $15,000.00
Sell Minimum % Shares 10.00%
Sell Safe % 10.00%
Buy Minimum % Shares 10.00%
Buy Safe % 10.00%
Next Sell Price Above $12.50
Shares to sell 150
Share Value $1,875.00
Next Buy Price Below $8.29
Shares to buy 150
Share Value $1,243.00
This entry was assuming a $20,000 position, $16,000 on a $10 stock with $4000 cash position. Changing to a $30,000 or even a $100,000 position doesn't change a thing except the dollar size of the transaction. The sell and buy prices remain the same, $3.13 for a sale and $2.08 for a buy. My spreadsheet has the exact same problem, to the penny on sell and buy prices.@ Stock Value Above $5000
Min Sell Order Size $500
Min Sell Price $3.13 - Less than 1/3rd cost
Min # Shares Sell 160
@ Stock Value Below $3333
Min Buy Order Size $333
Max Buy Price $2.08 - the odds of an ~80% drop are trivial
Min # Shares Buy 160
Hi Gang, In checking my spreadsheet version of the online calculator I found an error that I fixed the way I thought it needed to be, but it turned out that the sell price was a match but the buy price did not match. I scratched my head for quite a while but never found out exactly what I did differently that made the difference. Then I did the calculations where the sell and buy would happen relative to the current price and I found an oddity with the online line calculator.
PC 3498, 377 shares, share price $9.28, buy,sell, % shares all 10%. The Online Calculator comes up with:
The percentage between current price, and the next sell, 11.6/9.28=125%. The percentage between current price and the next buy price, 9.28/7.73=120% going up or 7.73/9.28=83.3% going down.@ Stock Value Above $4373
Min Sell Order Size $437
Min Sell Price $11.6
Min # Shares Sell 37.7
@ Stock Value Below $2915
Min Buy Order Size $292
Max Buy Price $7.73
Min # Shares Buy 37.7
Hi Toofuzzy, The reason for going to the trouble is that hype is the most common element of investing. The goals, in my mind, are to be informed about the history and prospects of any investment.
Peabody Coal, anyone? Or Washington Mutual, Inc. - I worked for them as an information security analyst and thought it likely they would be in trouble at some point. Sure enough 3 or so years later, bankrupt. Then there is Enron. The signs were there, I've been told, if one were to be diligent.
IYR is just one example of an ETF that could slide dramatically and it would take one years to recover one's loses.
Another reason to look closely is that measures like you suggest, "...the 13 crosses the 30 day ma." are around in the thousands. Some say 40/80 ma, others say 10 ema/30 ma, still others say 50/100 ema, an then there are those who talk MCAD, On Balance Volume, and who knows what else or whether they are of any real value.
You've said, "buy what you like," but what if one liked General Motors Corporation? What would have happened to them in 2009?
I don't "like" any company, ETF, bond, etc., per se. I do tend to avoid spending any time on ones that I think are damaging our health, economy or environment as a first screening and then I want to know if they are likely to lose traction should we hit another down market. Then there is the Growth versus Value question. AAII has a short article about that subject this month.
Anyway, enough rambling. It just seems to me it is smart to understand as much as possible to reduce risk.
Best,
Allen
Okay, Gang, We've talked about the Altman Z-Score and how it only applies to stocks, not ETFs. So I've be thinking - dangerous occupation - and looked at IYR in particular and I think I've come up with a way to use the underlying positions to assign a pseudo Z-Score to an ETF.
Here's what it looks like in a spreadsheet:
The "% Total of Positions divided into 1" 3.31 is the number of times one would have to multiply the total percentage of the samples to equal the ETF total of 100%. The rest is pretty straight forward.ETF Name - IYR
Column Headings
#1 "Top Stocks in ETF"
#2 "% of total of the ETF expressed as a decimal"
#3 "Z-Score"
#4 "Z-Score Multiplied by % of holdings"
#1 #2 #3 #4
SPG 0.0706 1.77 0.124962
AMT 0.0510 1.46 0.07446
PSA 0.0350 18.69 0.65415
CCI 0.0338 1.35 0.04563
PLD 0.0296 1.07 0.031672
HCN 0.0290 1.24 0.03596
EQIX 0.0271 2.19 0.059349
VTR 0.0261 1.25 0.032625
Totals 0.3022 1.058808
"% Total of Percentage of Positions divided into 1" 3.31
Multiply 1.058808 by 3.31 to get the Pseudo Z-Score 3.50
Hi Toofuzzy, Tell me about it! I always see my mistakes AFTER I have sent the message.
Love your sign off as that is the type of thing my daughter sends me and then she gets p#$%d off when I say, in return when I'm not sure if I understand, "What?"
Best,
Allen
Hi Toofuzzy, No, I wasn't busting your chops, I just thought you had concatenated two words via a typo and I couldn't figure out what the two words might be. It never occurred to me it might only one word.
Typos are us, and I've made more than my share over the years and they always come back to bite me when others have commented on my technical manuals.
Best,
Allen
Hi JonG, I ran a quick test for 5 years (weekly) with $20,000, 50% cash, $1000 minimum sale, 50 shares minimum, 10% buy and sell safe and found the next buy would be at about $53.50, ~15% down, and the next sell at about $91.50, or ~47% up. I used the 50 shares/30% because it ran out of cash in the original 5 year back test.
Running the same as though starting fresh from $62.04 in the spreadsheet with the rest of the parameters the same, the buy would be at about $43.50 and the next sell at about $105.50.
These tests are straight up or straight down, not bouncing around like reality.
Using the Online Calculator the next sell would be at about $77.55 and the next buy at $51.70 but this is using only 10% shares to be sold/bought. If you use the ~31% like I did with the spreadsheet the sale would be at about $105.15 and the buy at about $44.
However, my spreadsheet version of the online calculator came up with slightly different figures using the same 31% minimum shares to buy or sell (which shows 50 shares): $76.93 for next sell, and the buy at $51.98. But using the 10% minimum shares it came up with a sale at $66.22 of 16 shares and a buy at $58.35.
This difference I don't get, I confess. Back to bashing my head against Excel, I guess.
If this were still in the early years of a bull market, I might just continue, but, given that we are nearing the end and likely headed to a bear market in the next 24 months or so I would start over.
Given the tests I did I probably would set my buy safe a bit higher and maybe even lower the sell safe a bit.
Best,
Allen
Hi Toofuzzy,
chancestors
Hi Gang, As of last Friday the 47 ETFs I had on one list, all but two had gained, one was no change and one had a small loss. Monday all were losers but one small gainer. Today they were all losers. So I decided to try to create a chart that might reflect where we are in the Bull/Bear cycle using Yahoo's ^GSPC S&P 500 numbers. It was easy to match up the lowest weekly close for the 2002 and 2006 bear market. The low was $800.37 at week end 9/3/2003 and the low was $683.38 at week end 3/2/2009.
Then I grabbed the data and made two charts, attempting to see if I could match up the current with the previous two.
This is the first version.
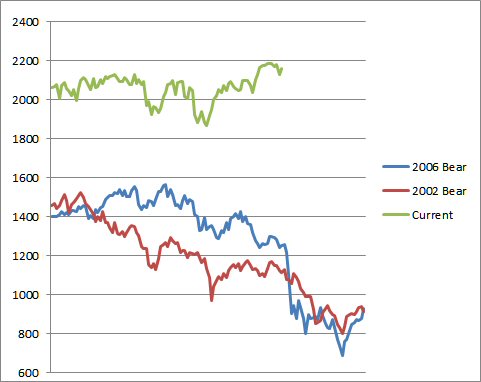
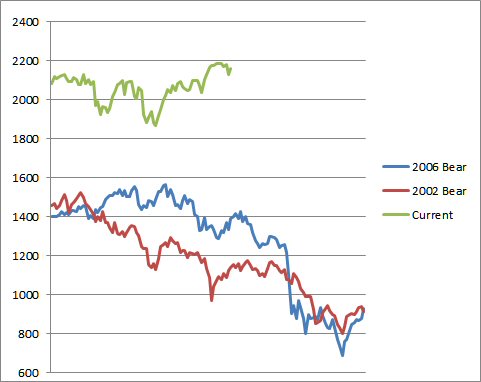
The beginning dates for the 2002 market is 6/5/2000 and 11/13/2006 2006 market. The end dates are 12/2/2002 for the 2002 bear and 5/9/2009 for the 2006 bear market. The beginning of the Current chart line in the first image is 10/27/2014 and 4/13/2005 for the second image and the end date for both is last Friday, 9/12/2016.
Here is the second version.
I'm making a wild ass guess that we have not quite hit the beginning of the next bear market as there still seems to be some upward move possible. Hindsight is always easier, alas. However, if what all the pundits are saying has a grain of truth in it September is supposed to be a down month, but then, you know pundits, more wrong than right most of the time, especially the cross-talk between them.
Excel makes it difficult to cover a much longer period so matching baselines is almost impossible and inexact.
Allen
Hi Gang, now on a completely different subject. I saw a reference to "...an ETF that is definitely trading deliberately. This is a market with no price gaps from one candle to the next. [snip] There are very few unusually wide range candles." Then he goes on to say "Now let's compare that to this chart. This is an example of a market that is definitely not trading deliberately. [snip] This one is just hopscotching sideways with huge, unusually wide range candles. You see this all the time, with ETFs in particular, especially the lower volume ETFs."
The second one is a reference to a chart where there are gaps, and big distances between open and close prices all in a relatively short time frame, only a few months.
It seems to me that AIM is best with ETFs that are "...definitely not trading deliberately." Does this make sense?
Best,
Allen
Hi Tom, First of all when I upgraded Firefox it did "Hide the stickies" so I did not see them. When I finally noticed the setting they popped up.
Now that is solved I refreshed my memory of yours where you say:
NSP - Next Sell Price
NBP - Next Buy Price
SO - # of shares owned
MSO - Min. # Trade Shares/Order
PC - Portfolio Control
                        PC
  NSP =        ---------------------
                 SO (0.9 - (MSO/SO))

                         PC
  NBP =        ---------------------
                  SO (1.1 + (MSO/SO))
NSP - Next Sell Price
NBP - Next Buy Price
SO - # of shares owned
PSO - Min. % Trade Shares/Order as whole number times 5 (5% would be 5*5=25, 10% would be 10*5=50
PC - Portfolio Control
                          PC
  NSP =        -----------------------
               SO (0.9 - ((PSO*5)/SO))

                          PC
  NBP =        -----------------------
               SO (1.1 + ((PSO*5)/SO))
                        5000
  NSP =        ----------------------
                500 (0.9 - (25/500))

                        5000
  NBP =        ----------------------
                500 (1.1 + (25/500))
Hi Ray,
Sort of correct, the 2012 version "... although it was designed originally for publicly held manufacturing companies with assets of more than $1 million. Later variations by Altman were designed to be applicable to privately held companies (the Altman Z'-Score) and non-manufacturing companies (the Altman Z"-Score)."
I figure that since ETFs are non-manufacturing it might well be worth calculating the Z"-Score for ETF/ETNs, at least a few, and see if, combined with other metrics such as the Piotroski F-Score, or maybe seekingalpha/AAII screenings, it might help. No clue yet, haven't done enough yet.
The label in the illustration is sort of generic and the publicly traded companies variation might be made to fit ETF/ETNs. https://en.wikipedia.org/wiki/Altman_Z-score#/media/File:Zscore.JPG
Best,
Allen
Thanks RT. Don't know why I couldn't see it. Blind, I guess, or maybe too many popups.
Thanks,
Allen
Hi Toofuzzy, Actually that won't get you what you think.
Standard scores are also called z-values, z-scores, normal scores, and standardized variables; the use of "Z" is because the normal distribution is also known as the "Z distribution". They are most frequently used to compare a sample to a standard normal deviate, though they can be defined without assumptions of normality.
The z-score is only defined if one knows the population parameters; if one only has a sample set, then the analogous computation with sample mean and sample standard deviation yields the Student's t-statistic.
For Fisher z-transformation in statistics, see Fisher transformation. For Z-values in ecology, see Z-value. For z-transformation to complex number domain, see Z-transform. For Z-factor in high-throughput screening, see Z-factor. For Z-score financial analysis tool, see Altman Z-score.
Hi RT, I signed up for seekingalpha but can't seem to find the place where it "...has a 36 month and a 60 month beta for ETFs." Would you please send a link to the spot?
Sure a lot of hype, glory and nonsense on seekingalpha with long, complex article with lots of charts going back years to support the idea that we are still in a bull market for the long haul. I'm guessing, given history, when the gurus all say we are good to go is when we need belt and suspenders.
Best,
Allen
Hi Ray, Yep, Yahoo Canada does the trick! Now to figure out what exactly do I need to do to calculate the Z-score.
Best,
Allen
Hi Ray, Thanks for the tip!
Best,
Allen
Hi Gang, First of all, don't trust Yahoo stock data at all. In looking at SOXL and comparing it to Google's there is a section of the historical data that is off by a factor of 4 from the adjusted close! Where the screwed up is where the 4/1 stock split happened. It is wrong from there until 5/20/15 and then it is right.
I just wish Google allowed you to look at history in weekly and monthly in addition to daily. Yeah, I can mark and copy/paste to do it but what a pain in the south end of a donkey headed north.
Then when I looked at the closing prices listed by Yahoo and Google they don't sync exactly It is as though one or the other used a different data point to record the price. ARRRGH!
I went to NASDAQ as well and it differs by a penny or so from time to time from Google, but it too only shows daily figures.
Anybody got a better suggestion where to get data for backtesting?
Best,
Allen
Hi Mvls, No, it is not just a "me" thing. I've posted a bit about this "change for the better" (not) and there are many unhappy people out there.
I got an e-mail from Michael La Guardia, Senior Director of Product, Yahoo Finance since I maintain a Yahoo e-mail addy, and in it is a link to a place to tell them what is wrong with the changes: https://yahoo.uservoice.com/forums/382977
It is well worth reading the many comments, almost none are positive.
Back in the day when I worked at Yahoo they were "upgrading" the web site. Well, it previously had been written in Python and when it was done they terminated ALL the Python developers. So when they wanted to do another upgrade they decided to outsource it to India and nobody at the Indian company knew Python, only PHP, a precursor language that is quite different, so they had to write from scratch and had the type of problems we are seeing now. Funny thing I knew one of the Python developers who had been at Yahoo when the previous version was done. We were both working at Visa at the time. The stories he told me foreshadowed Yahoo's position today.
Best,
Allen
Hi Mvls, You bet. The ways that you manage the differences might prove useful to those of us who are not lucky enough to live in the Great White North so, please do not hesitate to tell us as we might be able to morph them to our benefit. And don't forget, we have a few people from England, and, if I recall correctly, Netherlands and maybe other parts of the EU. We all live in a more connected world so when the next bear comes calling we all might get bit on the ass.
Best,
Allen
Hi Toofuzzy, Thanks for the tip about AAII, I did not know that. There is so much on the web site that it is easy to miss something.
I bought a lifetime subscription when I first took over managing the trusts and it has been quite helpful, both for the knowledge, though sometimes it takes a bit for it to sink in, and for comparison to what I'm trying to do.
Best,
Allen
Hi Toofuzzy, I know, but the goal for the trusts is to minimize capital gains taxes while clearing out the debris, not avoiding a wash sale. On the one trust it is already done, on the other it still needs to be done.
And I know about the IRA/401K limits.
Thanks,
Allen
Hi Gang, Someone, don't recall who, mentioned the Altman Z Score. In the process of looking further into this I came across another possible simple way of sorting the good possibilities from the bad. "Joseph D. Piotroski is an American professor who specializes in accounting and financial reporting issues. ....The Piotroski F-Score is a 9-point valuation metric derived on this research [called] Joseph Piotroski's F-Score." (Wikipedia - https://en.wikipedia.org/wiki/Joseph_Piotroski) He wrote a paper: Value Investing: The Use of Historical Financial Statement Information to Separate Winners from Losers. You can see a copy at: https://www.chicagobooth.edu/~/media/FE874EE65F624AAEBD0166B1974FD74D.pdf
Well worth taking a peek at.
Best,
Allen
Hi Mvls, In looking back I noticed your post about"
but one annoying result is that a number of my sell points ended up being at or below my average cost now. My question is how best to fix this?
Hi Toofuzzy, I'm not really looking for the "Holy Grail" in AIM, it's just the way I learn how to use something is to dig into it and see how it works. I've read Lichello's book(s) several times but it wasn't until I did the 10, 9, 8, 7, 6, 5, 4, etc. as opposed to what he has in that table, 10, 8, 5, 4, etc., did I truly begin to understand how fundamental rate of change is to a successful AIM program. The same is true for Portfolio Control %.
Let me assure you I tiptoe onto the ice on the lake as one can not truly see how thin it is in spots. My sense is that the market is just about the same, ice that might give way any second.
BTW, I finally got the final K1 sorted out and finished the taxes for last year, and as bad as my knowledge was to start with two and a half years ago I still wound up ~0.75% above inflation for both accounts. Considering that both accounts were, not so much now, deep in the red, I consider that a great win. Well, at least a tiny one. The end of the year results in all accounts is getting closer to break even or above where they started in 2013 when I took over.
Have a great Labor Day Weekend everyone!
Allen

