 News
News  Market Data
  Discover
Support: 888-992-3836
Copyright © 2023 InvestorsHub Inc.


| Followers | 1653 |
| Posts | 18,274 |
| Boards Moderated | 1 |
| Alias Born | 11/10/2004 |
| Twitter Profile: | Temporarily Unavailable |
| Follow on Twitter: | Follow @ Temporarily Unavailable |
lowtrade
![]()
Register for free to join our community of investors and share your ideas. You will also get access to streaming quotes, interactive charts, trades, portfolio, live options flow and more tools.
Register for free to join our community of investors and share your ideas. You will also get access to streaming quotes, interactive charts, trades, portfolio, live options flow and more tools.
MJTK chart update
I'd like to thank devon1 for a gift subscription @ IHUB. It helps me a lot!
From this chart it looks like the price will walk down to fill the gaps below before any new movement north.
The uncalled for price and volume spike 2 days ago reminds me of a darkside trading group move. They hold a lot of shares, and when they see volume fall while price climbs they know retail is not going to support the run to flag target. So the wash trade higher between the group to get retail emotion involved and dump their shares in a lightning strike pop. Once all is sold price dives as there was no real retail support in the first place.
If this GUESS is true. I'd say this play is over. Worth a weekly watch though. Because this retrace is forming a new possible flag pattern.

I use to call that a musical chairs play. Place a GTC buy @ .0001, if or when filled place a sell @ .0002 and wait!
Since everyone else is trying the same thing there are normally many many ahead of you in the sell order line. And it can take weeks, months, sometimes years to get your turn at the winning seat. I've had one for several years now. Just keep renewing my Good till closed sell order. LOL
Good luck
The flag is there, but I don't rely on TA & charting of triple zero stocks. All triple zero stock plays are a gamble, more then trade, IMO.
Luck
Think you'll find NGD had the same charting problem. But it's TA and bottom trend seem a little better. I've been watching it and actually noodled a tiny position when 3.05 resistance was broken back on the 13th.
Play at your own risk though. I personally feel the dive was an over reaction on it's delay on the Rainy River project.
Can't advise about any triple zero stock, as they are not market driven, but darkside driven. All one can do is guess and gamble what the darkside will do. And a triple zero 1 or 2 is the worst game in town.
I see emotion on the 9th, profit taking the 10th. Gap continuation the 13th, with no volume support today. At least it broke north and killed the previous negative chart projections. So your long term prediction is heading the correct direction.
GOOD LUCK.
Yea a late starter. Personally don't like the gap up or the less then supportive volume.
EMX is a confusing one. No real chart pattern with radical price, volume, & TA indicator flux. Looks like a day trader is playing there.
I was involved in EGO in the gold sect. Just took profits last week. BTG looks like some accumulation taking place at the recent price stall. That's a positive for possible continuation.
Here's a gold play I'm watching.
Could go either way. I'm seeing more positive then negative right now. Looking for 10% swing trade if top resistance breaks.
Lots of info in this chart. See if you can understand each patterns + & -'s as it played out. That info will give you an eye on retail phycology and sentiment. during runs and retraces. This will aid in how to understand what may happen next.
I'm liking the 10% channel to break north because ever since the Dec 20th confirmed entry TA still says hold and retail seems to be adding rather then leaving in the support indicators. Past patterns retail took profits on each retrace. This time they aren't. They are holding and accumulating.
You can see this in the conflict of the ScotchRSI & CMK. S RSI says BE OUT but there is still buy pressure in the CMF. Majority is buying when they should be out. Says sentiment positive. Now if the phycology follows volume will increase on resistance break, just as before.
http://stockcharts.com/h-sc/ui?s=EGO&p=D&yr=0&mn=3&dy=0&id=p64697066016
We'll see! LOL

CLF Chart eval
Not looking good for that climb you expect right now.
MJTK chart eval
TA & Chart says if in you can still hold. But if ADX black line starts falling and/or 5 day MA blue line continues below the red 10 day. that's an early exit signal. The confirmed exit signals would be DI+ crossed below DI- and/or the 10 day MA crosses below the 20 day with the 5 day.
To find a flag target add the height of the flag pole gain to the retrace reversal point. You can't project target until down trend reversal starts. You can only predict in from a down trends stall point.
Also with the FIBs 50% holding one could expect a continuation tp previous high. So that's a positive to all the other indecision still hold points.
All and all I'd want some volume supported price increasing from yesterdays bottom point tomorrow. Todays bounce didn't have that! So I'd have concern that retail does not feel this pop deserves continuation. Without that support, I personally would consider early exit and take the profit I have, over the one the TA & chart projects. Because of the long 8 days since initial price pop. You usually see continuation within 5 days with these out of the blue pops!

2017 first heads up.
Keep an eye on LLNW.
Working on it's second flag pattern, showing some accumulation PRE FEB 8th earnings, in the support indicators. Good trend in the DMI with 5,10,20 MA @ possible continuing "BE IN" confirmed entry. The flag started with the BBands tight, another positive for continuation of it's 2 month price climb.
Last Q's earnings were good, this one also expected good. But FEB 8th will determine price pop above the $2.65 high and if price runs to second flag target of $2.95. That's a possible 10%+/- gain from $2.65 breakout entry.
http://stockcharts.com/h-sc/ui?s=LLNW&p=D&yr=0&mn=6&dy=0&id=p85683887421
Play at your own risk, but it may be my first 2017 swing trade.
Yes; Take profits when they appear. Wanting / expecting more, is the number 1 reason 90% of penny players lose their shirts.
There is a reason old saying are around forever. The one that fits parabolic runs is; "A bird in the hand." Everyone knows the rest. "Is worth two in the bush!"
The one I live by and pounded into my kids heads was;
Learn to be happy with what have have, and you'll be happy your entire life. Desire is a goal, not need.
For all the private messages I've been getting. I'm not ignoring you. I no longer have my gifted subscription to IHUB. It ran out and I can no longer reply.
X,CLF, & AKS acted as expected in my 12/9 post. All retraced to fill gaps below.
For a 2017 up date: it seems all 3 have settled down well, pre end of year. With concern for CLF's large flag retrace.
CLF may have a problem coming back, as volume interest of retail is falling more then it should, plus DMI is close to a negative cross.
http://stockcharts.com/h-sc/ui?s=CLF&p=D&yr=0&mn=6&dy=0&id=p02277185307
X seems to be the best of the 3, to break north again in 2017. It has a pennant with retail accumulation at the present price level. So interest remains.
http://stockcharts.com/h-sc/ui?s=X&p=D&yr=0&mn=6&dy=0&id=p56271466186
AKS also has a pennant and positive DMI like X. But there is no accumulation taking place. It doesn't seem to have the retail backing needed for a 2017 come back, unless there is a new PR to re-establish falling interest.
PMCB eval;
Check this chart; http://stockcharts.com/h-sc/ui?s=PMCB&p=D&yr=0&mn=6&dy=0&id=p32461445922
Flag pattern retrace, Gaps above, are filling today. If top resistance is broken, @ .16, you can expect to see another large move, indicated by the ADX above 50 still, in the DMI indicator. The support indicators StochRSI and CMF are in conflict, saying BE OUT, while there is strong buying pressure. This indicates retail accumulation at the present price level. Over all the chart pattern is working on it's third flag pattern, if top resistance breaks. The third flag in a row is normally the final and largest when active.
All and all I'd say STRONG WATCH, new entry on resistance break with 3rd flag pattern target price of .21 or better.
Play at your own risk. This is a TA & Charting evaluation only.
Merry Christmas & Happy Holidays with a prosperous New Year
Thanks, back at you!
X you'll see 33 possibly 29 very soon.
CLF 9.50 gap will fill, possibly the 8.50 one also.
AKS another way over extended ADX 9.75 gap will fill possibly the 8.25 also.
TA & chart wise all 3 are showing strong signs of exhaustion. When this happens the expectation is always seeing gaps below fill. The first probably the second possibly.
My opinion, as always, learn to take profits on the first red day of a parabolic run.
Nice one !
I closed my resent FAS play last Monday and plan to stock pick again till the EOY, just for fun. Reached this years goal, working no next.
Success to all followers !!!
Have a GREAT up coming HOLIDAYS !
That's one, you'll remember for years. Just hope you noticed the high exhaustion candle spike and exited on the first red day after.
I've been teaching that for years when playing parabolic stock runs.
I've been real busy off market. Sold my 1/2 acre 4 bedroom 2500 sq ft home in the burbs and finally took the empty nest step down into a manageable Philly row home, in the middle of everything.
Looking for new swing trade stocks now, after my 3+/- weeks of FAZ?FAS. Did well and reached my years wants last week. Expect to reach my years goal by EOY no problem. Then it's back to a new trading business plan for 2017.
Continued success to you.
Well FAZ channel didn't break Monday and picked up 5% on FAS so far this week. To date up 10% flipping FAS/FAZ. IMO more day trading flux to come.
FAZ chart
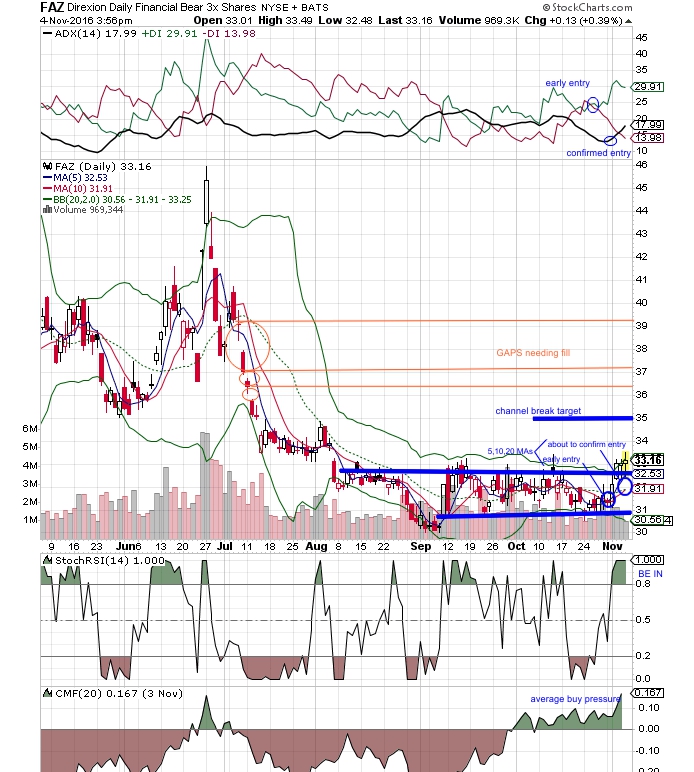
Just picked up 2 FAZ day trade plays; as expected. IMO were headed into weeks of market flux. I'm on the sidelines with the 2130 S&P breakdown.
Just playing FAS/FAZ, with FAZ chart showing strong indications and potential as being a hot trade vehicle, if bottom channel breaks up next week. Channel target $35.50 +/- with lots of gaps above after that is reached.
http://stockcharts.com/h-sc/ui?s=FAZ&p=D&yr=0&mn=6&dy=0&id=p62025293893
EMXX
With the DMI indicator, which ever is on top, indicates the expected trend direction +/-. But what confirms that trend to actually move is the Black ADX line to turn up and move in the same direction.
So basically trend expectation is seen with the green DI+ or red DI-, but the black ADX triggers the actual trend to start! Until ADX moves up with which ever is on top; the price normally fluxes without actually trend. Just a expectation of it.
As for EMXX trend; long term is the positive base trend line will continue. Looking at the chart One should expect the present channel continue from 3 bottom bounces to a possible 5; before price reaches the base trend line. Then you need to pay close attention for the next run to start. If that happens you'll have the 3rd and last strong run long term. Because just like flags come in 3's, bump & runs do also.
Also I should note with bump & runs the price normally returns to the base line after run reversal. How long that take varies. Could happen fast or drag out over time like this one has.
So if one is a long term holder of any stock on it's 3rd B&R pattern, they should plan to take profits at the reversal of the 3rd run.
Short term is in the 2nd chart. Trade the channel from 1.00 to 1.15. With channel plays, one can rely on the 3rd bounce and possibly see two more if the top channel line holds on that bounce.
Looking at both short and long charts it looks like Mid NOV is where to watch for any new real run. At the end of the present channel hitting base trend line. I should note this does NOT indicate a run, only expected new main decision point within the long term chart. The price could break down there also. Depends on sentiment at that time. The phycology should be for a run, but nothing is ever a sure thing.


All"s fine, just spending time on other interests. Doesn't seem to have interest at the board to learn trading now days. Hardly any questions on trading or setting up a trading style or business plan.
Still check the board for questions, haven't had any. And my portfolio hasn't been changing much lately. Just working my business plan and only swing trading 40% of portfolio, on 2 week cycles this Q. Thus my market life has been rather mechanical & boring. Not full of TIP when I'm very active searching for new trades frequently.
Matter of fact, the last OTC stock I had interest in was 2 months ago. And the small caps area has been rather weak. One could just trade the Russell 2000 and make out as well as stock picking there. Still jump to FAS/FAZ when the S&P fluxes; which may be in the cards soon.
So basically all I do is go to work every two weeks, and check the board for questions, if someone is looking for a mentor. I have noticed your still holding your own with your picks. But will note a negative flavor to the $RUT the past 2 weeks. So I'd say caution with any under $5 stocks held. There is a mid term flag pattern, but a descending triangle short term right now.
If 1210 @ $RUT or 2120 @ the S&P are broken. Time for the side lines, other then ones dividend holding; and some FAS/FAZ trading for a month or two.
IMO the market is in a decision point. The S&P has a pennant pattern. Better then the Russell 2000 with a flag/descending triangle. But both have negative trend, technical indicators. So I'm watching for the possible break south @ the S&P, to jump out of 2 week Mid cap swings, into FAZ quickly.
???
37 - 30 = 7
that's the last run. For flag projection add the old run (7) to the new bounce start point. If it bounced Monday you would add 7 to 33.5 for a target of .405.
Keep an eye on BAA again, for possible flag bounce.
http://stockcharts.com/h-sc/ui?s=BAA&p=D&yr=0&mn=3&dy=0&id=p58573867481
Personally wouldn't challenge that gap below, at NEXS. Especially with a BIO. They run on pure emotion.
REN $18.20;
10 days straight green run, with volume still coming!
This one is going in the record books!
When REN broke top resistance Monday, I should have played the flag. But I hate emotion and the huge candle turned me off. Glad you did well. Thanks for the board post.
I looked at it when you first brought it to the board. My problem was I couldn't find a reason for such price and volume actions. And since "I only play what I want, not what's in front of me." I missed another one.
I see your REN pick, hit flag target today.
Buying emotion runs are only a reason to buy, when you take profits at the first sign of change.
Nice !!!
My picks are, shell we say, less then active. LOL boring
Long time.
Buying emotion runs are only a reason to buy, when you take profits at the first sign of change.
Good luck my friend.
OUCH just noticed TEUFF gapped down huge today. Guess who ever was manipulating this one, isn't playing the OTC game fairly.
But a five day run and a weekend to think, can cause things like that, on the OTC.
NO
The rule of thumb for common gaps is "90% of gaps fill; but often the first in a start of a new run are left behind."
It seems this is the start of a new run. I wouldn't place too much concern on those gaps. Just be aware if it starts to retrace and crossed the 68% FIBs retracement line. Then those gaps become a concern. Other wise, most come back runs will flag step higher. The thing to do is place a FIBs overlay on the run, after the reversal day and watch the retracement. You want it to bounce before it reaches 50% retracement for a continuation to be expected.
PS; turn log scale OFF, when you look at charts. Log scale distorts the chart view and can trick the eye into making a mistake in health of a charts performance.
Log scale ON;
http://stockcharts.com/h-sc/ui?s=TEUFF&p=D&yr=0&mn=7&dy=0&id=p29277905615
Log scale off;
http://stockcharts.com/h-sc/ui?s=TEUFF&p=D&yr=0&mn=7&dy=0&id=p76218945379
NOTE: how it looks like the run is closing on 8 cents, next resistance, in your log ON chart. Doing pretty well!
Then see it has a long way to go to 8 cents next resistance, in reality, in the log OFF chart.
One could easily think the stock is better off then it really is, when using a distorted chart look.
Took a trip to see some of my kids; sorry for time to answer.
CDE short term; everyone loves it. Trade the flag chart patterns, when they break top resistance.
Long term; study the bump & run chart pattern. Eventually what goes up, will come down. And with all the common emotion gaps from mid June to now. This flag may not bounce at trend line.

Bulk shipping is a 50/50 industry lately. 50% are doing real bad or 50% are doing real good. In this case, I'd recommend looking at the ones doing well. They seem to have good managements. which deserve investor interest. DRYS is one which is doing real bad. IMO stay away.
http://finviz.com/screener.ashx?v=141&f=ind_shipping&o=perfytd
IMO hold your big board stocks. Their about to run with the S&P the next two weeks.
I just noticed a support indicator conflict, in the S&P, that is hinting the it is about to break north. And that break should be strong, because the ADX is coming from 15 over sold levels.
At any rate, I'm expecting all boats to steam north soon. Commodities should tag along. If your in gold & oil plays. We'll see. But as of today, I'm a bull on the market's future.
QUES The volumes traded daily can't be bought & sold large enough to make any profits worth getting involved with. Doesn't matter what's happening with the reported financials. ADV 35K
From what I read in the last 10Q and looking at the stock price chart, this company looks just like a privately held company, in business for producing wealth for it's owners and private investors. Seen in the resent personal debit conversions to class C preferred and having the largest expense as employee salary & compensation.
I would not personally get involved with the stock. Can't swing trade it. Can only day trade the large daily, low volume, price flux, IMO Which makes this one a little guy day trader stock. Someone who day trades a couple hundered $, on the tic by tic runs & retraces.

