 News
News  Market Data
  Discover
Support: 888-992-3836
Copyright © 2023 InvestorsHub Inc.


cjgaddy
![]()
Register for free to join our community of investors and share your ideas. You will also get access to streaming quotes, interactive charts, trades, portfolio, live options flow and more tools.
Register for free to join our community of investors and share your ideas. You will also get access to streaming quotes, interactive charts, trades, portfolio, live options flow and more tools.
I don't ever remember hearing GILEAD mentioned, nor can I find anything on them on my PC or via Google. I agree, a great customer to add.
Customer Splits for FY20 (4-30-20) from pg.39/10K:
Latest 10K 4-30-20 iss. 6-20-20 https://tinyurl.com/yak25nco (Cash 4-30-20=$36.3mm)
 Period      Halozyme Gilead Acumen IGM  Coherus ADC-Ther. Others
 FYE  4-30-14    91%                                          8%
 FYE  4-30-15    79%                                          9%
 FYE  4-30-16    69%                        26%               5%
 FYE  4-30-17    58%                        16%     26%      16%
 FYE  4-30-18    55%                        22%      9%      14%
 FYE  4-30-19    30%          <10%  <10%    13%     21%      36%
 FYE  4-30-20    28%    24%    11%   11%    10%    <10%      --
Link to CC (4:30ET, 1:30PT): https://edge.media-server.com/mmc/p/bt2399kr
6-30-20: Avid Bioservices Reports Financial Results for 4th Quarter FYE April 30, 2020, and Recent Developments
https://www.globenewswire.com/news-release/2020/06/30/2055808/0/en/Avid-Bioservices-Reports-Financial-Results-for-Fourth-Quarter-and-Fiscal-Year-Ended-April-30-2020-and-Recent-Developments.html
-- Appointed Nicholas Green as President and CEO
-- Recorded Fourth Quarter Revenue of $12.6M and Annual Revenue of $59.7M
-- Signed $23M in Business Orders and Achieved Record Backlog of $65M During Q4
-- Project Fiscal 2021 Revenue of $76-$81M
Nick Green 2014 Interview. I LIKE this guy. Seems very down to earth and genuine, with a leadership style based on team power. I assume he’ll be on tomorrow’s CC, though he becomes Avid's CEO eff. 7-30-20.
March 2014: CMO Leadership Awards 2014 - Therapure Biopharma
= = = = = = = = =
Nicholas Green (ex-Therapure Biopharma) becomes President/CEO of Avid Bioservices (eff. 7-30-2020) https://tinyurl.com/yczapcc7
After awhile, you just know who to never look at EB.
6-23-20: Avid Bioservices Names New CEO: Nicholas Green (eff. 7-30-2020)
Avid Bioservices Names Nicholas Green as President and Chief Executive Officer
http://ir.avidbio.com/news-releases/news-release-details/avid-bioservices-names-nicholas-green-president-and-chief
Seasoned Executive Brings More than 30 Years of Pharmaceutical and Healthcare Services Industry Experience to Lead Avid Through Next Phase of Growth and Expansion
TUSTIN, June 23, 2020: Avid Bioservices, Inc. (NASDAQ:CDMO/CMDOP), a dedicated biologics contract development and manufacturing organization (CDMO) working to improve patient lives by providing high quality development and manufacturing services to biotechnology and pharmaceutical companies, today announced that Nicholas Green has been appointed President and CEO, as well as a member of the company’s board of directors, effective July 30, 2020. He will succeed Rick Hancock who has served as interim president and CEO since May 2019. Mr. Hancock will continue to serve on Avid’s board of directors.
Mr. Green has more than 30 years of experience in the global pharmaceutical and healthcare services industry with significant expertise in the contract manufacturing of novel pharmaceutical products. His global pharmaceutical experience spans four continents, having run 31 facilities in nine countries spanning North America, South America, Europe, and Asia. Throughout his career, Mr. Green has held a number of senior management roles for several contract manufacturing organizations and life science companies, where he is credited with successfully building and expanding those businesses and delivering significant value for customers, patients, employees, and other stakeholders.
Joseph Carleone, Ph.D., chairman of the Avid board of directors, said, “On behalf of the Avid board, I’d like to welcome Nick as our new president and CEO. His appointment is the result of a deliberate and comprehensive search for an industry executive capable of leading Avid to achieve its full potential. Nick’s lengthy and impressive career in the pharmaceutical contract development and manufacturing sector, which has included senior leadership roles at several successful companies, positions him perfectly to oversee Avid’s ongoing efforts aimed at customer base expansion and revenue growth. The board and I look forward to the positive impact that Nick will make on the company’s business over both the near and long-term.”
“I am excited to join the Avid team and contribute my industry experience to helping the company continue its impressive growth trajectory,” said Mr. Green. “Today, there is significant and growing demand for companies at the leading edge of contract development and manufacturing services for biologics. With its high-quality offerings in the areas of process development, analytical services, and CGMP manufacturing, combined with its more than 25 years of experience in manufacturing complex biologics, Avid is among the best positioned companies to seize this opportunity.”
“I thoroughly enjoyed my role as the interim president and CEO of Avid and am proud of what the company has achieved during that time in diversifying our client base and increasing revenues,” said Rick Hancock. “I believe that Avid is well positioned to execute successfully on its growth strategy moving forward and the addition of a leader such as Nick will only serve to strengthen the company’s prospects. The appointment of someone of Nick’s caliber, combined with the strength and talents of the entire Avid team, make it easy for me to step aside and transition back into the sole role of board member at this time. I would like to express deep gratitude to all Avid team members for their commitment and hard work during my tenure.”
Mr. Green most recently served as president and CEO of Therapure Biopharma [ https://www.therapurebio.com/ ], a Canada-based biopharmaceutical company which includes Therapure Biomanufacturing. In this role, he oversaw the growth of the company’s CDMO business, while also leading the creation of Therapure’s proprietary plasma protein business, named Evolve. Prior to Therapure, he held a number of senior management roles, most notably managing director of Nipa Laboratories Ltd., head of the life science division of Clariant International Ltd. in the USA, president and CEO of Rhodia Pharma Solutions Ltd. and president of Codexis, Inc.’s pharma division. Mr. Green holds a bachelor’s degree in chemistry from Queen Mary College in London and an MBA from the University of Huddersfield.
= = = = = = = =
6-23-20/OCBJ: Avid Bioservices Names New CEO: Nicholas Green

Tustin-based Avid Bioservices Inc. (Nasdaq: CDMO) appointed Nicholas Green as its new CEO effective, July 30th.
Green will succeed Rick Hancock who served as interim CEO since May 2019; Hancock will remain on the board of directors following the change of leadership.
"I thoroughly enjoyed my role as the interim president and CEO of Avid and am proud of what the company has achieved," Hancock said in a press release.
Green recently served as President & CEO of Canada-based Therapure Biopharma. Prior to that, he was managing director of Nipa Laboratories Ltd., and headed the life science division of Clariant International Ltd. in the USA as well as served as President & CEO of Rhodia Pharma Solutions Ltd.
Avid is a dedicated CDMO specializing in biopharmaceuticals. The company had a $311M market cap at press time and was trading at $5.62/sh.
https://www.ocbj.com/news/2020/jun/23/avid-bioservices-names-new-ceo/
I think EarningsWhispers is complete and utter nonsense on earnings dates. I never remember them being anything close to right.
May19/5pm: “At least 63 public-companies have returned PPP-Loans worth about $510 million as of Tuesday afternoon.”
https://www.morningstar.com/news/marketwatch/20200519575/as-deadline-passes-for-returning-small-business-loans-public-companies-have-given-back-500-million-and-kept-900-million
Well, they’ve got The EXPERTISE...
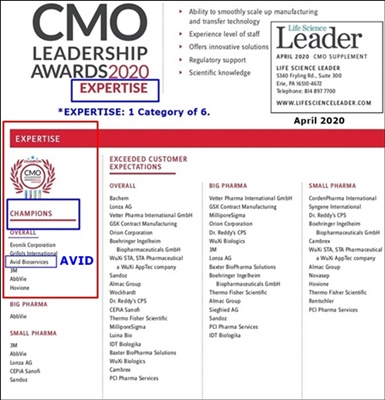
5-18-20: Avid Listed In Top CMO Awards Article https://tinyurl.com/yb5cnh6m
11 TOP CMO’s LISTED (with short descriptions):
3M, Abbvie, Boehringer’s Ingelheim, Grifols, Lonza, Millipore Sigma, Vetter, Wuxi Biologics, Avid Bioservices, Fujifilm Diosynth Biotechnologies, Samsung Biologics
...The 1st 8 rec. All 6 Awards; the last 3 (Avid/Diosynth/Samsung) rec. 5 of 6 Awards.
AVID BIOSERVICES
Avid Bioservices received recognition in 5 CMO Leadership Awards categories, including 2 Champion designations in both Expertise & Service. The contract manufacturer is critical in the supply chain for the pharmaceutical industry and it is maintaining a high level of safety and quality to continue development and providing manufacturing services to its customers during the COVID-19 pandemic.
5-18-20: Avid Listed In Top CMO Awards Article
5-18-20: Top Awarded Biopharmaceutical Companies Responding to COVID-19
By: Healthcare Business Today Team
Since 2011, Life Science Leader & Outsourced Pharma have been recognizing the leaders of top contract manufacturing organizations (CMOs) through individual customer feedback. The resulting CMO Leadership Awards represent the highest level of achievement as evaluated and determined by actual customers. Only those customers that have worked with the CMO on an outsourced project for at least 18 months are able to provide an evaluation…
...With the recent COVID-19 outbreak, the biotechnology industry is feeling the pressure to create and manufacture effective treatments and vaccines to combat the virus.
The 2020 CMO Leadership Awards evaluated more than 125 contract manufacturers on 23 different performance metrics. The awards were given at an interesting time this year as biopharma and CMOs step up their efforts to combat the COVID-19 crisis.
Below, we look at the biopharmaceutical companies that came out on top in the 2020 CMO Leadership Awards, and how they are rising to face the challenge of fighting COVID-19.
11 Companies were listed, incl AVID.
The 1st 8 rec. All 6 Awards.
The last 3 (Avid/Diosynth/Samsung) rec. 5 of 6 Awards.
I don’t know if this is truly the Top 11 of all 125 CMO’s evaluated or if we paid to make this top list in this article. If the former, very good industry recognition.
TOP CMO’s LISTED (with short descriptions):
3M, Abbvie, Boehringer’s Ingelheim, Grifols, Lonza, Millipore Sigma, Vetter, Wuxi Biologics, Avid Bioservices, Fujifilm Diosynth Biotechnologies, Samsung Biologics,
AVID BIOSERVICES
Avid Bioservices received recognition in 5 CMO Leadership Awards categories, including 2 Champion designations in both Expertise & Service. The contract manufacturer is critical in the supply chain for the pharmaceutical industry and it is maintaining a high level of safety and quality to continue development and providing manufacturing services to its customers during the COVID-19 pandemic.
The CMO Leadership Awards are the most meaningful in the drug development and manufacturing outsourcing industry. The organizations on this list are only a handful of those who received awards. In addition, these are just a few of the companies tackling the COVID-19 crisis. With many opportunities on the horizon, it is only a matter of time that the combined efforts produce positive results for our world health.
https://www.healthcarebusinesstoday.com/top-awarded-biopharmaceutical-companies-responding-to-covid-19/
= = = = =
Here is a 55pg. PDF of All the 2020 CMO Leadership Awards:
https://www.qgdigitalpublishing.com/publication/?i=652719
The EXPERTISE CATEGORY (1 of 6 categories).
...Avid makes the overall champions list with 5 other CMO’s:

3-10-20 Qtly CC-Transcript, PR(Q3FY20/qe1-31-20), Avid Revs History Table
*Revs Guidance (FY’20 fye 4-30-20): $55-59M. 10-31-19 Backlog=$58M
*Cash: 1-31-20: $30.7M
*As of 11-30-19: 56,338,143 shares o/s.
*10Q/1-31-20 iss. 3-10-20: https://tinyurl.com/vkocrsg
*Avid Total Revs May03-Jan20: $396.1M
*Avid’s website: https://avidbio.com (A/o 4-30-19, 211 full-time & 4 part-time emps)
This large post has 4 sections:
I. 3-10-20 Qtly. Earnings Conf. Call TRANSCRIPT (FY20/Q3 q/e 1-31-20)
II. 3-10-20 CDMO Press Release: Q3/FY20 Earnings & Developments
IV. Updated Table of Avid Revenues By Quarter (May’06-Current)
III. Updated O/S Shares History Table – 2006-curr.
…Recall: Avid’s FY runs May-Apr, so FY’20 = May’19-Apr’20.
GO HERE (I messed up the Stickies – sorry)...
https://investorshub.advfn.com/boards/read_msg.aspx?message_id=154286734
Total INST.+LARGE Holdings now 36,882,771 65.3% (3-31-20)
Down from 40,237,198 71.4% at 12-31-19 (assuming 2.6M Ronin shares sold – see below).
28,296,779 50.1% INSTITUTIONS (a/o 3-31-20)
https://www.nasdaq.com/symbol/cdmo/institutional-holdings
+ 8,585,992 15.2% LARGE SHAREHOLDERS via Forms13/14 (EasternCap/Dart, Tappan) – ie, not in Nasdaq Inst. List.
------------
= 36,882,771 65.3%
1. I’m not sure about Eastern Cap(K.Dart): no updates since 12-2017, assume NO CHG.
2. Also assuming that a/o 3-20-2020, Ronin(Stafford/Farley) has no ownership (they owned 2,638,450 4.7% a/o 4-17-18 13D https://tinyurl.com/ycf7d2uk ): 3-20-20 https://www.pionline.com/trading/ronin-capital-assets-auctioned (“CME Group auctioned off Ronin’s portfolios in March”. Maybe whoever bought Ronin’s portfolio still owns the 2,638,450 shares of CDMO? See RONIN NOTE AT BOTTOM. So strange.)
Note: Ownership %’s based on 56,482,154 common O/S at 3-2-20 (10Q: https://tinyurl.com/vkocrsg )
11 LARGEST SHAREHOLDERS:
1. IsZo Capital Mgt. (Brian Sheehy): 5,645,701 10.0% (+1,425,553 a/o 3-31-20 Nasdaq Inst.)
2. Eastern Capital (Kenneth Dart): 4,300,992 7.6% (a/o 12-7-17 14A: https://tinyurl.com/y7qprpg9 acq. 10-2015)
3. Tappan Street (Prasad Phatak): 4,285,000 7.6% (a/o 12-31-19 13G: https://tinyurl.com/wlcwnnv )
4. Blackrock Inc. (Larry Fink): 3,881,521 6.9% (-52,910 a/o 3-31-20 Nasdaq Inst.)
5. Vanguard Group 2,638,045 4.7% (+57,499 q/e 3-31-20 Nasdaq Inst.)
6. Snyder Capital 2,280,905 4.0% (+98,519 a/o 3-31-20 Nasdaq Inst.)
7. Altravue Capital 1,950,355 3.5% (-261,087 a/o 3-31-20 Nasdaq Inst.)
8. Sargent Invest. Grp. 1,165,997 2.1% (+204,415 a/o 3-31-20 Nasdaq Inst.)
9. State Street 1,038,673 1.8% (-21,871 a/o 3-31-20 Nasdaq Inst.)
10. Geode Capital 740,689 1.3% 42,493 (+42,493 a/o 3-31-20 Nasdaq Inst.)
11. Silvercrest Asset Mgt. 736,143 1.3% (+173,411 a/o 3-31-20 Nasdaq Inst.)
BIGGEST DROPS q/e 3-31-20:
Millennium -330,454 to 700,169
Two Sigma Investments -269,192 Sold Out
Oxford Asset Mgt. -264,077 Sold Out
Altravue Capital -261,087 to 1,950,355
= = = = = = = = = = = =
Shares O/S as of 3-2-20=56,482,154 - history since 4-2006: https://tinyurl.com/s9cmzmf
...A/O 1-31-20: 2,941,000 stock options outstanding at a wgt.avg. exercise price of $6.45 (pg.15 10Q).
3-10-20: Qtly. Conf. Call (Hancock/Hart/Compton) PR & Transcript https://tinyurl.com/s9cmzmf
4-30-20: “Ronin’s Collapse: The Mysterious Disappearance of a Chicago Trading Giant - Puzzling Losses, a Closely Guarded Auction and Possible Redemption”
By Costas Mourselas @CostasMourselas
More than a month after Ronin Capital’s portfolios were seized and sold off by clearing houses, much about the affair remains unknown, including the source of the firm’s losses and the results of the auction at CME. It’s not just observers that are in the dark. Risk.net understands Ronin’s management team is still waiting to find out what happened in the auction – information that could ultimately help determine whether the famed Chicago prop trader has some kind of future.
https://www.risk.net/risk-management/7535981/the-mysterious-disappearance-of-a-chicago-trading-giant
No problem EB. A lot quotes & news services have mixed up “Avid Systems” and “Avid Technologies” with us at various times over the years. Very frustrating when it happens.
ArchieK, you posted Wainwright 11=>9 back on March 12th, right after the 3-10-2020/Q3 Earnings/CC.
https://investorshub.advfn.com/boards/read_msg.aspx?message_id=154307711
I wonder if this one got mixed-up w/Avid?
3-12-20: Stifel Initiates Coverage on Avadel Pharmaceuticals (AVDL) with Buy, $14 Price Target. The 14 target sounds way out of range for new coverage of CDMO to me.
Is it still there, Eb0783?
3-10-20 Qtly CC-Transcript, PR(Q3FY20/qe1-31-20), Avid Revs History Table
*Revs Guidance (FY’20 fye 4-30-20): $55-59M. 10-31-19 Backlog=$58M
*Cash: 1-31-20: $30.7M
*As of 11-30-19: 56,338,143 shares o/s.
*10Q/1-31-20 iss. 3-10-20: https://tinyurl.com/vkocrsg
*Avid Total Revs May03-Jan20: $396.1M
*Avid’s website: https://avidbio.com (A/o 4-30-19, 211 full-time & 4 part-time emps)
This large post has 4 sections:
I. 3-10-20 Qtly. Earnings Conf. Call TRANSCRIPT (FY20/Q3 q/e 1-31-20)
II. 3-10-20 CDMO Press Release: Q3/FY20 Earnings & Developments
IV. Updated Table of Avid Revenues By Quarter (May’06-Current)
III. Updated O/S Shares History Table – 2006-curr.
…Recall: Avid’s FY runs May-Apr, so FY’20 = May’19-Apr’20.
TRANSCRIPT 3-10-20 FY20/Q3 Earnings Conf. Call (q/e 1-31-20):
Rick Hancock(Interim CEO), Daniel Hart(CFO), Tim Compton(CCO)
Q&A Analysts:
Matt Hewitt - Craig-Hallum Capital
Jacob Johnson - Stephens
Paul Knight - Janney Montgomery Scott
Joe Munda - First Analysis
READ the CC Transcript here:
https://www.fool.com/earnings/call-transcripts/2020/03/10/avid-bioservices-inc-cdmo-q3-2020-earnings-call-tr.aspx
Link to webcast replay: http://ir.avidbio.com/events-and-presentations => https://edge.media-server.com/mmc/p/vvmbx7ze
= = = = = = = = = = = = = = = = = = = = = = = = = = = = = == = = =
3-10-20: Avid Bioservices Reports Financial Results for 3rd Quarter FY 2020 (1-31-20) and Recent Developments
http://ir.avidbio.com/news-releases/news-release-details/avid-bioservices-reports-financial-results-third-quarter-1
-- Recorded Third Quarter Revenue of $13.6 Million
-- Signed New Customer and Project Expansion Orders with Current Customers for $20 Million
-- Adjusting Fiscal 2020 Projected Revenue to $55-59 Million
TUSTIN, March 10, 2020: Avid Bioservices, Inc. (NASDAQ:CDMO/:CDMOP), a dedicated biologics contract development and manufacturing organization (CDMO) working to improve patient lives by providing high quality development and manufacturing services to biotechnology and pharmaceutical companies, today announced financial results for the third quarter and first nine months of fiscal 2020 ended January 31, 2020.
HIGHLIGHTS SINCE OCTOBER 31, 2019
“During the third quarter of 2020, Avid strengthened both its project pipeline and backlog, and the fundamentals of the business remained strong,” said Rick Hancock, interim President and CEO of Avid. “However, the company faced production challenges during the period related to a problem with a specific piece of equipment which resulted in the termination of in-process manufacturing runs, and the postponement of several other manufacturing runs scheduled to commence during the third quarter. Though we are now implementing the necessary corrections, the temporary production interruption resulted in lower revenue and profits for the third quarter, and we expect it to also impact revenues and profits for the fourth quarter of fiscal 2020. For this reason, we are adjusting our revenue guidance for fiscal 2020 to $55-59 million vs. our prior guidance of $64-$67 million. It is our expectation that this problem will be behind us soon, and as such, we anticipate that the impact will be contained to fiscal 2020. While we are disappointed that this temporary operational setback will negatively impact our fiscal 2020 results, we anticipate that we will be able to recover those revenues in fiscal 2021. We remain optimistic about Avid’s growth potential. Critical to achieving this growth is the continued expansion of Avid’s customer and project base. To lead this effort, we recently welcomed Timothy Compton to the Avid team as our chief commercial officer. During the third quarter, Tim launched the first phase of an aggressive business development campaign. As a result, we signed agreements to add one new customer and multiple additional manufacturing campaigns with existing customers during the period. With respect to operations, we continue to make progress on projects to optimize our existing Myford facility while finalizing plans for its future expansion. We will continue to update you moving forward as these plans progress.”
FINANCIAL HIGHLIGHTS AND GUIDANCE
* The company is adjusting revenue guidance for the full fiscal year 2020 to $55-59 million from prior full fiscal year 2020 guidance of $64-67 million.
* Revenue was $13.6 million for the third quarter of fiscal 2020, consistent with $13.8 million for the third quarter of last fiscal year. For the nine months ended January 31, 2020, revenues were $47.2 million, a 29% increase as compared to revenues of $36.5 million during the same prior year period. The slight decrease during the third quarter of fiscal 2020 can primarily be attributed to a decrease in process development revenue, combined with the impact of the production interruption described above, which were largely offset by an increase in the number of in-process and completed manufacturing runs conducted during the quarter compared to the same prior year quarter. Likewise, the increase during the first nine months of fiscal 2020 was primarily due to an increase in the number of in-process and completed manufacturing runs, a result of growing demand from a more diverse client base, partially offset by a decrease in process development revenue and the third quarter production interruption.
* As of January 31, 2020, revenue backlog was approximately $58 million, an increase of 12% compared to the second quarter of fiscal 2020. The company expects to recognize the majority of this backlog within the next 12 months.
* Gross margin for the third quarter of fiscal 2020 was 6%, a decrease compared to the 15% gross margin for the third quarter of fiscal 2019. The decrease in gross margin for the quarter was primarily attributed to the costs associated with the aforementioned production interruption, an increase in depreciation expense from the acquisition of new equipment, and a net decrease in revenues. Gross margin for the nine months ended January 31, 2020 was 11%, up slightly compared to 10% in the prior year period. This increase was primarily due to an increase in manufacturing runs, partially offset by costs associated with payroll and related costs, higher facility and equipment related costs primarily associated with the production interruption described above, increased depreciation expense from the acquisition of new equipment, and general equipment repairs and maintenance costs.
* Selling, general and administrative expenses (“SG&A”) for the third quarter of fiscal 2020 were $3.0 million, a decrease of 8% compared to $3.2 million for the third quarter of fiscal 2019. This decrease was primarily due to a decrease in accrued bonuses for fiscal 2020, partially offset by an increase in employee separation costs. For the first nine months of fiscal 2020, SG&A expenses were $11.0 million, an 19% increase compared to $9.3 million for the first nine months of fiscal 2019. The increase in SG&A was primarily attributed to employee separation-related expenses and increased stock-based compensation. When excluding the separation-related expenses, SG&A increased by 10% during the first nine months of fiscal 2020 as compared to the prior year.
* For the third quarter of fiscal 2020, the company recorded a consolidated net loss attributable to common stockholders of $3.5 million or $.06 per share, compared to a consolidated net loss attributable to common stockholders of $2.6 million or $.05 per share, for the third quarter of fiscal 2019. For the first nine months of fiscal 2020, the company recorded a consolidated net loss attributable to common stockholders of $9.3 million or $.17 per share, compared to a consolidated net loss attributable to common stockholders of $8.2 million or $.15 per share, for the first nine months of fiscal 2019.
* Avid reported $30.7 million in cash and cash equivalents as of January 31, 2020, compared to $32.4 million on April 30, 2019.
More detailed financial information and analysis may be found in Avid Bioservices’ Quarterly Report on Form 10-Q, which will be filed with the SEC today. [ https://tinyurl.com/vkocrsg ]
RECENT CORPORATE DEVELOPMENTS
* Appointed Timothy (Tim) Compton as chief commercial officer. Mr. Compton has extensive experience in commercial operations, including sales team management, business development, marketing and corporate development. In his new role, he will be responsible for driving the continued growth of Avid’s CDMO business, including the ongoing expansion of the company’s commercial and clinical client base.
* Expanded our customer base with the addition of one new customer and executed multiple project expansion orders with existing customers representing additional revenue backlog of $20 million during the third quarter.
* Advanced planning and design to both enhance our Myford facility, and support its future expansion. These near-term improvements include installing a pharmaceutical grade water system, and upgrading key IT systems and general infrastructure. We expect the installation and validation of the water system to take place in late calendar year 2020 and the IT system enhancements and general infrastructure upgrades to be complete by the end of fiscal 2021.
CONFERENCE CALL
Avid will host a conference call and webcast this afternoon, March 10, 2020, at 4:30 PM EDT (1:30 PM PDT). To listen to the conference call, please dial (877) 312-5443 or (253) 237-1126 and request the Avid Bioservices conference call. To listen to the live webcast, or access the archived webcast, please visit: http://ir.avidbio.com/events.cfm .
ABOUT AVID BIOSERVICES, INC.
Avid Bioservices is a dedicated contract development and manufacturing organization (CDMO) focused on development and CGMP manufacturing of biopharmaceutical products derived from mammalian cell culture. The company provides a comprehensive range of process development, high quality CGMP clinical and commercial manufacturing services for the biotechnology and biopharmaceutical industries. With 25 years of experience producing monoclonal antibodies and recombinant proteins in batch, fed-batch and perfusion modes, Avid's services include CGMP clinical and commercial product manufacturing, purification, bulk packaging, stability testing and regulatory strategy, submission and support. The company also provides a variety of process development activities, including cell line development and optimization, cell culture and feed optimization, analytical methods development and product characterization. https://www.avidbio.com
Forward-Looking *snip*
AVID BIOSERVICES, INC.
?CONDENSED CONSOLIDATED STATEMENTS OF OPERATIONS AND COMPREHENSIVE LOSS
(Unaudited)(In thousands, except per share information)
Three Months Ended
January 31,
Nine Months Ended
January 31,
2020 2019 2020 2019
Revenues $ 13,585 $ 13,781 $ 47,152 $ 36,548
Cost of revenues 12,800 11,731 41,921 32,972
Gross profit 785 2,050 5,231 3,576
Operating expenses:
Selling, general and administrative 2,996 3,242 10,989 9,273
Loss on lease termination — — 355 —
Total operating expenses 2,996 3,242 11,344 9,273
Operating loss (2,211 ) (1,192 ) (6,113 ) (5,697 )
Interest and other income, net 107 9 415 190
Loss from continuing operations before income taxes (2,104 ) (1,183 ) (5,698 ) (5,507 )
Income tax benefit — 44 — 217
Loss from continuing operations, net of tax (2,104 ) (1,139 ) (5,698 ) (5,290 )
Income from discontinued operations, net of tax — — — 739
Net loss $ (2,104 ) $ (1,139 ) $ (5,698 ) $ (4,551 )
Comprehensive loss $ (2,104 ) $ (1,139 ) $ (5,698 ) $ (4,551 )
Series E preferred stock accumulated dividends (1,442 ) (1,442 ) (3,604 ) (3,604 )
Net loss attributable to common stockholders $ (3,546 ) $ (2,581 ) $ (9,302 ) $ (8,155 )
Basic and diluted net (loss) income per common share attributable to common stockholders:
Continuing operations $ (0.06 ) $ (0.05 ) $ (0.17 ) $ (0.16 )
Discontinued operations — — — 0.01
Net loss per share attributable to common stockholders $ (0.06 ) $ (0.05 ) $ (0.17 ) $ (0.15 )
Weighted average basic and diluted shares outstanding 56,404 56,069 56,275 55,949
AVID BIOSERVICES, INC.
CONDENSED CONSOLIDATED BALANCE SHEETS
(Unaudited)(In thousands, except par value)
January 31,
2020 April 30,
2019
ASSETS
Current assets:
Cash and cash equivalents $ 30,687 $ 32,351
Accounts receivable 10,151 7,374
Contract assets 6,111 4,327
Inventory 9,565 6,557
Prepaid expenses and other current assets 763 709
Total current assets 57,277 51,318
Property and equipment, net 26,850 25,625
Operating lease right-of-use assets 20,437 —
Restricted cash 350 1,150
Other assets 302 302
Total assets $ 105,216 $ 78,395
LIABILITIES AND STOCKHOLDERS’ EQUITY
Current liabilities:
Accounts payable $ 5,332 $ 4,352
Accrued payroll and related costs 2,985 3,540
Contract liabilities 26,355 14,651
Operating lease liabilities 1,172 —
Other current liabilities 710 619
Total current liabilities 36,554 23,162
Operating lease liabilities, less current portion 21,584 —
Deferred rent, less current portion — 2,072
Other long-term liabilities — 93
Total liabilities 58,138 25,327
Commitments and contingencies
Stockholders’ equity:
Preferred stock, $0.001 par value; 5,000 shares authorized;
1,648 shares issued and outstanding at January 31, 2020 and April 30, 2019, respectively 2 2
Common stock, $0.001 par value; 150,000 shares authorized;
56,479 and 56,136 shares issued and outstanding at January 31, 2020 and April 30, 2019, respectively 56 56
Additional paid-in capital 613,323 613,615
Accumulated deficit (566,303 ) (560,605 )
Total stockholders’ equity 47,078 53,068
Total liabilities and stockholders’ equity $ 105,216 $ 78,395
CONTACTS:
• Stephanie Diaz (Investors) Vida Strategic Partners 415-675-7401 sdiaz@vidasp.com
• Tim Brons (Media) Vida Strategic Partners 415-675-7402 tbrons@vidasp.com
- - - - - - - -
From 10-Q header: “As of Mar 2, 2020, there were 56,482,154 shares outstanding.”
- - - - - - - - - - - - - - - - -
Latest 10K 4-30-19 iss. 6-27-19 http://tinyurl.com/yxukx6t4 (Cash 4-30-19=$32.4mm)
Latest 10Q 1-31-20 iss. 3-10-20 https://tinyurl.com/vkocrsg (Cash 1-31-20=$30.7mm)
ALL SEC filings for PPHM: http://tinyurl.com/6d4jw8
10-K: “As of 4-30-19, we employed 211 full-time & 4 part-time emps.” (2018: 185/1)
= = = = = = = = = = = = = = = = = = = = = = = = = = = =
Updated PPHM REVS-BY-QTR TABLE, now thru FY20Q3(qe 1-31-20), per the 10Q issued 3-10-20.
• Total Avid Revs since May’03: $396.1M
• 3-10-20: FY'20 (May'19-Apr'20) Avid revs guidance $55-59M (committed B/L=$58 at 1-31-20).
• Inventories at 1-31-20 total $9.6M, UP from $7.8M at 1-31-20.
Avid’s website: http://www.avidbio.com
 AVID GROSS PROFITABILITY BY QTR:                   CONTRACT
 QTR  (1000’s)      Rev$  COGS$  Prof$  GP% INVEN$ LIABILITIES*
 FY13Q1  7-31-12   4,135  2,024  2,111  51%  5,744   16,280
 FY13Q2 10-31-12   6,061  3,703  2,358  39%  5,426   14,721
 FY13Q3  1-31-13   6,961  3,651  3,310  47%  4,635   11,790
 FY13Q4  4-30-13   4,176  3,217    959  23%  4,339   12,230
 FY14Q1  7-31-13   4,581  2,670  1,911  42%  5,679   12,692
 FY14Q2 10-31-13   7,354  4,195  3,159  43%  4,033   11,126
 FY14Q3  1-31-14   3,885  2,416  1,469  38%  5,224   12,975
 FY14Q4  4-30-14   6,474  3,829  2,645  41%  5,530   11,001
 FY15Q1  7-31-14   5,496  3,583  1,913  35%  5,998   10,896
 FY15Q2 10-31-14   6,263  4,139  2,124  34%  5,379   11,161
 FY15Q3  1-31-15   5,677  3,113  2,564  45%  6,148   14,063
 FY15Q4  4-30-15   9,308  4,758  4,550  49%  7,354   17,993
 FY16Q1  7-31-15   9,379  4,608  4,771  51% 10,457   17,890
 FY16Q2 10-31-15   9,523  4,741  4,782  50% 12,554   24,623
 FY16Q3  1-31-16   6,672  3,896  2,776  42% 15,189   37,851
 FY16Q4  4-30-16  18,783  9,721  9,062  48% 15,189   39,630
 FY17Q1  7-31-16   5,609  3,062  2,547  45% 25,274   43,262
 FY17Q2 10-31-16  23,370 15,441  7,929  34% 25,924   44,908
 FY17Q3  1-31-17  10,747  7,974  2,773  26% 33,829   52,577
 FY17Q4  4-30-17  17,904 11,782  6,122  34% 33,099   45,517
 FY18Q1  7-31-17  27,077 20,448  6,629  24% 24,235   27,755
 FY18Q2 10-31-17  12,782 16,242 -3,460 -27% 16,518   20,611
 FY18Q3  1-31-18   6,819 10,951 -4,132 -61% 14,218   24,235
 FY18Q4  4-30-18   6,943  8,904 -1,961 -28% 16,129   27,935
 FY19Q1  7-31-18  12,589 11,397  1,192   9%  9,168   17,994
 FY19Q2 10-31-18  10,178  9,844    334   3%  9,736   17,307
 FY19Q3  1-31-19  13,781 11,731  2,050  15%  8,660   14,620
 FY19Q4  4-30-19  17,055 13,407  3,648  21%  6,557   14,651
 FY20Q1  7-31-19  15,254 14,168  1,086   7%  8,031   18,104
 FY20Q2 10-31-19  18,313 14,953  3,360  18%  7,809   22,199
 FY20Q2  1-31-20  13,585 12,800    785   6%  9,565   26,355
 *7-31-18 10Q: “prior-yr amts related to (deferred revenue
 + cust deposits) now reclass’d as contract liabilities.”

 FY13 TOTAL:      21,333 12,595  8,738  41%*
 FY14 TOTAL:      22,294 13,110  9,184  41%*
 FY15 TOTAL:      26,744 15,393 11,151  42%*
 FY16 TOTAL:      44,357 22,966 21,391  48%*
 FY17 TOTAL:      57,630 38,259 19,371  34%*
 FY18 TOTAL:      53,621 56,545 -2,924  -5%*
 FY19 TOTAL:      53,603 46,379  7,224  13%*
 *Avid Net-Profit(Selling/G&A) not split out from PPHM-Corp. in the fin’s.

 AVID TOTAL REV’s BY YEAR):
 FY04 4-30-04   3,039 (Avid-Revs didn’t incl. Avid’s Gov’t work)
 FY05 4-30-05   4,684
 FY06 4-30-06   3,005
 FY07 4-30-07   3,492
 FY08 4-30-08   5,897
 FY09 4-30-09  12,963
 FY10 4-30-10  13,204
 FY11 4-30-11   8,502
 FY12 4-30-12  14,783
 FY13 4-30-13  21,333
 FY14 4-30-14  22,294
 FY15 4-30-15  26,744
 FY16 4-30-16  44,357
 FY17 4-30-17  57,630
 FY18 4-30-18  53,621
 FY19 4-30-19  53,603
 FY20 4-30-20  47,152 <=thru Q3 1-31-20
 **TOTAL:     396,121 (5/1/2003–1/31/20)
 .
 QTLY. NET PROFIT/LOSS BY QTR:
 (“attributable to common stockholders”; ie, incl. PREF Div’s**)
 **2-11-14: PPHM Raises $16.2M, 700k Pref. Shares w/10.5% DIV.
 FY16Q1  7-31-15 -15,101,000
 FY16Q2 10-31-15 -14,578,000
 FY16Q3  1-31-16 -18,227,000
 FY16Q4  4-30-16 -13,264,000
 FY17Q1  7-31-16 -12,437,000
 FY17Q2 10-31-16  -4,498,000
 FY17Q3  1-31-17  -9,216,000
 FY17Q4  4-30-17  -6,714,000
 FY18Q1  7-31-17  -2,647,000
 FY18Q2 10-31-17 -14,066,000
 FY18Q3  1-31-18 -12,446,000
 FY18Q4  4-30-18  +1,578,000 <=includes $9,154,000 income from disc. operations.
 FY19Q1  7-31-18  -3,403,000
 FY19Q2 10-31-18  -2,893,000
 FY19Q3  1-31-19  -2,581,000
 FY19Q4  4-30-19  -1,106,000
 FY20Q1  7-31-19  -4,606,000
 FY20Q2 10-31-19  -1,872,000
 FY20Q3  1-31-20  -3,546,000

 Period        Halozyme ADC-Therap. Coherus-BioSci. Other-Custs
 FYE  4-30-14     91%                                    8%
 FYE  4-30-15     79%                                    9%
 FYE  4-30-16     69%                     26%            5%
 FYE  4-30-17     58%                     26%           16%
 FYE  4-30-18     55%      9%             22%           14%
 FYE  4-30-19     30%     21%             13%           36%
 ...(cust. splits not given in 7-31-18+ 10Q’s)
Total INST.+LARGE Holdings now 40,237,198 71.4% (12-31-19)
Up from 37,448,204 66.6% at 9-30-19.
29,012,756 51.5% INSTITUTIONS (a/o 12-31-19)
https://www.nasdaq.com/symbol/cdmo/institutional-holdings
+ 11,224,442 19.9% LARGE SHAREHOLDERS via Forms13/14 (Tappan, EasternCap/Dart, Ronin/Stafford) – ie, not in Nasdaq Inst. List.
I’m not sure about Eastern Cap(K.Dart) and Ronin(Stafford/Farley) - no updates since 12-2017 & 4-2018 respectively. I’m assuming that means NO CHG.
------------
= 40,237,198 71.4%
Note: Ownership %’s based on 56,338,143 common O/S at 11-30-19 (10Q: https://tinyurl.com/v37mgjk )
11 LARGEST SHAREHOLDERS:
1. Eastern Capital (Kenneth Dart): 4,300,992 7.6% (a/o 12-7-17 14A: https://tinyurl.com/y7qprpg9 acq. 10-2015)
2. Tappan Street (Prasad Phatak): 4,285,000 7.6% (-569,100 a/o 12-31-19 13G: https://tinyurl.com/wlcwnnv )
3. IsZo Capital Mgt. (Brian Sheehy): 4,220,148 7.5% (-314,546 a/o 2-31-19 Nasdaq Inst.)
4. Blackrock Inc. (Larry Fink): 3,934,431 7.0% (+8,905 a/o 12-31-19 Nasdaq Inst.)
5. Ronin Trading (John Stafford III+Roger Farley): 2,638,450 4.7% (a/o 4-17-18 13D: https://tinyurl.com/ycf7d2uk )
6. Vanguard Group 2,580,546 4.6% (-98,873 q/e 12-31-19 Nasdaq Inst.)
7. Altravue Capital 2,211,442 3.9% (-11,940 a/o 12-31-19 Nasdaq Inst.)
8. Snyder Capital 2,182,386 3.9% (-69,667 a/o 12-31-19 Nasdaq Inst.)
9. State Street 1,060,544 1.9% (+32,716 a/o 12-31-19 Nasdaq Inst.)
10. Millennium Mgt. 1,030,623 1.8% (+203,339 a/o 12-31-19 Nasdaq Inst.)
11. Sargent Invest. Grp. 961,582 1.7% (+324,471 a/o 12-31-19 Nasdaq Inst.)
BIGGEST DROPS q/e 12-31-19:
IsZo Capital Mgt. -314,546 to 4,220,148
Vanguard Group -98,873 to 2,580,546
= = = = = = = = = = = =
Shares O/S as of 11-30-19=56,338,143 - history since 4-2006: https://tinyurl.com/tfewuzc
...A/O 10-31-19: 3,552,000 stock options outstanding at a wgt.avg. exercise price of $7.57 (pg.14 10Q).
12-9-19: Qtly. Conf. Call (Hancock/Hart/Kinjerski) PR & Transcript https://tinyurl.com/tfewuzc
Tappen+IsZO 13G’s: Both dropped a little a/o 12-31-19 quarter...
9 LARGEST SHAREHOLDERS:
1. Tappan Street (Prasad Phatak): 4,285,000 7.6% (-569,100 a/o 12-31-19 13G: https://tinyurl.com/wlcwnnv )
2. IsZo Capital Mgt. (Brian Sheehy): 4,220,148 7.4% (-314,546 a/o 12-31-19 13G: https://tinyurl.com/wfnhv7h )
Blackrock 13G a/o 12-31-19: 3,934,431(7.0%), up slightly (+8,905) from 9-30-19 Nasdaq Inst. figure:
2-4-2020/13G BlackRock (Larry Fink): https://tinyurl.com/uukaedp
A/o 12-31-19: Aggregate amt. beneficially owned: 3,934,431
%Class: 7.0%
= = = = = =
9-31-19 Nasdaq INST/BLACKROCK INC: 3,925,526
https://www.nasdaq.com/market-activity/stocks/cdmo/institutional-holdings
9 LARGEST SHAREHOLDERS a/o 9-30-19:
1. Tappan Street (Prasad Phatak): 4,854,100 8.6% (+337,993 a/o 12-31-18 13G: http://tinyurl.com/yxrpla3b )
2. IsZo Capital Mgt. (Brian Sheehy): 4,534,694 8.1% (-243,429 a/o 9-30-19 Nasdaq Inst.)
3. Eastern Capital (Kenneth Dart): 4,300,992 7.6% (a/o 12-7-17 14A: https://tinyurl.com/y7qprpg9 acq. 10-2015)
4. Blackrock Inc. (Larry Fink): 3,925,526 7.0% (+135,240 q/e 9-30-19 Nasdaq Inst.)
5. Ronin Trading (John Stafford III+Roger Farley): 2,638,450 4.8% (a/o 4-17-18 13D: https://tinyurl.com/ycf7d2uk )
6. Vanguard Group 2,676,002 4.8% (+3,417 q/e 9-30-19 Nasdaq Inst.)
7. Snyder Capital 2,252,053 4.0% (+9,761 a/o 9-30-19 Nasdaq Inst.)
8. Altravue Capital 2,223,382 4.0% (+114,570 a/o 9-30-19 Nasdaq Inst.)
9. State Street 1,027,828 1.8% (+87,955 a/o 9-30-19 Nasdaq Inst.)
Inst. Holdings (Nasdaq) - updated 45-days after each qtr-end: http://www.nasdaq.com/symbol/cdmo/institutional-holdings
Shares O/S as of 11-30-19=56,338,143 - history since 4-2006:
https://tinyurl.com/tfewuzc
...A/O 10-31-19: 3,552,000 stock options outstanding at a wgt.avg. exercise price of $7.57 (pg.14 10Q).
12-9-19 Qtly CC-Transcript, PR(Q2FY20/qe10-31-19), Avid Revs History Table
*Revs Guidance (FY’20 fye 4-30-20): $64-67M. 10-31-19 Backlog=$52M
*Cash: 10-31-19: $34.0M
*As of 11-30-19: 56,338,143 shares o/s.
*10Q/10-31-19 iss. 12-9-19: https://tinyurl.com/v37mgjk
*Avid Total Revs May03-Jul19: $382.5M
*Avid’s website: https://avidbio.com (A/o 4-30-19, 211 full-time & 4 part-time emps)
This large post has 4 sections:
I. 12-9-19 Qtly. Earnings Conf. Call TRANSCRIPT (FY20/Q2 q/e 10-31-19)
II. 12-9-19 CDMO Press Release: Q2/FY20 Earnings & Developments
IV. Updated Table of Avid Revenues By Quarter (May’06-Current)
III. Updated O/S Shares History Table – 2006-curr.
…Recall: Avid’s FY runs May-Apr, so FY’20 = May’19-Apr’20.
((( Orig. transcript from SeekingAlpha.com [https://tinyurl.com/rd75k59 ] with numerous corrections made. )))
Link to webcast replay: http://ir.avidbio.com/events-and-presentations => https://edge.media-server.com/mmc/p/kgzqm8c5
TRANSCRIPT 12-9-19 FY20/Q2 Earnings Conf. Call (q/e 10-31-19) (Hancock/Hart/Kinjerski)
RICK HANCOCK (INTERIM CEO) – OPENING COMMENTS:
Thank you to everyone who has dialed in, and to those who are participating today via webcast. During Q2, increased productivity and efficiency drove positive results across the organization, and I am happy to provide an overview of the progress made during the period. I’ll begin by stating that revenue for Q2 of 2020 was the highest that Avid has recorded in the last two years. In addition, our backlog and other financial metrics were strong during the quarter and Dan will provide more details regarding our financial results in a moment. On the business development front, we continue to have a strong presence in the market with the goal of attracting new business and we’re advancing multiple discussions to expand our scope of work with several current customers. Tracy will provide an update on these activities. We also achieved several important milestones operationally during the quarter that we believe will enhance our services, offerings, and contribute to the continued growth of our business. I'll provide more details on these accomplishments following an overview of our second quarter financial results. With that, I’ll turn the call over to Dan.
DANIEL HART (CFO) – OPENING COMMENTS:
Before I begin, I'd like to recommend that everyone participating on today's call refer to our 10-Q filing with the SEC which we filed today for additional details https://tinyurl.com/v37mgjk . I'll now discuss our financial results for continuing operations for Q2 and the first six months of FY2020 ended October 31, 2019. I'll first address our second quarter results. Revenue for the quarter was considerably better than market estimates at $18.3M, an increase of 80% as compared to $10.2M for the same period of the prior year. This significant increase was primarily the result of an increase in the number of in-process and completed manufacturing runs during the quarter, primarily for our largest customer. Gross margin for Q2 of 2020 was 18%, a significant increase as compared to the 3% gross margin in the prior-year period. The increase in gross margin for the quarter was primarily attributed to revenue from an increased number of manufacturing runs, which was more than enough to offset the unexpected costs incurred at the beginning of our fiscal year. I’ll now address operating expenses. Total SG&A expenses for Q2 of FY2020 were 3.5M compared to 2.8M for Q2 of FY2019. This increase was primarily due to increases in both payroll-related expenses and stock-based compensation. Also during the quarter, we entered into a lease amendment to terminate an operating lease for one of our non-manufacturing facilities that was primarily utilized as warehouse space. As part of our continuing efforts to reduce costs and increase efficiencies, this quarter we successfully consolidated our available warehouse space thereby moving supplies and materials closer to manufacturing, which allowed for the termination of this lease. In connection with the lease termination, we recognized a one-time charge of $355,000. As a result, our future lease and related payments have been reduced by approximately $1.3M over the next four years and the termination freed up $250,000 of restricted cash that was pledged as collateral under a letter of credit required by the lease. The lease termination of this redundant warehouse space has no impact on our future expansion plans as we still have 42,000 square feet available within our Myford facility.
For Q2 of FY2020, the company recorded a consolidated net loss attributable to common stockholders of 1.9M or $.03 a share. This outcome was an improvement compared to a consolidated net loss attributable to common stockholders of 2.9M or $0.05 a share for Q2 of FY2019 exceeding consensus estimates. Our backlog at the end of Q2 of 2020 was $52M, a decrease of 16% compared to the $61M at the end of Q1 2020 and an increase of 13% compared to the 46M at the end of last fiscal year. This quarter-over-quarter decrease resulted from efficiencies that allowed us to increase manufacturing activity by initiating several runs in Q2 that were originally scheduled for a later period and was partially offset by current period bookings. Despite accelerating our production schedule, we continue to maintain a strong backlog, much of which we expect to recognize in FY2020. I’ll now provide an overview of our results for the first six months of FY2020. For the first six months ended October 31, 2019, revenues were 33.6M, a 47% increase as compared to revenues of 22.8M during the prior year period. As is the case with the quarter, the significant increase was primarily the result of continued growth in the number and scope of customer projects. Gross margin for the six months ended October 31, 2019 was 13%, up significantly compared to the 7% in the prior-year period. This increase was primarily due to an increase in manufacturing the customer projects, which was more than enough to offset the step-up in personnel costs required to accommodate growth and production demand, and the realignment of company’s compensation structure to secure our existing workforce that occurred at the beginning of our fiscal year as well as equipment repairs and maintenance costs. For the first six months of FY2020, SG&A expenses were $8M, a 33% increase compared to $6M for the first six months of FY2019. The increase in SG&A was primarily attributable to employee separation-related expenses and increased stock-based compensation. When excluding the separation-related expenses, SG&A increased 19% during the first six months of FY2020 as compared to the prior year. Also included within the first half of FY2020 was the lease termination charge of 355,000 that I mentioned earlier. For the six months of FY2020, the company recorded a consolidated net loss attributable to common stockholders of 6.1M or $.11 per share compared to a consolidated net loss attributable to common stockholders of 5.9M or $.11 per share for the first six months of FY2019. Our cash and cash equivalents at October 31, 2019 were $34M as compared to $32.4M as of the prior fiscal year ended April 30, 2019. Given the strength of our backlog and the visibility we have into current customer projections, we are reaffirming our revenue guidance for FY2020 of $64M to $67M. We are pleased with our financial performance during the quarter. The company continues to approach our near-term milestone of operational breakeven, which we believe will position the company to achieve both industry standard margins and sustainable profitability. This concludes my financial overview. I will now turn the call over to Tracy for an update on business development activities and achievements for the quarter.
TRACY KINJERSKI (VP, BUSINESS OPERATIONS) - OPENING COMMENTS:
As Rick mentioned, during the quarter we continued our efforts in attracting new customers and advancing new business with our existing customers. We continue to focus on increasing the awareness of our services and our strength as an industry leader through technical presentations, webinars and conference participation. During Q2, Avid’s business team continued to execute an aggressive visibility campaign with participation at industry events, including the Bioprocessing Summit in August, Biotech Week in contract pharma in September and World ADC in outsourced pharma in October as well as local industry events. We recently hosted a technical seminar in Cambridge along with industry colleagues. Each of these events gives us access to potential new customers, provides an excellent platform to promote Avid's latest enhancements and accomplishments and the opportunity to provide insight into advancing molecules from concept to market from a CDMO perspective. This quarter we hosted a number of potential new client visits at Avid for technical due-diligence business as well as quality audits, both critical gaining items in the outsourcing process. The feedback we received from customer audits is universally positive. We also continue to prospect for new opportunities across the industry by meeting with potential new clients at their facilities.
I will now address the opportunities represented by the new client prospects mentioned above. First, these new projects are diverse ranging from customers interested in Avid’s development and early phase manufacturing experience to interest in our late phase and commercial experience, including access to the space we have for expansions to meet their future commercial demand. I'm also pleased to announce the forward movement and execution of new business opportunities with our existing clients. We are currently expanding work that will result in the advancement of existing projects to the next phase of manufacturer, progressing molecules from smaller scale manufacturers to our larger 2,000-liter scale in Myford and increasing batch numbers. In an earlier earnings call we announced supporting other clients with their process validation activities. Recent completion of these activities will enable certain clients to submit their biologics license application filings which will trigger the scheduling of future pre-approval inspections estimated to occur within the next two years related to the anticipated approval of these particular molecules. For those products approved during – using processes validated at Avid, the commercial manufacturing will be conducted at Avid. As we have stated previously for this reason we see each process validation completed today as an opportunity to build commercial business in the future. Also during the quarter, we completed multiple other batch manufacturers for earlier phase client molecules. As we announced in early July, Avid signed two new contract manufacturing service agreements to support the development of novel drug candidates. The onboarding of these projects has been completed and they are progressing towards manufacture. The agreements include the addition of one of the world's leading pharmaceutical companies to Avid’s list of customers as well as the expansion of the relationship with one of the company's existing biotechnology customers. All of these opportunities are a result of Avid’s commitment to quality, reliability and collaboration to ensure the success of our clients. It also demonstrates a path to continued growth in our backlog and revenue. I'm pleased with the activity ongoing at Avid with respect to enhancing biopharmaceutical industry's awareness of Avid and our capabilities, including our available 2,000-liter capacity, room for expansion and growth of our pipeline of activity projects and partnership opportunities with new and existing clients. This concludes my business overview.
RICK HANCOCK (CEO) – Q4/FY19 OPERATIONAL & COMMERCIAL UPDATE:
Thank you, Tracy. First, I’d like to welcome Rich Richieri back to the Avid team. As we announced in October, Rich previously spent 15 years with Avid Bioservices and its former parent company Peregrine Pharmaceuticals in the role of Senior VP of Manufacturing. During that time, Rich was instrumental in establishing and growing Avid’s CDMO business and helping the company diversify its production capabilities. He spent the past five years serving as an advisor and acting head of biologics production for Syngene International, a global discovery, development and manufacturing organization serving the pharmaceutical industry. Richard rejoins Avid as Chief Operations Officer with responsibility for overseeing process development, clinical and commercial manufacturing, technical support and facilities. In this role, Rich will be focused on streamlining operations, building internal efficiencies and strategic planning for future growth. In addition, Rich will work with our business development team to optimize every aspect of our customer experience. Given his global CDMO experience combined with his Avid specific expertise, we're very happy to have Rich in this important leadership role. In other leadership matters, we continue our search for a permanent CEO for the company. We are actively screening highly qualified candidates and we look forward to providing an update soon. In the meantime, we continue to grow the business and advance all core objectives. Our team has the expertise required to execute all the company's strategic goals and no projects or programs are being delayed pending the arrival of a new CEO. As a case in point, we were pleased to report that during Q2 we officially launched our expanded process development facility in services at an Open House event attended by customers, prospective customers, vendors and community leaders. This purpose-built state-of-the-art facility which houses Avid's expanded upstream and downstream process development capabilities represents an important new opportunity for the company. It allows us to expand our existing relationships and attract new business by offering support to customers that seek to outsource their PD work. Equally important, this PD capability allows us to expand our scope of services beyond biologics into the diagnostics and general biologics research and development sectors. We are very pleased to officially launch this new lab in service and we believe it will make great contributions to Avid’s continued growth. In other operations news, we have entered into the final design stage for the construction of a new pharmaceutical grade water system in the Myford facility. Installation of this system, which will supply water to multiple manufacturing systems, is a critical step in creating the manufacturing efficiencies required to increase our output and strengthen our margins. As with the rest of our Myford facility, this system will be state-of-the-art and we anticipate installation in calendar 2020. Lastly, during Q2, Avid conducted its annual maintenance overhaul. During these overhauls, certain of our facilities maybe partially or completely shut down so that we can conduct a comprehensive evaluation of our facilities and equipment. Last year, both facilities were down for more than 3 weeks. However, due to the significant amount of work that was done during last year's evaluation, the process with shorter this year with Franklin down for less than two weeks and only a partial shutdown at Myford affecting only the exterior of the building. In light of this shutdown, we are particularly proud of the increase in both revenue and margins during the quarter which we believe reflect an organizational resilience that is rare with larger CDMOs. In closing, I'd like to highlight a few takeaways. Our business development effort continues to be wide reaching and robust. Our reputation in the industry for quality products and regulatory success continues to grow, allowing us to engage with a growing pool of potential new customers. It also allows us to expand our relationships with existing customers providing us with an opportunity to pitch new projects and services. Operationally, we continue to improve and enhance our equipment, facilities and systems. The opening of the new process development lab, the successful completion of our annual maintenance overhaul, and upcoming installation of a new pharmaceutical grade water system, all reflect the dedication we have to maintaining the highest standards possible. Financially, revenues for the quarter were the highest since Avid transitioned to a pure-play CDMO. We also achieved an 18% gross margin which represents a significant increase year-over-year as well as quarter-over-quarter. Expenses remained in line with expectations and our backlog continues to be strong. Importantly, during the quarter, we nearly achieved breakeven income from operations despite the deferral of revenue during the first half of FY2020 caused by unplanned equipment repairs in Q1 and our annual maintenance overhaul in Q2. Productivity and efficiency contributed significantly to Avid’s strong second quarter results, and we expect our financial performance will continue to track positively with these factors. We believe that Avid has turned an important corner, creating a stronger platform from which to achieve increased revenues, improved margins and sustainable profitability. This concludes my prepared remarks for today.
Q&A: [beg. 19:44]
1. Joseph Pantginis - H.C. Wainwright
JP: ”Hi, guys. Good afternoon. Thanks for taking the question. Wanted to ask a couple related questions. First, with regard to Myford and for example the new water system that you’re putting in, is this to be considered sort of a course of normal business with regard to the costs or how should we view that with regard to costs going forward?”
Rick Hancock: The Myford, water-for-injection system is an enhancement to the overall systems in the utilities within our Myford facility. We do have the structure of a water-for-injection system within our Franklin facility. It's just time for us to add as we continue to look at expansion into our Myford facility, which will also help with increasing our margins. As far as the overall operational costs, I would imagine all-in for one of these complicated type systems would be somewhere in the realm of about $2M to $3M.
JP: ”Got it. That's very helpful. Thank you for that. And then with regard to your commentary with regard to scope of work, obviously when you talk about the backlog number, you've always stated that you don't include future potential work that you have projected, but that might not be signed as an example. How do you view the scope of work with regard to when you might look to open up new facilities that you have capacity for?”
Rick Hancock:
Right. So, I believe you're referring to that 42,000 square feet of space in the Myford facility which is located right next to the facilities that are built out already. So, we're preparing contingency plans to build that out as soon as the demand is solid. It will probably be based on continuing to increase the use of the existing facility. We saw some room for revenue growth in Myford. Franklin is pretty busy, but there's room for growth in Myford. And then based on discussions that we have, long-term projections for some of the commercial products, we have plans to build that out, and we're just waiting for some of that capacity to have clear visibility of the usage of some of that future capacity, and then we’ll pull the trigger.
JP: Got it. And again, thanks. That’s very helpful. And then lastly with regard to your overall corporate strategy, Halozyme recently, for example, one of your biggest clients, they had some corporate update/volatility. How are you prepared to sort of weather any volatility with regard to your biggest clients, even though it appears that there was no impact to you guys from Halozyme?”
Rick Hancock: Right. That's a great question. We've obviously had significant discussions with Halozyme. As we understand it, we won't have any negative impact for the discontinuation of one of their products. Halozyme, as they have stated, will be very, very focused on their ENHANZE platform and the materials that we produce here at Avid supports that ENHANZE platform. So, no negative impact can be anticipated there. And in fact, they are probably more focused on expanding efforts in that area. In terms of our other major clients, as Tracy noted, we've had a number of them go through the scale up for their commercial production and just waiting to see how those timelines develop, but that's all very positive for us in terms of future commercial work. So the trends are very positive right now in the biotech industry in general, and we're very, very fortunate that the number of our clients are expanding their programs and are very, very healthy at this point.
2. Mike XXXX (in for Paul Knight) – Janney Capital
MX: ”Good afternoon, guys. It's Mike [??] in for Paul. And thanks for the time. We were modeling down sequentially given the planned shutdowns you guys mentioned in Q1. Can you just talk a little bit more about the dynamics that you mentioned earlier in the call that led to the increase and then kind of the weakness in the backlog in Q2 as compared to Q1? Thanks.”
Dan Hart: Sure, Mike. Pleasure to speak with you. Thanks for the questions. I guess how I would phrase the increase in revenues for Q2 was truly based on us being able to find some efficiencies in the overall capacity of our facilities to bring in some of the manufacturing projects that were scheduled to start later on in the quarter or even the next quarter. So we had the ability and the opportunity to pull in some of those projects. Because for the most part, the shutdown in our Franklin facility and the shutdown we had in our Myford facility went extremely well. It went ahead of schedule and we're able to open back up and schedule production quicker than we had originally anticipated. As far as the backlog, our backlog will ebb and flow quarter-over-quarter and it just all depends on how much revenue we recognized during the period and how much we sign. And given our business, we don't necessarily sign change orders and contracts for new molecules every week, every month, every quarter. So, it depends on the timing of those major programs and when they come in. So we will see some volatility in our backlog, but in general it should remain fairly strong on a trend towards growth.
MX: ”Great. Thanks. And then with the three process validation campaigns complete, do you have any visibility from your communications with clients on when they expect to either file or hear a decision from the regulatory agencies? And then those three potentially commercial products, how does that compare to how many commercial projects you support now? Thanks.”
Rick Hancock: Sure. So, obviously, we are in very, very active discussions with our clients about their future plans. They have certain things that they can control in terms of when they complete their submissions, and then once it goes to the agency, it moves a little bit beyond their control. There's certain waiting periods, and then depending on what the agency comes back with, they may request additional information or things like that. So, we planned capacity for the earliest date that they may require production, but beyond that, it's just very frequent updates and we don't have tremendous visibility when they will get approval. But just having a number of those, and I would say the odds of them getting approval, my opinion is very high based on what the projects are, what the molecules are, but having the existing commercial production that we do, three different molecules and then a number of others going into commercial in the future is very gratifying. I think as a CDMO, having a substantial amount of our capacity taken out by commercial products and holding that steady while we bring in earlier stage programs as well, there's a lot of benefits. One is that we can look at the calendar early in the year and have a very good idea of capacity utilization.
3. Matt Hewitt - Craig-Hallum Capital
MH: ”Maybe if you could help us a little bit. Given the efficiencies that you're able to find on the manufacturing side in Q2 that allowed you to either start some projects early from later in the quarter or even pulling from Q3, are those efficiencies expected to continue? Meaning will you be continuing to kind of pull forward some of that backlog from Q3 and Q4 earlier into the year?”
Rick Hancock: Well, Matt, that's a great question. I think you're spot on. The reality is, as we continue to fill the pipe and to look at the remainder of the year, it's not necessarily all the backlog shifted forward. We had the opportunity to move some of those projects forward. But as far as looking for the rest of the year, like we stated in the prepared comments, we're still looking at 64M-67M for the year, and our backlog’s at 52M which a majority of that typically winds out within 12 months, and we looked at most of that coming into our FY2020 year. We’re still in plenty of active discussions with our clients in increasing our overall backlog and look to continue to move towards that growth.
MH: ”Okay. All right. And then shifting gears to gross margin, very strong quarter. Some of that was being able to get the facilities back up and running faster than expected. But as we look at the next few quarters for this year and I guess looking out a little bit further, how should we be thinking about gross margin? Where do you see that kind of exiting the year? And then I've got a follow up to that as well.”
Dan Hart: Well, Matt, I'm not going to guide towards what the overall margin is going to look like, but I will say that our incremental margins going forward – since we're a largely fixed cost business, our incremental margins going forward will be somewhere between the 50% and 70% range, so most of that will be dropping to the bottom line. So I would anticipate that our margins will be stronger than where we ended last year on a fiscal year of 13%. We should continue to beat those margins.
MH: ”That's great. And then I guess a follow up is regarding the new water treatment capabilities, you mentioned that that would also help margins. What kind of a pop or boost would you expect that to give to gross margin?”
Rick Hancock: Not terribly significant to gross margin. Where it will make a greater contribution is in efficiencies, moving projects through the Myford facility at a slightly accelerated rate. It's something that our customers will be happy to see. Right now we purchased the water for injection that we used in 200-liter drums and it's a little bit of a logistical challenge moving those throughout the supply chain. So this will just contribute to the overall productivity of that facility.
4. Jacob Johnson - Stephens Inc.
JJ: ”Hi. Thanks. Congrats on the strong quarter. Just one question on guidance. It implies for a slowdown in the second half of the year outside of the benefit from pulling forward some of the revenues in Q2. Are there any other puts and takes when you just think about for the back half of your FY2020?”
Dan Hart: No. Jacob, how’s it going and thanks for calling in and thanks for the question. Looking at the remainder of the fiscal year, there's no seasonality per se or facility shutdown per se that we're anticipating for the rest of the year. And we will continue to produce within the manufacturing capacity for the remainder of the second half.
JJ: ”Got it. And then in October you opened the expanded process development lab. Obviously, it's going to generate its own revenue stream. But is that important to your business development efforts, including building out your manufacturing pipeline?”
Rick Hancock: It really is. In the past we were slightly constrained in terms of process development. So we're focused on bringing on projects that were more mature where the bulk of the process development work has already been completed, and they could transition pretty rapidly to our clinical manufacturing. This rounds us out and allows us to take on very, very early stage projects. And also it allows us to do additional process development work on projects that we're completing already, whether it's a scale up or looking for more efficiencies in either upstream or downstream process. It also opens us up to doing standalone process development projects. And typically PD has a pretty healthy margin associated with it. So by being able to do purely process development projects, we can start working with a new customer doing very specific activities in PD and get the relationship going and then progress to additional work.
JJ: ”Got it. Thanks for that, Rick. And then, Dan, just one quick point of certification. The 2M to 3M for the new water system, will that be a capital expenditure in terms of accounting for it or will that flow through the OpEx line?”
Dan Hart: It will absolutely be a capital item that's going to the balance sheet.
RICK HANCOCK (CEO) – CLOSING COMMENTS:
The progress made during Q2 has placed us in a strong position for growth and we look forward to updating you on our future advancements. Thank you, again, for participating today and for your continued support of Avid Bioservices.
= = = = = = = = = = = = = = = = = = = = = = = = = = = = = == = = =
12-9-19: Avid Bioservices Reports Financial Results for 2nd Quarter FY 2020 (10-31-19) and Recent Developments
http://ir.avidbio.com/news-releases/news-release-details/avid-bioservices-reports-financial-results-second-quarter-0
-- Achieved Strong Second Quarter Revenue of $18.3 Million and Gross Margin of 18% --
-- Fiscal 2020 Projected Revenue of $64 to $67 Million Reaffirmed --
-- Launched Expanded Process Development Facility and Services --
TUSTIN, Dec. 9, 2019: Avid Bioservices, Inc. (NASDAQ:CDMO/CDMOP), a dedicated biologics contract development and manufacturing organization (CDMO) working to improve patient lives by providing high quality development and manufacturing services to biotechnology and pharmaceutical companies, today announced financial results for Q2 of fiscal 2020 ended October 31, 2019.
HIGHLIGHTS SINCE JULY 31, 2019
“During Q2 of 2020, we strengthened multiple core areas of our business,” said Rick Hancock, interim president and chief executive officer of Avid. “Our business development effort continues to be wide reaching and robust. Our reputation in the industry for quality and regulatory success continues to grow allowing us to engage with a broadening pool of potential new customers and expand our relationships with existing customers.
“Operationally, we continue to improve and enhance our equipment, facilities and systems. The opening of our new process development lab, the successful completion of our annual maintenance overhaul, and the planned installation of a new pharmaceutical grade water system in calendar 2020 all reflect the dedication we have to maintaining the highest standards possible.
“The revenues for this quarter were the highest since Avid transitioned to a pure-play CDMO in January 2018, and we achieved 18% gross margin, which represents a significant increase year-over-year as well as quarter-over-quarter. Expenses remained in line with expectations and our backlog continues to be strong. Also important, during the quarter we approached breakeven income from operations.
“Productivity and efficiency contributed significantly to Avid’s strong second quarter results, and we expect that our financial performance will continue to track positively with these factors. We believe that Avid has turned an important corner, creating a stronger platform from which to achieve sustainable profitability.”
Financial Highlights and Guidance
* The company is confirming prior revenue guidance for the full fiscal year 2020 of $64-67 million.
* Revenue was $18.3 million for Q2 of fiscal 2020, an increase of 80% as compared to $10.2 million for Q2 of last fiscal year. For the six months ended October 31, 2019, revenues were $33.6 million, a 47% increase as compared to revenues of $22.8 million during the prior period. Increases during both current-year periods were primarily due to an increase in the number of in-process and completed manufacturing runs as a result of growing demand from a more diversified client base.
* As of October 31, 2019, revenue backlog was approximately $52 million, a decrease of 16% as compared to the first quarter of fiscal 2020. The company expects to recognize the majority of this backlog within the next 12 months.
* Gross margin for Q2 of fiscal 2020 of 18% was up significantly compared to a gross margin of 3% in the prior period. Gross margin for the six months ended October 31, 2019 was 13%, up significantly compared to 7% in the prior period. These increases were primarily attributed to the increased number of manufacturing runs, partially offset by costs associated with the hiring of personnel to accommodate growth in production demand, increases in other compensation expenses, and equipment repairs.
* Selling, general and administrative expenses (“SG&A”) for Q2 of fiscal 2020 were $3.5 million compared to $2.8 million for Q2 of last year. The increase was primarily attributed to payroll and related costs, and stock-based compensation. For the first six months of fiscal 2020, SG&A expenses were $8.0 million compared to $6.0 million for the first six months of fiscal 2019. The increases in SG&A during the six-month period were primarily attributed to payroll and related costs, including one-time employee separation-related expenses, and increased stock-based compensation.
* In September 2019, the company recognized a one-time loss of $.4 million in connection with the termination of a non-manufacturing facility lease, which reduces our future lease and related payments by approximately $1.3 million over the next four years. Additionally, the lease termination released $.3 million of restricted cash that was pledged as collateral under a letter of credit required by the terminated lease back to the company. The lease termination of this redundant warehouse space has no impact on our future expansion plans, as the company continues to have 42,000 square feet available within our Myford facility.
* For Q2 of fiscal 2020, the company recorded a consolidated net loss attributable to common stockholders of $1.9 million or $0.03 per share, compared to a consolidated net loss attributable to common stockholders of $2.9 million or $0.05 per share, for the prior year period. For the first six months of fiscal 2020, the company recorded a consolidated net loss attributable to common stockholders of $6.1 million or $0.11 per share, compared to a consolidated net loss attributable to common stockholders of $5.9 million or $0.11 per share, for the prior year period.
* Avid reported $34.0 million in cash and cash equivalents as of October 31, 2019, compared to $32.4 million on April 30, 2019.
More detailed financial information and analysis may be found in Avid Bioservices’ Quarterly Report on Form 10-Q, which will be filed with the SEC today. https://tinyurl.com/v37mgjk
RECENT CORPORATE DEVELOPMENTS
* Launched expanded process development (PD) facility and services. This purpose-built state-of-the-art facility, which houses Avid’s expanded upstream and downstream process development capabilities, represents an important new opportunity for the company by allowing us to expand our existing relationships and attract new business by offering support to customers that seek to outsource their PD work.
* Expanded scope of work with multiple existing customers to increase the number of manufacturing batches and/or scale of production.
* Appointed Richard (Rich) Richieri as chief operations officer. Mr. Richieri will oversee Process Development, Clinical and Commercial Manufacturing, Technical Support and Facilities. In this role, Mr. Richieri will be focused on streamlining operations, building internal efficiencies and strategic planning for future growth. Mr. Richieri has over 25 years of biopharmaceutical industry experience spanning the areas of drug discovery, CGMP operations, contract manufacturing and process development. Mr. Richieri previously spent 15 years with Avid Bioservices and its former parent company, Peregrine Pharmaceuticals, including the role of senior vice president of manufacturing. During that time, he was instrumental in launching, building and growing Avid’s CDMO business and helping the company diversify its production capabilities.
* Initiated final design stage for the construction of a new pharmaceutical grade water system in the Myford facility. Installation of this system will supply water to multiple manufacturing systems, a critical step in creating the manufacturing efficiencies required to increase output and strengthen margins. The company expects the system to be installed in calendar 2020.
Conference Call
Avid will host a conference call and webcast this afternoon, December 9, 2019, at 4:30 PM ET (1:30 PM PT). To listen to the conference call, please dial (877) 312-5443 or (253) 237-1126 and request the Avid Bioservices conference call. To listen to the live webcast, or access the archived webcast, please visit: http://ir.avidbio.com/events.cfm .
About Avid Bioservices, Inc.
Avid Bioservices is a dedicated contract development and manufacturing organization (CDMO) focused on development and CGMP manufacturing of biopharmaceutical products derived from mammalian cell culture. The company provides a comprehensive range of process development, high quality CGMP clinical and commercial manufacturing services for the biotechnology and biopharmaceutical industries. With 25 years of experience producing monoclonal antibodies and recombinant proteins in batch, fed-batch and perfusion modes, Avid's services include CGMP clinical and commercial product manufacturing, purification, bulk packaging, stability testing and regulatory strategy, submission and support. The company also provides a variety of process development activities, including cell line development and optimization, cell culture and feed optimization, analytical methods development and product characterization. http://www.avidbio.com
AVID BIOSERVICES, INC.
CONDENSED CONSOLIDATED STATEMENTS OF OPERATIONS AND COMPREHENSIVE LOSS
(Unaudited) (In thousands, except per share information)
Three Months Ended
October 31, Six Months Ended
October 31,
2019 2018
2019 2018
Revenues $ 18,313 $ 10,178 $ 33,567 $ 22,767
Cost of revenues 14,953 9,844 29,121 21,241
Gross profit
3,360 334 4,446 1,526
Operating expenses:
Selling, general and administrative 3,534 2,816 7,993 6,031
Loss on lease termination 355 — 355 —
Total operating expenses 3,889 2,816 8,348 6,031
Operating loss (529 ) (2,482 ) (3,902 ) (4,505 )
Interest and other income, net 99 119 308 181
Loss from continuing operations before income taxes (430 ) (2,363 ) (3,594 ) (4,324 )
Income tax benefit — 173 — 173
Loss from continuing operations, net of tax (430 ) (2,190 ) (3,594 ) (4,151 )
Income from discontinued operations, net of tax — 739 — 739
Net loss $ (430 ) $ (1,451 ) $ (3,594 ) $ (3,412 )
Comprehensive loss $ (430 ) $ (1,451 ) $ (3,594 ) $ (3,412 )
Series E preferred stock accumulated dividends (1,442 ) (1,442 ) (2,523 ) (2,523 )
Net loss attributable to common stockholders $ (1,872 ) $ (2,893 ) $ (6,117 ) $ (5,935 )
Basic and diluted net (loss) income per common share attributable to common stockholders:
Continuing operations $ (0.03 ) $ (0.06 ) $ (0.11 ) $ (0.12 )
Discontinued operations — 0.01 — 0.01
Net loss per share attributable to common stockholders $ (0.03 ) $ (0.05 ) $ (0.11 ) $ (0.11 )
Weighted average basic and diluted shares outstanding
56,253 56,009 56,210 55,889
AVID BIOSERVICES, INC.
CONDENSED CONSOLIDATED BALANCE SHEETS
(In thousands, except par value)
October 31,
2019 April 30,
2019
ASSETS (unaudited)
Current assets:
Cash and cash equivalents $ 33,960 $ 32,351
Accounts receivable 7,422 7,374
Contract assets 6,110 4,327
Inventory 7,809 6,557
Prepaid expenses and other current assets 926 709
Total current assets 56,227 51,318
Property and equipment, net 26,990 25,625
Operating lease right-of-use assets 21,381 —
Restricted cash 350 1,150
Other assets 302 302
Total assets $ 105,250 $ 78,395
LIABILITIES AND STOCKHOLDERS’ EQUITY
Current liabilities:
Accounts payable $ 6,126 $ 4,352
Accrued payroll and related costs 3,360 3,540
Contract liabilities 22,199 14,651
Operating lease liabilities 1,241 —
Other current liabilities 746 619
Total current liabilities 33,672 23,162
Operating lease liabilities, less current portion 22,394 —
Deferred rent, less current portion — 2,072
Other long-term liabilities — 93
Commitments and contingencies
Stockholders’ equity:
Preferred stock, $0.001 par value; 5,000 shares authorized;1,648 shares issued and outstanding at October 31, 2019 and April 30, 2019, respectively 2 2
Common stock, $0.001 par value; 150,000 shares authorized; 56,338 and 56,136 shares issued and outstanding at October 31, 2019 and April 30, 2019, respectively 56 56
Additional paid-in capital 613,325 613,615
Accumulated deficit (564,199 ) (560,605 )
Total stockholders’ equity 49,184 53,068
Total liabilities and stockholders’ equity $ 105,250 $ 78,395
CONTACTS:
• Stephanie Diaz (Investors) Vida Strategic Partners 415-675-7401 sdiaz@vidasp.com
• Tim Brons (Media) Vida Strategic Partners 415-675-7402 tbrons@vidasp.com
- - - - - - - -
From 10-Q header: “As of Nov 30, 2019, there were 556,338,143 shares outstanding.”
- - - - - - - - - - - - - - - - -
Latest 10K 4-30-19 iss. 6-27-19 http://tinyurl.com/yxukx6t4 PR: http://tinyurl.com/y2k3tftn (Cash 4-30-19=$32.4mm)
Latest 10Q 10-31-19 iss. 12-9-19 https://tinyurl.com/v37mgjk PR: https://tinyurl.com/sw7wgle (Cash 10-31-19=$34.0mm)
ALL SEC filings for PPHM: http://tinyurl.com/6d4jw8
10-K: “As of 4-30-19, we employed 211 full-time & 4 part-time emps.” (2018: 185/1)
= = = = = = = = = = = = = = = = = = = = = = = = = = = =
Updated PPHM REVS-BY-QTR TABLE, now thru FY20Q2(qe 10-31-19), per the 10Q (https://tinyurl.com/v37mgjk ) issued 12-9-19.
• Total Avid Revs since May’03: $382.5M
• 12-9-19: FY'20 (May'19-Apr'20) Avid revs guidance $64-67M (committed B/L=$52 at 10-31-19).
• Inventories at 10-31-19 total $7.8M, UP from $8.0M at 10-31-19.
Avid’s website: http://www.avidbio.com
 AVID GROSS PROFITABILITY BY QTR:                   CONTRACT
 QTR  (1000’s)      Rev$  COGS$  Prof$  GP% INVEN$ LIABILITIES*
 FY13Q1  7-31-12   4,135  2,024  2,111  51%  5,744   16,280
 FY13Q2 10-31-12   6,061  3,703  2,358  39%  5,426   14,721
 FY13Q3  1-31-13   6,961  3,651  3,310  47%  4,635   11,790
 FY13Q4  4-30-13   4,176  3,217    959  23%  4,339   12,230
 FY14Q1  7-31-13   4,581  2,670  1,911  42%  5,679   12,692
 FY14Q2 10-31-13   7,354  4,195  3,159  43%  4,033   11,126
 FY14Q3  1-31-14   3,885  2,416  1,469  38%  5,224   12,975
 FY14Q4  4-30-14   6,474  3,829  2,645  41%  5,530   11,001
 FY15Q1  7-31-14   5,496  3,583  1,913  35%  5,998   10,896
 FY15Q2 10-31-14   6,263  4,139  2,124  34%  5,379   11,161
 FY15Q3  1-31-15   5,677  3,113  2,564  45%  6,148   14,063
 FY15Q4  4-30-15   9,308  4,758  4,550  49%  7,354   17,993
 FY16Q1  7-31-15   9,379  4,608  4,771  51% 10,457   17,890
 FY16Q2 10-31-15   9,523  4,741  4,782  50% 12,554   24,623
 FY16Q3  1-31-16   6,672  3,896  2,776  42% 15,189   37,851
 FY16Q4  4-30-16  18,783  9,721  9,062  48% 15,189   39,630
 FY17Q1  7-31-16   5,609  3,062  2,547  45% 25,274   43,262
 FY17Q2 10-31-16  23,370 15,441  7,929  34% 25,924   44,908
 FY17Q3  1-31-17  10,747  7,974  2,773  26% 33,829   52,577
 FY17Q4  4-30-17  17,904 11,782  6,122  34% 33,099   45,517
 FY18Q1  7-31-17  27,077 20,448  6,629  24% 24,235   27,755
 FY18Q2 10-31-17  12,782 16,242 -3,460 -27% 16,518   20,611
 FY18Q3  1-31-18   6,819 10,951 -4,132 -61% 14,218   24,235
 FY18Q4  4-30-18   6,943  8,904 -1,961 -28% 16,129   27,935
 FY19Q1  7-31-18  12,589 11,397  1,192   9%  9,168   17,994
 FY19Q2 10-31-18  10,178  9,844    334   3%  9,736   17,307
 FY19Q3  1-31-19  13,781 11,731  2,050  15%  8,660   14,620
 FY19Q4  4-30-19  17,055 13,407  3,648  21%  6,557   14,651
 FY20Q1  7-31-19  15,254 14,168  1,086   7%  8,031   18,104
 FY20Q2 10-31-19  18,313 14,953  3,360  18%  7,809   22,199
 *7-31-18 10Q: “prior-yr amts related to (deferred revenue
 + cust deposits) now reclass’d as contract liabilities.”

 FY13 TOTAL:      21,333 12,595  8,738  41%*
 FY14 TOTAL:      22,294 13,110  9,184  41%*
 FY15 TOTAL:      26,744 15,393 11,151  42%*
 FY16 TOTAL:      44,357 22,966 21,391  48%*
 FY17 TOTAL:      57,630 38,259 19,371  34%*
 FY18 TOTAL:      53,621 56,545 -2,924  -5%*
 FY19 TOTAL:      53,603 46,379  7,224  13%*
 *Avid Net-Profit(Selling/G&A) not split out from PPHM-Corp. in the fin’s.

 AVID TOTAL REV’s BY YEAR):
 FY04 4-30-04   3,039 (Avid-Revs didn’t incl. Avid’s Gov’t work)
 FY05 4-30-05   4,684
 FY06 4-30-06   3,005
 FY07 4-30-07   3,492
 FY08 4-30-08   5,897
 FY09 4-30-09  12,963
 FY10 4-30-10  13,204
 FY11 4-30-11   8,502
 FY12 4-30-12  14,783
 FY13 4-30-13  21,333
 FY14 4-30-14  22,294
 FY15 4-30-15  26,744
 FY16 4-30-16  44,357
 FY17 4-30-17  57,630
 FY18 4-30-18  53,621
 FY19 4-30-19  53,603
 FY20 4-30-20  33,385 <=thru Q1 10-31-19
 **TOTAL:     382,536 (5/1/2003–10/31/19)
 .
 QTLY. NET PROFIT/LOSS BY QTR:
 (“attributable to common stockholders”; ie, incl. PREF Div’s**)
 **2-11-14: PPHM Raises $16.2M, 700k Pref. Shares w/10.5% DIV.
 FY16Q1  7-31-15 -15,101,000
 FY16Q2 10-31-15 -14,578,000
 FY16Q3  1-31-16 -18,227,000
 FY16Q4  4-30-16 -13,264,000
 FY17Q1  7-31-16 -12,437,000
 FY17Q2 10-31-16  -4,498,000
 FY17Q3  1-31-17  -9,216,000
 FY17Q4  4-30-17  -6,714,000
 FY18Q1  7-31-17  -2,647,000
 FY18Q2 10-31-17 -14,066,000
 FY18Q3  1-31-18 -12,446,000
 FY18Q4  4-30-18  +1,578,000 <=includes $9,154,000 income from disc. operations.
 FY19Q1  7-31-18  -3,403,000
 FY19Q2 10-31-18  -2,893,000
 FY19Q3  1-31-19  -2,581,000
 FY19Q4  4-30-19  -1,106,000
 FY20Q1  7-31-19  -4,606,000
 FY20Q2 10-31-19  -1,872,000

 Period        Halozyme ADC-Therap. Coherus-BioSci. Other-Custs
 FYE  4-30-14     91%                                    8%
 FYE  4-30-15     79%                                    9%
 FYE  4-30-16     69%                     26%            5%
 FYE  4-30-17     58%                     26%           16%
 FYE  4-30-18     55%      9%             22%           14%
 FYE  4-30-19     30%     21%             13%           36%
 ...(cust. splits not given in 7-31-18+ 10Q’s)
Dec9/After Close: Q2/FY20 (q/e 10-31-19) Financials & Conf.Call
http://ir.avidbio.com/events-and-presentations
Also:
Dec9-13/Booth: Antibody Engineering & Therapeutics, San Diego
Mar9-12 2020: BPI US WEST, Santa Clara CA https://lifesciences.knect365.com/bpi-west/
...3-14-20 9:20-9:50am/David Briggs(Sr.Mgr/Mfg-Quality-Sci) & William Leonardi(ProjMgr/BusOP/ClientLiason):
...Technology Workshop/Avid Case Study, “Taking Your Molecule Through Process Validation”
R622, I added in the 87,000shs. owned separately by Tappan president Prasad Phatak to get to my 4,854,100 figure. Look down at item4 in the 13G:
Tappan St. Partners
2-14-19: AMENDMENT TO FORM SC 13G https://tinyurl.com/yxrpla3b
Date of Event Requiring Filing: 12-31-2018
Tappan St. Partners LLC: 4,767,100 (8.50%)
Tappan St. Partners Fund L.P.: 652,100 (1.16%)
Tappan Street Partners Ideas Fund L.P.: 4,115,000 (7.34%)
Prasad Phatak: 87,000(SOLE)
TOTAL: 4,854,100 (8.66%)
Amount beneficially owned: Aggregate of all filers: 4,854,100
Percents based on 56,067,867 O/S at 12-31-18.
Note: Mar 4, 2019: 56,074,509
https://www.sec.gov/Archives/edgar/data/704562/000138713119001185/ab-sc13ga_123118.htm
THANKS, R622 - I will check, fix + repost.
9 LARGEST SHAREHOLDERS a/o 9-30-19:
1. Tappan Street (Prasad Phatak): 4,854,100 8.6% (+337,993 a/o 12-31-18 13G: http://tinyurl.com/yxrpla3b )
2. IsZo Capital Mgt. (Brian Sheehy): 4,534,694 8.1% (-243,429 a/o 9-30-19 Nasdaq Inst.)
3. Eastern Capital (Kenneth Dart): 4,300,992 7.6% (a/o 12-7-17 14A: https://tinyurl.com/y7qprpg9 acq. 10-2015)
4. Blackrock Inc. (Larry Fink): 3,925,526 7.0% (+135,240 q/e 9-30-19 Nasdaq Inst.)
5. Ronin Trading (John Stafford III+Roger Farley): 2,638,450 4.8% (a/o 4-17-18 13D: https://tinyurl.com/ycf7d2uk )
6. Vanguard Group 2,676,002 4.8% (+3,417 q/e 9-30-19 Nasdaq Inst.)
7. Snyder Capital 2,252,053 4.0% (+9,761 a/o 9-30-19 Nasdaq Inst.)
8. Altravue Capital 2,223,382 4.0% (+114,570 a/o 9-30-19 Nasdaq Inst.)
9. State Street 1,027,828 1.8% (+87,955 a/o 9-30-19 Nasdaq Inst.)
CDMO - O/S Shares History (’06–curr.)
Click here for 4/30/06–12/8/16 Peregrine Pharm. share history: https://tinyurl.com/y76cbyt5
**PPHM shares were 1:5 R/S eff. 10-19-09 (~237mm/$.64=>~47.4mm/$3.20) http://tinyurl.com/ykuw588
**PPHM shares were 1:7 R/S eff. 7-10-17 (315mm/$.606=>45mm/$4.24) http://tinyurl.com/ycohqn6j
1-31-17: 271,068,464 +13,926,930 (1-31-17 10Q iss. 3-13-17)
3-10-17: 297,709,478 +26,641,014 (“ “ “)
4-30-17: 44,014,040(x7)=308,098,280 +10,388,802 (4-30-17 10K iss. 7-14-17)
7-10-17: 45,069,188 +1,055,148 (“ “ “)
7-31-16: 45,094,154 +24,966 (7-31-17 10Q iss. 9-11-17)
8-25-17: 45,096,081 +1,927 (8-25-17 Amended 10K http://tinyurl.com/yb5jq7vc )
9-6-17: 45,096,081 nochg (7-31-17 10Q iss. 9-11-17)
10-31-16: 45,172,632 +76,551 (10-31-17 10Q iss. 12-11-17)
11-27-17: 45,210,608 +37,976 (14A/Proxy iss. 12-7-17 https://tinyurl.com/y7qprpg9 )
12-6-17: 45,212,760 +2,152 (10-31-17 10Q iss. 12-11-17)
1-8-18: 45,253,038 +40,278 (2-8-18 13D https://tinyurl.com/ya43sc3r )
1-31-18: 45,257,180 +4,142 (1-31-18 10Q iss. 3-12-18)
...2-20-18: Avid Raises ~$21.8M net, selling 10,294,445sh.@$2.25 (underwriter: Wells Fargo)
…... 8-K: https://tinyurl.com/ya3nenth 424B5: https://tinyurl.com/ycpshgxl
3-7-18: 55,552,233 +10,295,053 (1-31-18 10Q)
4-30-18: 55,689,222 +133,989 (4-30-18 10K)
7-10-18: 55,793,107 +103,885 (4-30-18 10K)
9-5-18: 56,001,456 +208,349 (7-31-18 10Q)
10-31-18: 56,063,488 +62,032 (10-31-18 10Q)
12-3-18: 56,067,867 +4,379 (10-31-18 10Q)
1-31-19: 56,072,291 +4,424 (1-31-19 10Q)
3-4-19: 56,074,509 +2,218 (1-31-19 10Q)
6-14-19: 56,137,724 +63,215 (4-30-19 10K)
8-31-19: 56,237,674 +99,950 (7-31-19 10Q)
PPHM REVS-BY-QTR TABLE thru FY20Q1(qe 7-31-19), per the 10Q (http://tinyurl.com/yxukx6t4 ) issued 9-5-19.
• Total Avid Revs since May’03: $364.4M
• 9-5-19: FY'20 (May'19-Apr'20) Avid revs guidance $64-67M (committed B/L=$61 at 7-31-19).
• Inventories at 7-31-19 total $8.0M, UP from $6.6M at 4-30-19.
Avid’s website: http://www.avidbio.com
 AVID GROSS PROFITABILITY BY QTR:                   CONTRACT
 QTR  (1000’s)      Rev$  COGS$  Prof$  GP% INVEN$ LIABILITIES*
 FY13Q1  7-31-12   4,135  2,024  2,111  51%  5,744   16,280
 FY13Q2 10-31-12   6,061  3,703  2,358  39%  5,426   14,721
 FY13Q3  1-31-13   6,961  3,651  3,310  47%  4,635   11,790
 FY13Q4  4-30-13   4,176  3,217    959  23%  4,339   12,230
 FY14Q1  7-31-13   4,581  2,670  1,911  42%  5,679   12,692
 FY14Q2 10-31-13   7,354  4,195  3,159  43%  4,033   11,126
 FY14Q3  1-31-14   3,885  2,416  1,469  38%  5,224   12,975
 FY14Q4  4-30-14   6,474  3,829  2,645  41%  5,530   11,001
 FY15Q1  7-31-14   5,496  3,583  1,913  35%  5,998   10,896
 FY15Q2 10-31-14   6,263  4,139  2,124  34%  5,379   11,161
 FY15Q3  1-31-15   5,677  3,113  2,564  45%  6,148   14,063
 FY15Q4  4-30-15   9,308  4,758  4,550  49%  7,354   17,993
 FY16Q1  7-31-15   9,379  4,608  4,771  51% 10,457   17,890
 FY16Q2 10-31-15   9,523  4,741  4,782  50% 12,554   24,623
 FY16Q3  1-31-16   6,672  3,896  2,776  42% 15,189   37,851
 FY16Q4  4-30-16  18,783  9,721  9,062  48% 15,189   39,630
 FY17Q1  7-31-16   5,609  3,062  2,547  45% 25,274   43,262
 FY17Q2 10-31-16  23,370 15,441  7,929  34% 25,924   44,908
 FY17Q3  1-31-17  10,747  7,974  2,773  26% 33,829   52,577
 FY17Q4  4-30-17  17,904 11,782  6,122  34% 33,099   45,517
 FY18Q1  7-31-17  27,077 20,448  6,629  24% 24,235   27,755
 FY18Q2 10-31-17  12,782 16,242 -3,460 -27% 16,518   20,611
 FY18Q3  1-31-18   6,819 10,951 -4,132 -61% 14,218   24,235
 FY18Q4  4-30-18   6,943  8,904 -1,961 -28% 16,129   27,935
 FY19Q1  7-31-18  12,589 11,397  1,192   9%  9,168   17,994
 FY19Q2 10-31-18  10,178  9,844    334   3%  9,736   17,307
 FY19Q3  1-31-19  13,781 11,731  2,050  15%  8,660   14,620
 FY19Q4  4-30-19  17,055 13,407  3,648  21%  6,557   14,651
 FY20Q1  7-31-19  15,254 14,168  1,086   7%  8,031   18,104
Let me add some posts real quick - robot says I need 4 recent ones.
Heavens - I'm auto removed as Mod. Robot says not enough posts...
Total INST.+LARGE Holdings now 37,448,204 66.6% (9-30-19)
Up from 35,952,779 64.0% at 6-30-19.
25,654,662 45.6% INSTITUTIONS (a/o 9-30-19)
https://www.nasdaq.com/symbol/cdmo/institutional-holdings
+ 11,793,542 21.0% LARGE SHAREHOLDERS via Forms13/14 (Tappan, EasternCap/Dart, Ronin/Stafford) – ie, not in Nasdaq Inst. List.
I’m not sure about Eastern Cap(K.Dart) and Ronin(Stafford/Farley) - no updates since 12-2017 & 4-2018 respectively. I’m assuming that means NO CHG.
------------
= 37,448,204 66.6%
Note: Ownership %’s based on 56,237,674 common O/S at 8-31-19. (10Q: https://tinyurl.com/yxvqm45d )
9 LARGEST SHAREHOLDERS:
1. Tappan Street (Prasad Phatak): 4,854,100 8.6% (+337,993 a/o 12-31-18 13G: http://tinyurl.com/yxrpla3b )
2. IsZo Capital Mgt. (Brian Sheehy): 4,534,694 8.1% (-243,429 a/o 9-30-19 Nasdaq Inst.)
3. Eastern Capital (Kenneth Dart): 4,300,992 7.6% (a/o 12-7-17 14A: https://tinyurl.com/y7qprpg9 acq. 10-2015)
4. Blackrock Inc. (Larry Fink): 3,925,526 7.0% (+135,240 q/e 9-30-19 Nasdaq Inst.)
5. Ronin Trading (John Stafford III+Roger Farley): 2,638,450 4.8% (a/o 4-17-18 13D: https://tinyurl.com/ycf7d2uk )
6. Vanguard Group 2,676,002 4.8% (+3,417 q/e 9-30-19 Nasdaq Inst.)
7. Snyder Capital 2,252,053 4.0% (+9,761 a/o 9-30-19 Nasdaq Inst.)
8. Altravue Capital 2,223,382 4.0% (+114,570 a/o 9-30-19 Nasdaq Inst.)
9. State Street 1,027,828 1.8% (+87,955 a/o 9-30-19 Nasdaq Inst.)
BIGGEST DROPS q/e 9-30-19:
Marshall Wace -324,328 Sold Out
IsZo Capital Mgt. -243,429 to 4,534,694
= = = = = = = = = = = =
Shares O/S as of 8-31-19=56,237,674 - history since 4-2006: https://tinyurl.com/y6t8zfur
...A/O 7-31-19: 3,547,000 stock options outstanding at a wgt.avg. exercise price of $7.56 (pg.12 10Q)
9-5-19: Qtly. Conf. Call (Hancock/Hart/Kinjerski) PR & Transcript https://tinyurl.com/y6t8zfur
PEREGRINE’s AntiPS/IP and 2017 Transition to Pure CDMO
Feb. 2018: Peregrine Pharmaceuticals completed its Mid’17-Early’18 Transition to a Pure-Play CDMO
(Contract Development & Mfg. Organization), Avid Bioservices, Inc.
**FULL PPHM=>CDMO Transition History (Ronin/SWIM): https://tinyurl.com/ybqvzwhg
1-8-17: Peregrine chgs. name to “Avid Bioservices, Inc.”; new ticker: “CDMO” (+CDMOP) https://tinyurl.com/y8vhjow4
2-12-18: Peregrine’s Legacy PS-Targeting IP Sold to ONCOLOGIE INC. (Boston, CEO: Laura E. Benjamin) for $8M/upfront, $95M/milestones https://tinyurl.com/yam8gb3h
...12-13-18/8-K: Overview of Oncologie sale: https://tinyurl.com/yab9c6cr
NOTE: “PS-targeting Exosome tech. not included; back to UTSW", see: https://tinyurl.com/yakdl4wj
Click here for an ARCHIVE of the History of Peregrine’s Anti-PS/Bavituximab Platform - MOA, Trials, and Activity over the years, from early 2000’s thru 2017, prior to being Sold to ONCOLOGIE: https://tinyurl.com/y8pq4rhc
Of Interest (post Oncologie Sale):
4-20-18/AACR’18: MSKCC(LudwigCC) Tweets about 2 WolchokLAB/”PPHM” Anti-PS Posters https://tinyurl.com/ycgjhvqa
4-26-18: New Bavi+Keytruda/LIVER Ph2 IST Trial, Sponsor=UTSW, Collab=MERCK https://tinyurl.com/y7fd9vdb
6-7-18: Oncologie Obtains $16.5M Seed Funding Led by Pivotal bioVenture Partners China Fund https://tinyurl.com/ybrrbgg7
6-7-18/BioCentury: Laura Benjamin states, “Oncologie plans to begin a trial mid-summer '18 evaluating Bavi to treat HCC and a P-O-C trial in Gastric cancer in 1Q19/2Q19.” https://tinyurl.com/ycb8r7sm
12-3-18: During q/e 10-31-18, Avid sold remaining legacy R&D asset, r84(anti-VEGF), to Oncologie for $1.0M upfront. Avid is eligible to receive up to an addl. $21M in dev/reg./comm. milestones, and low to mid-single digit royalties on net sales upon commercialization of products utilizing r84 https://tinyurl.com/y9n374kp
9-5-19 Qtly CC-Transcript, PR(Q1FY20/qe7-31-19), Avid Revs History Table
*Revs Guidance (FY’20 fye 4-30-20): $64-67M. 7-31-19 Backlog=$61M
*Cash: 7-31-19: $28.9M
*As of 8-31-19: 56,237,674 shares o/s.
*10Q/7-31-19 iss. 9-5-19: https://tinyurl.com/yxvqm45d
*Avid Total Revs May03-Jul19: $364.4M
*Avid’s website: https://avidbio.com (A/o 4-30-19, 211 full-time & 4 part-time emps)
This large post has 4 sections:
I. 9-5-19 Qtly. Earnings Conf. Call TRANSCRIPT (FY20/Q1 q/e 7-31-19)
II. 9-5-19 CDMO Press Release: Q1/FY20 Earnings & Developments
IV. Updated Table of Avid Revenues By Quarter (May’06-Current)
III. Updated O/S Shares History Table – 2006-curr.
…Recall: Avid’s FY runs May-Apr, so FY’20 = May’19-Apr’20.
((( Orig. transcript from SeekingAlpha.com [https://tinyurl.com/y3qcpooj ] with numerous corrections made. )))
Link to webcast replay: http://ir.avidbio.com/events-and-presentations => https://edge.media-server.com/mmc/p/4k9kpd4z
TRANSCRIPT 9-5-19 FY20/Q1 Earnings Conf. Call (q/e 7-31-19) (Hancock/Hart/Kinjerski)
RICK HANCOCK (INTERIM CEO) – OPENING COMMENTS:
Thank you to everyone who has dialed in, and to those who are participating today via webcast. I am pleased to announce that Avid continued to make progress on multiple fronts during Q1 of 2020. With respect to our financials performance, revenue for Q1 of 2020 again beat consensus estimates and our backlog increased significantly. Dan will provide more details regarding our financial results in a moment. With respect to business development, we signed 2 new contract manufacturing service agreements during the quarter, and began onboarding activities for these clients. In addition, we continued to pursue opportunities to expand existing client relationships with active discussions regarding additional batches and potential projects for the manufacture of new molecules. Activities with both potential new and existing customers were robust during Q1, and Tracy will provide more details on these developments. With that, I'll turn the call over to Dan to provide a financial overview for fiscal Q1 results.
DANIEL HART (CFO) – OPENING COMMENTS:
Before I begin, I'd like to recommend that everyone participating referred to our 10-Q which we filed today for additional details. [https://tinyurl.com/yxvqm45d ] I'll now discuss our financial results from continuing operations for Q1 of FY20 ending July 31, 2019, starting with revenue. Revenue for the quarter was $15.3M, an increase of 21% as compared to $12.6M for the same period of the prior year. This increase was primarily the result of growth in the number and scope of customer projects. For Q1 of 2020, gross margin of 7% was down slightly as compared to 9% in the prior year period. Despite increased revenue during Q1 of 2020, gross margin was impacted by hiring personnel to accommodate growth and production demand, a realignment of the company's compensation structure to secure our existing work force, and equipment repairs that impacted efficiencies during the period. Management does not expect these factors to impact our stated revenue guidance for the full year. And looking ahead, we expect expanding production demand to result in the increased utility of our existing capacity and improved margins.
I'll now address expenses. Total SG&A expenses for Q1 of FY20 were $4.5M, compared to $3.2M for Q1 of FY19. This increase was due primarily to employee separation-related expenses and increased stock-based compensation. Excluding the separation agreement expense and the increase in stock-based compensation, SG&A during Q1 FY20 would have been flat as compared to the prior year quarter. For Q1 of FY20, the company recorded consolidated net loss attributable to common stockholders of $4.6M or $.08 per share compared to $3.4M or $.06 per share for Q1 of FY19. The increase in the net loss results primarily from the previously discussed increase in cost of revenue, as well as the increase in SG&A from separation expenses and increased stock-based compensation expense. Our backlog at the end of Q1 of 2020 was approx. $61M, an increase of 34% compared to the $46M at the end of FY19, due primarily to our growing list of customers, as well as the expansion of the relationship with one of the company's existing biotechnology customers. We are pleased to maintain a strong backlog and we expect to recognize the majority of this balance in FY20. We are reporting cash & cash equivalents as of July 31, 2019 of $28.9M as compared to $32.4M as of the prior FY ended April 30, 2019. This concludes my financial overview. I will now turn the call over to Tracy for an update on business development activities and achievements during the quarter.
TRACY KINJERSKI (VP, BUSINESS OPERATIONS) - OPENING COMMENTS:
During and subsequent to Q1, Avid's business dev. team was extremely active on all fronts. We continued to build visibility with participation at industry events, such as BIO International in June, The Bioprocessing Summit in Boston last month, as well as more local industry events. We are now preparing for the upcoming Biotech Week and Outsourced Pharma conferences. These events offer a particularly efficient forum to meet with potential new customers as well as current clients. With each event, recognition and enthusiasm builds for Avid and its services, and we continue to expand our book of new business as a result of this aggressive visibility campaign.
Also, during the quarter, we began the work of onboarding our newest mfg. projects. As we announced in early July, Avid signed 2 new contract mfg. service agreements to support the development of novel drug candidates during Q1. The agreements include the addition of one of the world's leading pharmaceutical companies to Avid's growing list of customers, as well as the expansion of the relationship with one of the company's existing biotechnology customers. The onboarding processes for both of these projects were initiated during Q1 and they are proceeding well. As a reminder, I'd like to restate the importance of winning new business with existing customers. While some of this business results from the expansion of a current project, much of this new business is from completely new projects, requiring development and/or manufacturing of new molecule. Aside from the revenue generated by the expansion of any relationship, new project wins from existing customers are incredibly valuable for several reasons. Early phase projects represent opportunity for mfg. work up to and including commercial production, onboarding follow-on molecules from existing customers, maybe later-phased, leading to validation in commercial stage with more certainty and providing assurance of need for long-term manufacturing. In addition, as we already have a working relationship with these companies, onboarding and other aspects of the process are much more efficient and less costly making these projects more profitable for Avid.
During Q1, Avid also successfully completed a process validation campaign for a scaled-up mfg. process on behalf of an existing customer in anticipation of future commercial manufacturing. This represents our 1st process validation of FY20, followed by the completion of 2 in FY19. Once the process validation is completed, the associated specifications of that process are incorporated into global regulatory filings. If approved, the customers are then required to manufacture in a specified facility using that specified process. Therefore, for those products approved using processes validated at Avid, it's anticipated that the commercial manufacturing will be conducted at Avid. For this reason, we see each process validation completed today as a great opportunity to build commercial business in the future. This concludes my business overview, and I'll now hand the call back over to Rick.
RICK HANCOCK (CEO) – Q4/FY19 OPERATIONAL & COMMERCIAL UPDATE:
I'd now like to provide a brief update regarding operations at Avid. With respect to our expansion work, we continue to make progress with the process development lab at our Franklin facility. This purpose built state-of-the-art facility will house Avid's expanded upstream & downstream process development capabilities. We remain on track to begin operations in this facility in the fall of calendar 2019. More broadly, we continue the ongoing evaluation of our facilities, equipment, and processes. It is the goal of the organization to optimize where possible, update where necessary, and ensure that we are employing the most effective technologies and processes to ensure our standing as a leading CDMO. As we conduct this review, we are finding areas for improvement. It is always our intent to identify any potential problems before they occur, and to this end, Avid conducts a comprehensive annual maintenance overhaul, during which time, our facilities may be partially or completely shut down. We are currently in the middle of this annual process. Because of the significant amount of work that was done during last year's shutdown, this year will require less downtime. Last year, both facilities were shut down for more than 3 weeks. This year, Franklin was down for less than 2 weeks, and at Myford, we will only have a partial shutdown affecting only the exterior of the building. As a result of our annual maintenance overhaul, we expect anomalies in both revenue and margins during Q2/FY20, but we do not expect this to impact our ability to achieve our stated revenue guidance for the year.
I'll now turn to leadership at Avid. As reported last quarter, the Avid Board has initiated a search for the company's new permanent CEO. Avid is well positioned for expansion and growth, and it is imperative that we find the ideal candidate to entrust with the future strategy and vision for the business. Accordingly, we will take our time with this process and we'll provide an update as there is news to report.
In closing, we recorded revenue that met our expectations for the period, significantly strengthened our backlog, and initiated a number of operational improvements in our facility during Q1 of 2020. Important achievements during the period included the completion of an additional process validation campaign for a customer that anticipates conducting future commercial manufacturing at Avid. The company also entered into 2 new contract mfg. service agreements during Q1, adding one the world's leading pharmaceutical companies to Avid's customer list. These projects are currently in the onboarding process, both of which are proceeding well. We continue to advance discussions with potential new customers and pursue expansion and new project opportunities with existing customers. As we've seen previously, each existing customer has the potential to create multiple new opportunities for growth, and for this reason, we remain committed to providing the best possible customer experience and producing the highest quality products. The highlights for Q1/2020 were new customer contracts, significant backlog growth and another successful process validation. We believe that each of these accomplishments will contribute significantly to the future growth and expansion of the business, and we are eager to build on this momentum. This concludes my prepared remarks for today. We can now open the call up for questions.
Q&A: [beg. 13:50]
1. Paul Knight - Janney
PK: ”And are you at this point with this kind of very strong backlog build, are you able to get better pricing? Are you looking at customer requests that seem, let's call it, more profitable than maybe in past periods in your experience? So can you just talk about the pricing environment for our projects?”
Rick Hancock: Great question, Paul. As you know, we have a unique resource here, in that we can go from early stage process development all the way through commercial. Having the commercial operations adds a certain amount of regulatory compliance & quality oversight to everything that we do here. So, typically, I wouldn't say we're the lowest price provider, but for people who need the types of capabilities that we have, I think we're very competitive in our pricing. But again, we are differentiated from some of the other players in this space who maybe can do early stage development and maybe some very early pre-clinical and early clinical work. But for people who have operational capability, I think, we're very, very fairly priced.
PK: ”With your backlog building to these levels, what's your thought on capacity expansion? We know that you've got space, but when do you start thinking about that part of your capital expenditure program?”
Rick Hancock: We do have tentative plans for building out the remainder of our Myford facility, where we have quite a large area essentially equivalent to what's currently in production right now. We are in active discussion with our clients in terms of when we pull the trigger on that and exactly what capabilities we put in. We are looking at some incremental expansions within that area that will add to our efficiency, but that would be short of building out the entire space. So, we're looking at over the next 12 mos. making some of those incremental improvements, adding some addl. downstream capability. Our focus right now today is really to process dev. area that we're very excited about, bringing that on line, and once that is fully operational, then we'll turn our attention back to our GMP mfg. capabilities.
2. Steve Schwartz - First Analysis
SS: ”Wrt the backlog. Obviously, you've reached a nice level here. But in stating that you expect the majority of the backlog to flow through revenue this year, if we just do simple math, 61 plus 15 for Q1, it leaves you about $10M of the current backlog at the end of FY20. I think that suggests that maybe at a certain point in the year, you kind of hit a peak number, and then maybe you've got some subsequent quarters where the backlog is maybe less than what it is here in Q1 or even in Q2. Can you give us any color maybe on how you expect the new business to flow in vs. what will flow out through the year?”
Dan Hart: Backlog can increase or decrease in any given quarter, depending upon a couple of factors, one of which is how much new business we sign, and how much revenue we recognized during the period. So, backlog isn't necessarily a number that will continue to increase qtr-over-qtr-over-qtr. though that's definitely a challenge for us that we are up to the task. However, it's difficult in saying how much would translate during the period in any given quarter.
SS: ”I understand that. I think, to your comment in the prepared remarks with respect to the shutdown, the Q2 is going to be light, right. And certainly Q1, while it came in as expected was less than 25% of your guidance level. So if we look at the flow of revenue through the year, do you expect that maybe the H1 of FY20 is 40% of total revenue? Is it 35%? Just trying to get a sense of what that Q2 looks like with the shutdowns and then what happens in Q3 & Q4?”
Dan Hart: For the year, we're reaffirming our guidance of $64-67M. And as you pointed out, yes, Q1 was under the 25% mark. So, that being said, we're a capacity business, and as we fill that capacity with revenue through our production, we're going to have some highs and lows in our revenue numbers. So we're still tied to what we're going to do this year, the 64-67M, but not necessarily providing any guidance on a half year or quarterlies.
SS: ”Can you talk a little bit, since it's come up here in this earnings report with respect to comp structure and what have you, where's your business headcount expected to be from the end of FY '19 here in Q1 and then as you move through the year? Are you adding people to the business?”
Rick Hancock: We're not adding terribly significantly. We do need to add a few revenue producing positions in operations, process development, analytical development. Generally, in terms of the overhead positions, we're stable there. So we don't see a very significant increase in headcount; it will be commensurate as we convert the backlog to revenue.
SS: ”Wrt the comp structure and gross margins, can you give me a little bit of color around that? Does your commentary relate to wages and on a unit produced basis costs, or is there a long-term comp component in there? What exactly is that? How do we look at that with respect to gross margin and production levels?”
Dan Hart: When we transitioned this business about 2 years ago from a development company to a pure play CDMO, we went through significant changes and reductions in costs during that process to stabilize the P&L and to move forward with growing a pure play CDMO. So, given the first year, we didn't have a lot of opportunity to provide wage growth or bonus or any of those overall total comp packages to our revenue producing individuals, where in FY20, we're taking the opportunity to provide those costs to those individuals to further on where we're going as far as a business and to align the overall comp structure for the existing workforce.
RICK HANCOCK (CEO) – CLOSING COMMENTS:
Thank you again for participating today, and for your continued support of Avid Bioservices. We look forward to updating you again in the near future.
= = = = = = = = = = = = = = = = = = = = = = = = = = = = = == = = =
9-5-19: Avid Bioservices Reports Financial Results for 1st Quarter FY 2020 (7-31-19) and Recent Developments
GlobalNewsWire: https://tinyurl.com/y4bxmyvw
-- Achieved First Quarter Revenue of $15.3 Million; Reaffirms Fiscal 2020 Projected Revenue of $64 to $67 Million
-- Signed Two Contract Manufacturing Agreements with New and Existing Customers
TUSTIN, Sept. 5, 2019: Avid Bioservices, Inc. (NASDAQ:CDMO/CDMOP), a dedicated biologics contract development and manufacturing organization (CDMO) working to improve patient lives by providing high quality development and manufacturing services to biotechnology and pharmaceutical companies, today announced financial results for the first quarter of fiscal 2020 ended July 31, 2019.
HIGHLIGHTS SINCE APRIL 30, 2019
“During the first quarter of 2020, we recorded revenue that met our expectations for the period, significantly strengthened our backlog and initiated a number of operational improvements in our facilities,” stated Rick Hancock, interim President and CEO. “Despite our topline strength, margins declined during the quarter due to several factors, none of which are expected to impact our stated guidance for the year. These factors include an increase in headcount to accommodate growth in production demand, a realignment of the company’s compensation structure to secure our existing work force, and equipment repairs.“Important achievements during the period included the completion of an additional process validation campaign for a customer that anticipates conducting future commercial manufacturing at Avid. The company also entered into two new contract manufacturing service agreements during the first quarter, adding one of the world’s leading pharmaceutical companies to our customer list. These projects are currently in the onboarding process, both of which are proceeding well. During the period, Avid also announced the appointment of Catherine Mackey, Ph.D. as an independent member to the company’s board of directors. With more than 30 years experience in biopharma research and development, Dr. Mackey brings an important perspective that will allow us to best support the needs of our current, as well as prospective clients. The board is thrilled with Dr. Mackey’s appointment and we look forward to working together toward Avid’s continued growth. The highlights of the first quarter of 2020 were new customer contracts, significant backlog growth and completion of another successful process validation campaign. We believe each of these accomplishments will contribute significantly to the future growth and expansion of the business and we are eager to build on this momentum.”
FINANCIAL HIGHLIGHTS AND GUIDANCE
The company is reaffirming revenue guidance for the full fiscal year 2020 of $64-67 million.
Revenue was $15.3 million for the first quarter of fiscal 2020, a 21% increase compared to $12.6 million for the first quarter of last fiscal year. This increase is primarily due to growing demand from a more diversified client base.
As of July 31, 2019, revenue backlog was approximately $61 million, an increase of 34% as compared to the fourth quarter of fiscal 2019. The company expects to recognize the majority of this backlog in fiscal year 2020.
Gross margin for the first quarter of fiscal 2020 of 7% was down slightly compared to a gross margin of 9% in the prior year period. Despite increased revenue during the first quarter of 2020, gross margin was impacted by hiring personnel to accommodate growth in production demand, a realignment of the company’s compensation structure to secure our existing work force, and equipment repairs that impacted efficiencies during the period. Management does not expect these factors to impact our stated revenue guidance for the year.
Selling, general and administrative expenses (“SG&A”) for the first quarter of fiscal 2020 were $4.5 million compared to $3.2 million for the first quarter of last year. The increase in SG&A was primarily due to employee separation-related expenses, and increased stock-based compensation. Excluding the separation agreement expenses and the increase in stock-based compensation, SG&A during the first quarter of 2020 is consistent with SG&A for the prior year quarter.
For the first quarter of fiscal 2020, the company recorded consolidated net loss attributable to common stockholders of $4.6 million or $0.08 per share, compared to a consolidated net loss attributable to common stockholders of $3.4 million or $0.06 per share, for the first quarter of fiscal 2019.
Avid reported $28.9 million in cash and cash equivalents as of July 31, 2019, compared to $32.4 million on April 30, 2019.
More detailed financial information and analysis may be found in Avid Bioservices’ Quarterly Report on Form 10-Q, which will be filed with the SEC today. [https://tinyurl.com/yxvqm45d ]
Recent Corporate Developments
Signed two new contract manufacturing service agreements to support the development of novel drug candidates. The agreements include the addition of one of the world’s leading pharmaceutical companies to Avid’s growing list of customers, as well as the expansion of the relationship with one of the company’s existing biotechnology customers.
Completed the first process validation campaign of fiscal 2020. Completion of a process validation campaign is a critical step in the regulatory product approval process, and is likely to result in future commercial production at Avid.
Appointed Catherine Mackey, Ph.D. as an independent member to the company’s board of directors. Dr. Mackey is an experienced leader, director and advisor with more than 30 years of R&D and operations experience in the pharmaceutical, biotechnology and agricultural industries, including over a decade in key leadership roles at Pfizer Inc.
CONFERENCE CALL
Avid will host a conference call and webcast this afternoon, September 5, 2019, at 4:30PM EDT (1:30PM PDT). To listen to the conference call, please dial (877) 312-5443 or (253) 237-1126 and request the Avid Bioservices conference call. To listen to the live webcast, or access the archived webcast, please visit: http://ir.avidbio.com/events.cfm .
ABOUT AVID BIOSERVICES, INC.
Avid Bioservices is a dedicated contract development and manufacturing organization (CDMO) focused on development and CGMP manufacturing of biopharmaceutical products derived from mammalian cell culture. The company provides a comprehensive range of process development, high quality CGMP clinical and commercial manufacturing services for the biotechnology and biopharmaceutical industries. With 25 years of experience producing monoclonal antibodies and recombinant proteins in batch, fed-batch and perfusion modes, Avid's services include CGMP clinical and commercial product manufacturing, purification, bulk packaging, stability testing and regulatory strategy, submission and support. The company also provides a variety of process development activities, including cell line development and optimization, cell culture and feed optimization, analytical methods development and product characterization. http://www.avidbio.com
Forward-Looking *snip*
AVID BIOSERVICES, INC.
CONDENSED CONSOLIDATED STATEMENTS OF OPERATIONS AND COMPREHENSIVE LOSS (UNAUDITED)
(IN THOUSANDS, EXCEPT PER SHARE INFORMATION)
Three Months Ended
July 31,
2019 2018
Revenues $ 15,254 $ 12,589
Cost of revenues 14,168 11,397
Gross profit 1,086 1,192
Operating expenses:
Selling, general and administrative 4,459 3,215
Operating loss (3,373 ) (2,023 )
Interest and other income, net 209 62
Net loss $ (3,164 ) $ (1,961 )
Comprehensive loss $ (3,164) $ (1,961 )
Series E preferred stock accumulated dividends (1,442 ) (1,442 )
Net loss attributable to common stockholders $ (4,606) $ (3,403 )
Basic and diluted net loss per common share attributable to common stockholders $ (0.08 ) $ (0.06 )
Weighted average basic and diluted shares outstanding 56,167 55,770
AVID BIOSERVICES, INC.
CONDENSED CONSOLIDATED BALANCE SHEETS
(IN THOUSANDS, EXCEPT PAR VALUE)
July 31,
2019 April 30,
2019
ASSETS (unaudited)
Current assets:
Cash and cash equivalents $ 28,944 $ 32,351
Accounts receivable 8,223 7,374
Contract assets 5,589 4,327
Inventory 8,031 6,557
Prepaid expenses and other current assets 777 709
Total current assets 51,564 51,318
Property and equipment, net 26,453 25,625
Operating lease right-of-use assets 22,601 —
Restricted cash 1,150 1,150
Other assets 302 302
Total assets $ 102,070 $ 78,395
LIABILITIES AND STOCKHOLDERS’ EQUITY
Current liabilities:
Accounts payable $ 5,458 $ 4,352
Accrued payroll and related costs 3,230 3,540
Contract liabilities 18,104 14,651
Operating lease liabilities 1,382 —
Other current liabilities 761 619
Total current liabilities 28,935 23,162
Operating lease liabilities, less current portion 23,451 —
Deferred rent, less current portion — 2,072
Other long-term liabilities — 93
Commitments and contingencies
Stockholders’ equity:
Preferred stock, $0.001 par value; 5,000 shares authorized;
1,648 shares issued and outstanding at July 31, 2019 and
April 30, 2019, respectively 2 2
Common stock, $0.001 par value; 150,000 shares authorized;
56,238 and 56,136 shares issued and outstanding at July 31, 2019
and April 30, 2019, respectively 56 56
Additional paid-in capital 613,395 613,615
Accumulated deficit (563,769 ) (560,605 )
Total stockholders’ equity 49,684 53,068
Total liabilities and stockholders’ equity $ 102,070 $ 78,395
CONTACTS:
• Stephanie Diaz (Investors) Vida Strategic Partners 415-675-7401 sdiaz@vidasp.com
• Tim Brons (Media) Vida Strategic Partners 415-675-7402 tbrons@vidasp.com
- - - - - - - -
From 10-Q header: “As of Aug 31, 2019, there were 56,237,674 shares outstanding.”
- - - - - - - - - - - - - - - - -
Latest 10K 4-30-19 iss. 6-27-19 http://tinyurl.com/yxukx6t4 PR: http://tinyurl.com/y2k3tftn (Cash 4-30-19=$32.4mm)
Latest 10Q 7-31-19 iss. 9-5-19 https://tinyurl.com/yxvqm45d PR: https://tinyurl.com/y4bxmyvw (Cash 7-31-19=$28.9mm)
ALL SEC filings for PPHM: http://tinyurl.com/6d4jw8
10-K: “As of 4-30-19, we employed 211 full-time & 4 part-time emps.” (2018: 185/1)
= = = = = = = = = = = = = = = = = = = = = = = = = = = =
Updated PPHM REVS-BY-QTR TABLE, now thru FY20Q1(qe 7-31-19), per the 10Q (http://tinyurl.com/yxukx6t4 ) issued 9-5-19.
• Total Avid Revs since May’03: $364.4M
• 9-5-19: FY'20 (May'19-Apr'20) Avid revs guidance $64-67M (committed B/L=$61 at 7-31-19).
• Inventories at 7-31-19 total $8.0M, UP from $6.6M at 4-30-19.
Avid’s website: http://www.avidbio.com
 AVID GROSS PROFITABILITY BY QTR:                   CONTRACT
 QTR  (1000’s)      Rev$  COGS$  Prof$  GP% INVEN$ LIABILITIES*
 FY13Q1  7-31-12   4,135  2,024  2,111  51%  5,744   16,280
 FY13Q2 10-31-12   6,061  3,703  2,358  39%  5,426   14,721
 FY13Q3  1-31-13   6,961  3,651  3,310  47%  4,635   11,790
 FY13Q4  4-30-13   4,176  3,217    959  23%  4,339   12,230
 FY14Q1  7-31-13   4,581  2,670  1,911  42%  5,679   12,692
 FY14Q2 10-31-13   7,354  4,195  3,159  43%  4,033   11,126
 FY14Q3  1-31-14   3,885  2,416  1,469  38%  5,224   12,975
 FY14Q4  4-30-14   6,474  3,829  2,645  41%  5,530   11,001
 FY15Q1  7-31-14   5,496  3,583  1,913  35%  5,998   10,896
 FY15Q2 10-31-14   6,263  4,139  2,124  34%  5,379   11,161
 FY15Q3  1-31-15   5,677  3,113  2,564  45%  6,148   14,063
 FY15Q4  4-30-15   9,308  4,758  4,550  49%  7,354   17,993
 FY16Q1  7-31-15   9,379  4,608  4,771  51% 10,457   17,890
 FY16Q2 10-31-15   9,523  4,741  4,782  50% 12,554   24,623
 FY16Q3  1-31-16   6,672  3,896  2,776  42% 15,189   37,851
 FY16Q4  4-30-16  18,783  9,721  9,062  48% 15,189   39,630
 FY17Q1  7-31-16   5,609  3,062  2,547  45% 25,274   43,262
 FY17Q2 10-31-16  23,370 15,441  7,929  34% 25,924   44,908
 FY17Q3  1-31-17  10,747  7,974  2,773  26% 33,829   52,577
 FY17Q4  4-30-17  17,904 11,782  6,122  34% 33,099   45,517
 FY18Q1  7-31-17  27,077 20,448  6,629  24% 24,235   27,755
 FY18Q2 10-31-17  12,782 16,242 -3,460 -27% 16,518   20,611
 FY18Q3  1-31-18   6,819 10,951 -4,132 -61% 14,218   24,235
 FY18Q4  4-30-18   6,943  8,904 -1,961 -28% 16,129   27,935
 FY19Q1  7-31-18  12,589 11,397  1,192   9%  9,168   17,994
 FY19Q2 10-31-18  10,178  9,844    334   3%  9,736   17,307
 FY19Q3  1-31-19  13,781 11,731  2,050  15%  8,660   14,620
 FY19Q4  4-30-19  17,055 13,407  3,648  21%  6,557   14,651
 FY20Q1  7-31-19  15,254 14,168  1,086   7%  8,031   18,104
 *7-31-18 10Q: “prior-yr amts related to (deferred revenue
 + cust deposits) now reclass’d as contract liabilities.”

 FY13 TOTAL:      21,333 12,595  8,738  41%*
 FY14 TOTAL:      22,294 13,110  9,184  41%*
 FY15 TOTAL:      26,744 15,393 11,151  42%*
 FY16 TOTAL:      44,357 22,966 21,391  48%*
 FY17 TOTAL:      57,630 38,259 19,371  34%*
 FY18 TOTAL:      53,621 56,545 -2,924  -5%*
 FY19 TOTAL:      53,603 46,379  7,224  13%*
 *Avid Net-Profit(Selling/G&A) not split out from PPHM-Corp. in the fin’s.

 AVID TOTAL REV’s BY YEAR):
 FY04 4-30-04   3,039 (Avid-Revs didn’t incl. Avid’s Gov’t work)
 FY05 4-30-05   4,684
 FY06 4-30-06   3,005
 FY07 4-30-07   3,492
 FY08 4-30-08   5,897
 FY09 4-30-09  12,963
 FY10 4-30-10  13,204
 FY11 4-30-11   8,502
 FY12 4-30-12  14,783
 FY13 4-30-13  21,333
 FY14 4-30-14  22,294
 FY15 4-30-15  26,744
 FY16 4-30-16  44,357
 FY17 4-30-17  57,630
 FY18 4-30-18  53,621
 FY19 4-30-19  53,603
 FY20 4-30-20  15,254 <=thru Q1 7-31-19
 **TOTAL:     364,405 (5/1/2003–7/31/19)
 .
 QTLY. NET PROFIT/LOSS BY QTR:
 (“attributable to common stockholders”; ie, incl. PREF Div’s**)
 **2-11-14: PPHM Raises $16.2M, 700k Pref. Shares w/10.5% DIV.
 FY16Q1  7-31-15 -15,101,000
 FY16Q2 10-31-15 -14,578,000
 FY16Q3  1-31-16 -18,227,000
 FY16Q4  4-30-16 -13,264,000
 FY17Q1  7-31-16 -12,437,000
 FY17Q2 10-31-16  -4,498,000
 FY17Q3  1-31-17  -9,216,000
 FY17Q4  4-30-17  -6,714,000
 FY18Q1  7-31-17  -2,647,000
 FY18Q2 10-31-17 -14,066,000
 FY18Q3  1-31-18 -12,446,000
 FY18Q4  4-30-18  +1,578,000 <=includes $9,154,000 income from disc. operations.
 FY19Q1  7-31-18  -3,403,000
 FY19Q2 10-31-18  -2,893,000
 FY19Q3  1-31-19  -2,581,000
 FY19Q4  4-30-19  -1,106,000
 FY20Q1  7-31-19  -4,606,000

 Period        Halozyme ADC-Therap. Coherus-BioSci. Other-Custs
 FYE  4-30-14     91%                                    8%
 FYE  4-30-15     79%                                    9%
 FYE  4-30-16     69%                     26%            5%
 FYE  4-30-17     58%                     26%           16%
 FYE  4-30-18     55%      9%             22%           14%
 FYE  4-30-19     30%     21%             13%           36%
 ...(cust. splits not given in 7-31-18+ 10Q’s)
Total INST.+LARGE Holdings now 35,952,779 64.0% (6-30-19)
Up from 33,480,083 59.7% at 3-31-19.
24,159,237 43.0% INSTITUTIONS (a/o 6-30-19)
https://www.nasdaq.com/symbol/cdmo/institutional-holdings
+ 11,793,542 21.0% LARGE SHAREHOLDERS via Forms13/14 (Tappan, EasternCap/Dart, Ronin/Stafford) – ie, not in Nasdaq Inst. List.
I’m not sure about Eastern Cap(K.Dart) and Ronin(Stafford/Farley) - no updates since 12-2017 & 4-2018 respectively. I’m assuming that means NO CHG.
------------
= 35,922,756 64.0%
Note: Ownership %’s based on 56,137,724 common O/S at 6-14-19. (10K: http://tinyurl.com/yxukx6t4 )
9 LARGEST SHAREHOLDERS:
1. Tappan Street (Prasad Phatak): 4,854,100 8.7% (+337,993 a/o 12-31-18 13G: http://tinyurl.com/yxrpla3b )
2. IsZo Capital Mgt. (Brian Sheehy): 4,778,123 8.5% (+1,532,748 a/o 6-30-19 Nasdaq Inst.)
3. Eastern Capital (Kenneth Dart): 4,300,992 7.6% (a/o 12-7-17 14A: https://tinyurl.com/y7qprpg9 acq. 10-2015)
4. Blackrock Inc. (Larry Fink): 3,790,286 6.8% (+266,015 q/e 6-30 Nasdaq Inst.)
5. Ronin Trading (John Stafford III+Roger Farley): 2,638,450 4.7% (a/o 4-17-18 13D: https://tinyurl.com/ycf7d2uk )
6. Vanguard Group 2,676,002 4.8% (+19,667 q/e 6-30-19 Nasdaq Inst.)
7. Snyder Capital 2,242,292 4.0% (-111,525 a/o 6-30-19 Nasdaq Inst.)
8. Altravue Capital 2,108,812 3.8% (+133,337 a/o 6-30-19 Nasdaq Inst.)
9. State Street 939,873 1.7% (+75,776 a/o 6-30-19 Nasdaq Inst.)
BIGGEST DROPS q/e 6-30-19:
Schonfeld Strategic Advisors -442,600 Sold Out
Roubaix Capital -488,600 Sold Out
= = = = = = = = = = = =
Shares O/S as of 6-14-19=56,137,724 - history since 4-2006: https://tinyurl.com/y6zdjyu2
...A/O 4-30-19: 3,274,215 stock options outstanding at a wgt.avg. exercise price of $7.51 (pg.32 10K).
6-27-19: Qtly. Conf. Call (Hancock/Hart/Kinjerski) PR & Transcript https://tinyurl.com/y6zdjyu2
...Rick Hancock, "Most importantly, during Q4, the Company achieved positive income, generating cash from dev. & mfg. operations for the 1st time since the beginning of the CDMO transition (Jan'18)."
6-27-19 Qtly CC-Transcript, PR(Q4FY19/fye4-30-19), Avid Revs History Table
*Revs Guidance (FY’20 fye 4-30-20): $64-67M. 4-30-19 Backlog=$46M
*Cash: 4-30-19: $32.4M
*As of 6-14-19: 56,137,724 shares o/s.
*10K/4-30-19 iss. 6-27-19: http://tinyurl.com/yxukx6t4
*Avid Total Revs May03-Apr19: $349.2M
*Avid’s website: https://avidbio.com (A/o 4-30-19, 211 full-time & 4 part-time emps)
This large post has 4 sections:
I. 6-27-19 Qtly. Earnings Conf. Call TRANSCRIPT (FY19/Q4 fy/e 4-30-19)
II. 6-27-19 CDMO Press Release: Q4/FY19 Earnings & Developments
IV. Updated Table of Avid Revenues By Quarter (May’06-Current)
III. Updated O/S Shares History Table – 2006-curr.
…Recall: Avid’s FY runs May-Apr, so FY’20 = May’19-Apr’20.
((( Orig. transcript from SeekingAlpha.com [http://tinyurl.com/y3yhke8q ] with numerous corrections made. )))
Link to webcast replay: http://ir.avidbio.com/events-and-presentations => https://edge.media-server.com/mmc/p/hquga2x5
TRANSCRIPT 6-27-19 FY’19/Q4 Earnings Conf. Call (fy/e 4-30-19) (Hancock/Hart/Kinjerski)
RICK HANCOCK (CEO) – OPENING COMMENTS:
Thank you to all of you who've dialed in and to those who are participating today via the webcast. Since this is my first earnings call in this role with Avid, I would like to say that I'm very pleased to be working closely with our team as we continue to transition the business and build upon the accomplishments of my predecessor, Roger Lias. I am particularly pleased to have the opportunity to discuss the achievements of Q4 FY2019, Avid's strongest quarter since becoming a dedicated CDMO. With respect to our financial performance, Q4 2019 results beat industry estimates for both revenue & EPS. Most importantly, during Q4, the Company achieved positive income, generating cash from development & mfg. operations for the 1st time since the beginning of the transition. The growth realized during the quarter was reflected in other metrics as well, and Dan will provide more details regarding our financial performance in a moment. Multiple successes on the business development front drove the quarter's strong financial performance. In Q4, our BD team advanced new business opportunities and won multiple new projects with existing customers. Though these new projects are with existing customers, many are for the development and manufacture of additional molecules, which were not part of the initial contract. Each of these programs represents a new opportunity for commercial production down the road. Tracy will provide more color on these developments shortly. With that, I'll turn the call over to Dan to provide a financial overview.
DANIEL HART (CFO) – OPENING COMMENTS:
Before I begin, I'd like to recommend that everyone participating today refer to our 10-K filing with the SEC, which we filed today for additional details. [10-K: http://tinyurl.com/yxukx6t4 ] I will now discuss our financial results from continuing operations for Q4 ended April 30, 2019, starting with revenue. As Rick stated, Q4 was our strongest to-date since officially beginning the transition to a dedicated CDMO. Revenue for Q4 of 2019 was $17.1M, an increase of 146% as compared to $6.9M for the same period of the prior year. This increase was primarily the result of the growing in the number and scope of customer projects. Revenue for the full FY 2019 was $53.6M. And while that was flat compared to FY2018, it exceeded our guidance, which we had expected to come in within the lower half of the range of $51-55M. For both Q4 and the full FY 2019, margins increased significantly as compared to prior year period. Gross margin for Q4 was 21% and gross margin for the full FY 2019 was 13%. These margins are compared to a negative -28% for Q4 of 2018 and a negative -5% for FY2018. These increases reflect the growth in customer projects, the increased utility of our existing capacity, a judicious management of expenses, and increasing operational efficiencies.
Turning now to operating expenses. Total SG&A expenses for Q4 of FY2019 were $3.6M compared to $4.2M for Q4/FY2018. For the full FY 2019, total SG&A expenses were $12.8M or 24% of revenue compared to $16.5M or 31% of revenue for the full FY 2018. It's important to note that SG&A results for the prior year included non-recurring expenses of approx. $4.4M related to the transition of our business to a pure-play CDMO. These prior year expenses included reductions in payroll & related costs, legal fees and other professional consulting fees, administrative costs, and the write-off related to a deposit of capital equipment. Excluding these non-recurring charges, SG&A increased $.8M, primarily due to increases in bonuses related to achievement levels of corporate goals and stock-based compensation.
During Q4/2019, we generated income from continuing operations of $.2M compared to a loss from continuing operations of $6.1M for Q4 of FY2018. This marks the 1st qtr. of positive income from continuing operations since announcing our transition to a dedicated CDMO back in January of 2018. FY 2019 loss from continuing operations was $5.1M compared to a prior year loss from continuing operations of $20.6M. The decrease during the full FY was partially driven by reduction in both costs of revenues and SG&A resulting in higher profitability margins. For Q4 of FY2019, the Company recorded consolidated net loss attributable to common stockholders of $1.1M or $.02 per share compared to a consolidated net income attributable to common stockholders of $1.6M or $.03 per share for the same prior year quarter. For the full year FY2019, the Company recorded a consolidated net loss attributable to common stockholders of $8.9M or $.16 per share compared to a consolidated net loss attributable to common stockholders of $26.5M or $.56 per share for full year FY2018. Both the prior Q4 and the full FY 2018, net income and loss were favorably impacted by the sale of Avid's legacy R&D assets to Oncologie, Inc. for $8M and the associated discontinued operations.
Our backlog at the end of Q4 2019 [4-30-19] was approx. $46M, an increase compared to backlog of $43M at the end of Q3 2019. We are pleased to maintain the strong backlog that will continue to contribute to our growth trend, and we expect to recognize the majority of this balance in FY2020. Lastly, during Q4 of FY2019, we generated $5.6M in operating cash flow, thus, increasing our cash & cash equivalents as of April 30, 2019 to $32.4M. Cash & cash equivalents were $42.3M as of the prior FY ended April 30, 2018. As we stated consistently throughout the last year, achieving positive income from continuing operations has been a major milestone for the Company. By aggressively pursuing and winning new business from existing clients, carefully managing cash and expenses, and consistently incorporating new efficiencies into our processes, we have successfully delivered on this goal. Based on our current backlog, as well as our forecast for typical expansion of ongoing projects, we believe the Company has reached the very important position from which they expect to achieve sustainable growth and continued profitability. This concludes my financial overview. I will now turn the call over to Tracy for an update on business activities and achievements for the quarter.
TRACY KINJERSKI (VP, BUSINESS OPERATIONS) - OPENING COMMENTS:
During Q4, Avid's increased visibility in industry and our aggressive work to expand both our client base, as well as our project pipeline, yielded great dividends. During the quarter, we had a strong presence at several of the industry's best attended events & conferences, including but not limited to, DCAT Week and Interfax. As the quarter was coming to an end, we were heavily focused on our preparation for the 2019 BIO Intl. Convention, which commenced subsequent to quarter end. Part of this conference was to further build our brand awareness and messaging in the bio therapeutics industry, while also meeting with current and potential new customers and sponsoring and supporting key industry organizations, such as DCAT and Women In Bio. As a result of this continuous exposure, as well as our customer outreach efforts, our log of new business discussions continues to grow. As evidenced by the high number of key meetings and conferences and subsequent influx of new request for proposals, we are gaining important traction with potential for customers and industry partners. Equally important, as we believe today's financial results have demonstrated, is the new business we continue to win with the existing customers. While some of these business results from the expansion of a current project, many of these projects are completely new, requiring development and or manufacture of new molecules. These wins are incredibly valuable for several reasons. First, the earlier phase projects represent opportunities for both early stage, as well as commercial production as the program advances through the various regulatory stages. Other follow-on molecules from existing customers may be later phase, leading to validation and commercial stage with more certainty and providing assurance of need for long-term manufacturing. Second, as we already have a working relationship with these companies, on-boarding and other aspects of the process are much more efficient and less costly, making these projects more profitable for Avid. And finally, the repeat business is a great testimonial for Avid. The fact that many of our clients have come back from multiple projects speaks to the collaborative relationships we established with our clients, the expertise of our team, the state-of-the-art nature of our facilities and processes and most importantly, the quality of our product.
I would now like to provide an update with respect to one of our largest customers. Halozyme Therapeutics continues to increase demand for manufacture of the recombinant human hyaluronidase enzyme, supporting their ENHANZE technology platform. Avid currently manufactures product not only for Halozyme's collaboration products, but also for collaboration product candidates currently in development. We believe that the strengthened forecasts are partially due to a key Halozyme partner for whom Avid is the exclusive supplier depleting their inventories. More importantly, this demand is also driven by new development projects and new product launches by Halozyme's partners, as well as market growth for their commercial products. We anticipate that this trend will continue into FY 2020 as Halozyme's partners advance their clinical dev. program and begin preparing for commercialization. As we discussed last quarter, Avid recently completed a process validation campaign for a new scaled up mfg. process on behalf of Halozyme in anticipation of future commercial manufacturing. In addition, we have recently completed a 2nd process validation campaign of FY2019, with another campaign in progress. Once the process validation is completed, the associated specifications for that process represents a key part of global regulatory filings. The mfg. process becomes part of the product approval and the consumers required to manufacture in specified facility using the specified process. Of course clinical trials & regulatory reviews take years, and there's no guarantee of a drug approval at the end of the process. However, for those products approved using processes validated at Avid, it’s likely that the commercial manufacturing will be conducted at Avid. To move the business to another CDMO at that point would require a new process validation and re-filing with the regulatory agency, which are highly risky, expensive and time consuming propositions. For these reasons, we see each process validation completed today as a great opportunity to build commercial business in the future.
We remain very excited about the demand in the biopharmaceutical community in general, and with our regulatory history, we believe we are uniquely positioned to serve clients who are developing products with accelerated approval time lines. Importantly, the strategy allows us to support rare-disease product development partners. As a CDMO, our aim is to support our clients to ensure availability of medicines for all regardless of the size of the patient population. The flexibility is built into our facility configuration and design, combined with the mindset of our leadership continues to foster this goal. During the year, our business dev. and project mgt. team members set and met the high standards essential to our customer-centric approach. Looking forward, we are excited by the new and expanding opportunities that we expect to fuel continued growth and increasing capacity utilization in FY2020. This concludes my business overview. And I'll now hand the call back to Rick.
RICK HANCOCK (CEO) – Q4/FY19 OPERATIONAL & COMMERCIAL UPDATE:
Thank you, Tracy. I would also like to congratulate the business operations team on its accomplishments during FY2019. The new business won in the past year has put Avid in a stronger position to continue its growth trajectory. I'd now like to provide a brief update regarding operations at Avid. We continue to make progress with the expansion of the Franklin process dev. lab, which will primarily house upstream processing. It is currently our expectation that this work will be completed in the fall. Concurrent with this work, we are evaluating all of our facilities, equipment, and processes as part of a 3-year plan in an effort to incorporate additional efficiencies where possible and new technologies where applicable. This ongoing process is essential in ensuring that Avid's processes remain at the forefront of development and manufacturing, and that our facilities represent the state-of-the-art among CDMOs. All these enhancements are taking place to improve our existing Franklin & Myford facilities. We have significant room to expand our operations and anticipate doing so as demand for our services continues to increase. Until then, we will remain focused on filling and optimizing our existing capacity.
I'll now turn to leadership at Avid. I recently stepped into serve as Avid's Interim President & CEO, following the departure of Roger Lias last month. Given my 20 years of experience in the CDMO sector and my tenure on Avid's board, I am thrilled that the opportunity to assume temporary leadership at this exciting time of growth and transition. The Avid board has initiated a search for the Company's new permanent CEO. Having said that, we are being very deliberate in this crucial process, we recognize the significant progress that has been made to date at Avid. And we will take our time to find the ideal candidate to lead the Company to ongoing success. We do not have a timeline for this process. We'll update you as there is news to report.
In closing, I'd like to emphasize that during FY2019, the Avid team successfully achieved the most critical goals for the business. Most notably, we converted the losses and negative margins this FY2018 into a sustainable position of financial strength and operational profitability. And we expect to continue revenue growth, moving forward. With respect to business development, the 5 new clients signed in late FY2018, contributed significantly to revenue diversification in FY2019. These projects substantially increased capacity utilization, which drove a meaningful improvement in margins during the year. Avid is stronger today than it has been at any point in its history. For that, we offer our sincere thanks to Roger Lias who led the transition from a drug dev. company to a leading and profitable CDMO. Looking ahead, we will continue to execute according to plan with even higher goals for revenue and new customer projects. As in FY2019, we expect to continue to achieve great successes in the coming years. With that, I'm happy to announce that for FY2020, we expect to record revenue of $64-$67M, representing growth of approx. 20-25% over FY2019. And as we continue to achieve revenue growth, we expect the improvement in margins to track accordingly. Thank you to all of our investors, industry colleagues and friends who have continued to support Avid during its transition. But most importantly, I'd like to offer a big thank you to the entire Avid team. Our employees work tirelessly and diligently to make Avid the best CDMO it can be. It is because of their unwavering commitment to excellence that I am confident in Avid's growth potential and very excited about the successes that lie ahead.
Q&A: [beg. 20:01]
1. Joe Pantginis - H.C. Wainwright
JP: ”First, just curious with the 5 new clients that were signed in late FY2019. Can you talk about what the mix is? Are they all early stage for process dev. and early process development?”
Tracy Kinjerski: As you mentioned there, there are several projects that we signed and they vary. Some of those projects came in immediately from cell-line development stage, so they are very early on. And we also had at least one project that came in that was more at the Phase II stage. So that pretty much covers it. So, a pretty good range when you look at those customers. And yes, just to reiterate, those customers were signed in late FY2018.
JP: ”Re: backlog increasing and your prepared comments talking about the facilities that you already have with regard to Franklin & Myford. What is a trigger number, if you will, that will allow you to then actively extend your capacity?”
Dan Hart: Appreciate the question. The backlog is a little tricky, because as we've discussed in the past, the backlog is only the signed contractual firm relationship that we have with the clients. It's not the entirety of our opportunity pipeline and any work that we see from our customer forecast. So, it just depends on the overall operation and financial forecast that we're looking at from our customers, not necessarily just the backlog number that is reported.
JP: ”And, when you talk about the backlog number, you did remind us obviously that it's the signed contractual work. So what else does the number not include?”
Dan Hart: The programs that we're running for our clients, they run multiple months, multiple quarters, multiple years. And those forecasts that we have from our clients, we can see as to where that particular project or program is going. However, contractually, we may only sign up for some limited portion of that entire program.
JP: ”Understood. Thanks a lot for the extra detail.”
2. Paul Knight - Janney
PK: ”I think you were considering expanding the sales force. Where are you with those efforts? What do you want to do for starters on that?”
Rick Hancock: We do have one current opening for a sales rep, and Tracy and her team are continuing to evaluate where to put addl. resources. Tracy has built a very, very strong internal business operations team, and they hand some of the activities that might normally be handled by external sales reps. So, we don't feel that we need a tremendous number of field representatives at this time to cover our industry, but we are monitoring that, so looking for people, field representatives to be focused in the hubs of biotech activity.
PK: ”Dan, is there a change in the way you're recognizing or reporting backlog? You're talking about it being in the next 12mos. But is your recording of it any different than you've done in the past? Is it a more conservative approach or no change? And then secondly, how do you want us to think about rolling out revenue quarters in the new FY?”
Dan Hart: As far as your first question on backlog, there's no change into how we account for or report our backlog. So, the cadence of that backlog is merely a factor of, if you're looking at it period-over-period, the beginning balance, if you take out any revenue, you recognize in anything that we've signed yet back to it. There's no difference as far as the content of that backlog, it's all based on contractual relationships.
As far as your 2nd question, we're not necessarily giving a qtr-over-qtr guidance as far as what that revenues looks like. But as we've said in our prepared remarks, the guidance that we're providing for FY2020 is $64-$67M.
PK: ”And Rick, if you could talk to business conditions now, customer interest, customer inquiries. How was it now vs. one year ago? Is it better, expanded? What's the tone of customer and demand right now?”
Rick Hancock: Great question. It remains extremely strong. As Tracy mentioned, we were just at BIO2019 recently. And our customers and our potential customers, we had quite a number of meetings. They continue to be very healthy. They're able to access the funds that they need to bring innovative molecules to the market, and we continue to be in a sweet spot for where a lot of those drugs are being developed. So not really huge blockbuster products, but more niche orphan indications and follow-along biosimilars that really fit very well with our capacity. And as Tracy mentioned in her remarks, quite a number of those products move through the clinical dev. process very quickly. So having a CDMO with a commercial history is very critical. We see the industry as very, very strong at this point, a lot of antibodies and other mammalian derived proteins being developed from early research all the way through later clinical trials and moving towards approval.
PK: ”And then my last question, what are the 2 or 3 things that customers you think are finding most appealing about your offering? Is it you can do early-stage work? Is it your physical location? What do you think are the key touch points that customers are liking?”
Rick Hancock: I think first and foremost, it's our tremendous regulatory history. That's one of the key differentiators that makes Avid unique compared to a lot of other people who can develop mammalian proteins. So, the number of years that we've had a commercial experience, the number of countries that we have approval for, that really sets us apart. And then as you hit on, I think the ability to take projects from early phase dev. up through clinical trials and rapidly to commercialization is very attractive. The flexibility in our platforms and the expertise and process development, in regulatory, in quality and of course in manufacturing. In terms of geography, which you mentioned, that is just something that does help us with the Bay Area, Seattle, San Diego clients in the Los Angeles area. Certainly, being in the same time zone when we have a person in the plant and we're doing production, they can just fly down from San Francisco, be here for the day and fly back. So that is very attractive. We also do get quite a bit of work in the east coast as well, and those people love to come out to beautiful southern California, particularly in the winter. So, we use our geography as a strong advantage. So, I'd say it's a combination of those factors but really one of our keys I think is our regulatory history.
3. Steve Schwartz - First Analysis
SS: ”Re: backlog, in the press release, you note $19.7M from existing customers, and I think as you stated in one of your early responses, you’re back up to $17.1M in revenue book. It looks like you've added $2.6M to the backlog from existing customers with the $3M difference. Does that mean there's about $400,000 added to the backlog from new customers? Am I reading those numbers right?”
Dan Hart: No, Steve, I’ll help and clarify that. We began Q4 with backlog of $43M. And during the quarter, we recognized $17.1M of revenue. In addition, we signed addl. contractual relationships with existing customers of $19.7M. So, adding those 3 numbers together is where we end up at our $46M backlog at the end of April.
SS: ”But then that would suggest that the backlog add from $43M to $46M was all from existing customers?”
Dan Hart: That's right.
SS: ”Okay, that clarifies it. Now, re: roll out of revenues across the year; it would really be helpful. There is really no way you can tell us maybe what the H1 looks like vs. H2? Should we just presume like 50:50? Is it more like 40:60?”
Dan Hart: Steve, we're not giving quarterly guidance at this point. All that I can tell you is that our annual is $64-67M.
SS: ”In Tracy's prepared remarks talking about the validations. In FY19, you did 2 process validations. It sounds like the 1st one was for Halozyme and then the 2nd was not, or was that also a Halozyme process?”
Tracy Kinjerski: Yes, there was only one for Halozyme.
SS: ”And then the one that's underway for FY'20 is not Halozyme either. Is that correct?”
Tracy Kinjerski: It is not, that's correct.
SS: ”There's really no way for us to get a sense of when that might transform itself into revenue from validation to actual production. Is that correct?”
Tracy Kinjerski: To commercial, right. We really need to wait for the filings and the approval of the inspections, et cetera.
Rick Hancock: Right. Essentially all of those activities are beyond our control.
SS: ”Re: gross margins, there was a very nice improvement in FY'19 and in the release, you stated a couple of reasons behind that. I just want to make sure I understand with respect to product mix. You are starting to present these numbers in the filings, but if you could just talk about it. When you refer to mix, is it the mix between development work vs. production work? Is it a mix of what's going through actual production? Can you give us a little color around that?”
Dan Hart: It's all of the above. In addition to that, it's also the type of effort, whether it's just the service or service includes materials. And also based on the type of work that we're doing, if we're doing analytical development or if we're doing straight up manufacturing, in addition to the scale of the manufacturing is also different in that type of margin. So, it's all of the above.
SS: ”And then how was that you saw the reduction in direct mfg. cost? Is that sustainable? Or was it just within the quarter?”
Dan Hart: No, that overall reduction was essentially a change that we went through near the end of last year into this year. So going forward, we won't see significant reduction such as that, though, we'll continue to focus on cost control and looking at spending wisely, just anything that's affecting our gross profit margins, but that was as we transitioned into a pure-play CDMO.
SS: ”And then my last question is around SG&A. You saw significant reduction in FY'19. What should we expect going forward for FY'20? I mean, there's going to be $.5M in there paid out to Roger, right?, so there you're going to have like a double CEO salary that's going to be in there. But aside from that, is there anything else we need to be aware of, considering the big gap between FY'18 & FY'19?”
Dan Hart: Steve, what we've said in the past that still holds true is we don't see any significant increases in SG&A. We're not at a point where we need to add a bunch of headcount or any other type of operational costs within SG&A. We can fully leverage that. We'll see some growth as the business grows, but it's not going to be anywhere near the growth of the revenue rate or cost of sales.
SS: ”Yes, OK, fantastic. Well, very nice quarter everyone, nice to see the inflection coming through here.”
Dan Hart: Thank you, Steve.
RICK HANCOCK (CEO) – CLOSING COMMENTS:
Thank you, again for participating today. And thank you for your continued supportive of Avid Bioservices. We look forward to updating you again in the near future.
= = = = = = = = = = = = = = = = = = = = = = = = = = = = = == = = =
6-27-19: Avid Bioservices Reports Financial Results for 4th Quarter and FY Ended April 30, 2019 and Recent Developments
GlobalNewsWire: http://tinyurl.com/y2k3tftn
-- Achieved Q4 Revenue of $17.1 Million, an Increase of 146% Compared to Prior Year Quarter
-- Generated Income From Continuing Operations During the Fourth Quarter of FY 2019
-- Increasing Demand from Customers Expected to Drive Continued Revenue Growth into 2020
TUSTIN, June 27, 2019 (GLOBE NEWSWIRE): Avid Bioservices, Inc. (NASDAQ:CDMO/CDMOP), a dedicated biologics contract development and manufacturing organization (CDMO) working to improve patient lives by providing high quality development and manufacturing services to biotechnology and pharmaceutical companies, today announced financial results for Q4 and full year of FY 2019 ended April 30, 2019.
HIGHLIGHTS SINCE JANUARY 31, 2019
“FY 2019 was a fundamentally transformative year for Avid, as the team successfully achieved a number of critical goals. Most notably, we converted the losses and negative margins in FY 2018 into a sustainable position of financial strength,” stated Rick Hancock, interim President and CEO. “Based on our current backlog as well as forecasts from our customers, we believe the company will achieve sustainable growth going forward. Avid is stronger today than it has been at any point in the past. With respect to business development, the 5 new clients signed in late FY 2018 contributed significantly to revenue diversification in FY 2019. These projects substantially increased capacity utilization, which drove a meaningful improvement in margins during the year. Of particular note is the new business we continue to win from existing customers. While some of this business results from the expansion of current projects, many of these projects are completely new, requiring development and/or manufacture of a new molecule. These ‘repeat business’ wins are particularly valuable to Avid as each offers the opportunity for later stage and commercial production, they generally onboard very efficiently and as a result are more profitable, and they provide strong testimonials as to the quality of our work and product.”
”Avid finished the year with a strong Q4, growing revenue to $17.1 million while increasing gross margins to 21%,” said Dan Hart, CFO. “During Q4 we generated $5.6 million in operating cash flow increasing our net cash and cash equivalents by $4.6 million to $32.4 million. Looking ahead, we are encouraged by the forecasted increase in demand which we expect to strengthen the company’s overall financial standing and position us for profitability.”
FINANCIAL HIGHLIGHTS AND GUIDANCE
* The company is providing revenue guidance for the full FY 2020 [May’19-Apr’20] of $64-67M (ASC 606).
* Revenue was $17.1 million for Q4 of FY 2019, a 146% increase compared to $6.9 million for Q4 of last fiscal year. This increase is primarily due to growing demand from a more diversified client base. Revenue for the full FY 2019 met guidance at $53.6 million, and was flat compared to full FY 2018.
* As of April 30, 2019, revenue backlog was approximately $46 million, the majority of which is expected to be recognized in FY 2020.
* Gross margin for Q4 of FY 2019 was +21%, and gross margin for full FY 2019 was +13%, both representing significant improvements compared to gross margins of negative -28% during Q4 of FY 2018 and negative -5% for full FY 2018. The improvements in gross margins for both FY 2019 periods were primarily attributed to our product mix, increased capacity utilization and a reduction in direct mfg. costs.
Selling, general and administrative expenses (“SG&A”) for Q4 of FY 2019 were $3.6 million, or 21% of revenue, compared to $4.2 million, or 60% of revenue, for Q4 of last year. For full FY 2019, total SG&A expenses were $12.8 million, or 24% of revenue compared to $16.5 million last fiscal year, or 31% of revenue. The decrease in SG&A was primarily due to a reduction in payroll and related costs, legal fees and other professional consulting fees, and facility costs, which were partially offset by increases in bonuses related to certain achievement levels of corporate goals and stock-based compensation.
During Q4 of FY 2019 we generated income from continuing operations of $.2 million compared to a net loss from continuing operations of $6.1 million for Q4 of FY 2018. FY 2019 loss from continuing operations was $5.1 million compared to a prior year loss from continuing operations of $20.6 million. The decrease during the full fiscal year was primarily due to reductions in both cost of revenues and SG&A resulting in higher profitability margins.
For Q4 of FY 2019, the company recorded consolidated net loss attributable to common stockholders of $1.1 million or $.02 per share, compared to a consolidated net income attributable to common stockholders of $1.6 million or $.03 per share, for Q4 of FY 2018. For full FY 2019, the company recorded a consolidated net loss attributable to common stockholders of $8.9 million or $.16 per share, compared to a consolidated net loss attributable to common stockholders of $26.5 million or $.56 per share, for full FY 2018. For both Q4 and full FY 2018, net income and loss were favorably impacted by the sale of the company’s legacy R&D assets to Oncologie, Inc. for $8.0 million and the associated discontinued operations.
Avid reported $32.4 million in cash and cash equivalents as of April 30, 2019, compared to $42.3 million on April 30, 2018.
More detailed financial information and analysis may be found in Avid Bioservices’ Annual Report on Form 10-K, which will be filed with the SEC today. [10-K: http://tinyurl.com/yxukx6t4 ]
RECENT DEVELOPMENTS
* Signed project expansion orders and new manufacturing projects related to new molecules with current clients during Q4 of FY 2019 representing future revenue in the amount of $19.7 million.
* Completed a second process validation campaign during FY 2019. Completion of a process validation campaign is a critical step in the regulatory product approval process, and is likely to result in future commercial production at Avid.
* The first process validation campaign of FY 2020 is in progress.
CONFERENCE CALL
Avid will host a conference call and webcast this afternoon, June 27, 2019, at 4:30PM EDT (1:30PM PDT). To listen to the conference call, please dial (877) 312-5443 or (253) 237-1126 and request the Avid Bioservices conference call. To listen to the live webcast, or access the archived webcast, please visit: http://ir.avidbio.com/events.cfm .
ABOUT AVID BIOSERVICES, INC.
Avid Bioservices is a dedicated contract development and manufacturing organization (CDMO) focused on development and CGMP manufacturing of biopharmaceutical products derived from mammalian cell culture. The company provides a comprehensive range of process development, high quality CGMP clinical and commercial manufacturing services for the biotechnology and biopharmaceutical industries. With 25 years of experience producing monoclonal antibodies and recombinant proteins in batch, fed-batch and perfusion modes, Avid's services include CGMP clinical and commercial product manufacturing, purification, bulk packaging, stability testing and regulatory strategy, submission and support. The company also provides a variety of process development activities, including cell line development and optimization, cell culture and feed optimization, analytical methods development and product characterization. http://www.avidbio.com
Forward-Looking *snip*
AVID BIOSERVICES, INC.
CONSOLIDATED STATEMENTS OF OPERATIONS AND COMPREHENSIVE LOSS
(in thousands, expect share and per share information)
Three Months Ended April 30, 2019 Twelve Months Ended April 30, 2018
2019 2018 2019 2018
Revenues $ 17,055 $ 6,943 $ 53,603 $ 53,621
Cost of revenues 13,407 8,904 46,379 56,545
Gross profit (loss) 3,648 (1,961) 7,224 (2,924)
Operating expenses:
Selling, general and administrative 3,573 4,183 12,846 16,456
Restructuring charges — — — 1,258
Total operating expenses 3,573 4,183 12,846 17,714
Operating income (loss) 75 (6,144) (5,622) (20,638)
Interest and other income, net 92 10 282 75
Income (loss) from continuing operations before income taxes $ 167 $ (6,134) $ (5,340) $ (20,563)
Income tax benefit 67 — 284 —
Income (loss) from continuing operations 234 (6,134) (5,056) (20,563)
Income (loss) from discontinued operations, net of tax 102 9,154 841 (1,250)
Net income (loss) $ 336 $ 3,020 $ (4,215) $ (21,813)
Comprehensive income (loss) $ 336 $ 3,020 $ (4,215) $ (21,813)
Series E preferred stock accumulated dividends (1,442) (1,442) (4,686) (4,686)
Net (loss) income attributable to common stockholders $ (1,106) $ 1,578 $ (8,901) $ (26,499)
Basic and diluted net (loss) income per common share attributable to common stockholders:
Continuing operations $ (0.02) $ (0.14) $ (0.17) $ (0.53)
Discontinued operations $ — $ 0.17 $ 0.01 $ (0.03)
Net (loss) income per share attributable to common stockholders $ (0.02) $ 0.03 $ (0.16) $ (0.56)
Weighted average basic and diluted shares outstanding: 56,079,970 53,360,424 55,981,060 47,063,020
(1) On May 1, 2018, the Company adopted Accounting Standards Codification (ASC) Topic 606, Revenue from Contracts with Customers (ASC 606), using the modified retrospective method applied to all contracts not completed as of May 1, 2018. Under the modified retrospective method, results for the reporting periods beginning on or after May 1, 2018 are presented in accordance with ASC 606, while prior period amounts are not adjusted and continue to be reported under the accounting standards that were in effect prior to May 1, 2018.
AVID BIOSERVICES, INC.
CONSOLIDATED BALANCE SHEETS (in thousands, expect share information)
April 30, 2019 April 30, 2018
ASSETS
Current assets:
Cash and cash equivalents $ 32,351 $ 42,265
Accounts receivable 7,374 3,754
Contract assets 4,327 —
Inventories 6,557 16,129
Prepaid expenses 709 679
Assets of discontinued operations — 5,000
Total current assets 51,318 67,827
Property and equipment, net 25,625 26,479
Restricted cash 1,150 1,150
Other assets 302 304
Total assets $ 78,395 $ 95,760
LIABILITIES AND STOCKHOLDERS’ EQUITY
Current liabilities:
Accounts payable $ 4,352 $ 1,909
Accrued payroll and related costs 3,540 2,564
Contract liabilities 14,651 27,935
Other current liabilities 619 905
Liabilities of discontinued operations — 4,550
Total current liabilities 23,162 37,863
Deferred rent, less current portion 2,072 2,159
Capital lease, less current portion 93 —
Commitments and contingencies
Stockholders’ equity:
Preferred stock, $0.001 par value; 5,000,000 shares authorized; 1,647,760
shares issued and outstanding at respective dates 2 2
Common stock, $0.001 par value; 150,000,000 shares authorized; 56,135,697
and 55,689,222 shares issued and outstanding at respective dates 56 55
Additional paid-in-capital 613,615 614,810
Accumulated deficit (560,605) (559,129)
Total stockholders’ equity 53,068 55,738
Total liabilities and stockholders’ equity $ 78,395 $ 95,760
Forward-Looking *snip*
CONTACTS:
• Stephanie Diaz (Investors) Vida Strategic Partners 415-675-7401 sdiaz@vidasp.com
• Tim Brons (Media) Vida Strategic Partners 415-675-7402 tbrons@vidasp.com
- - - - - - - -
From 10-K header: “As of Jun 14, 2019, there were 56,137,724 shares outstanding.”
- - - - - - - - - - - - - - - - -
Latest 10K 4-30-19 iss. 6-27-19 http://tinyurl.com/yxukx6t4 PR: http://tinyurl.com/y2k3tftn (Cash 4-30-19=$32.4mm)
Latest 10Q 1-31-19 iss. 3-11-19 https://tinyurl.com/yxqjs7an PR: https://tinyurl.com/y2btdhqf (Cash 1-31-19=$27.8mm)
ALL SEC filings for PPHM: http://tinyurl.com/6d4jw8
10-K: “As of 4-30-19, we employed 211 full-time & 4 part-time emps.” (2018: 185/1)
= = = = = = = = = = = = = = = = = = = = = = = = = = = =
Updated PPHM REVS-BY-QTR TABLE, now thru FY19'Q4(qe 4-30-19), per the 10-K (http://tinyurl.com/yxukx6t4 ) issued 6-27-19.
• Total Avid Revs since May’03: $349.2M
• 6-27-19: FY'20 (May'19-Apr'20) Avid revs guidance $64-67M (committed B/L=$46 at 4-30-19).
• Inventories at 4-30-19 total $6.6M, DOWN from $8.7M at 1-31-19.
Avid’s website: http://www.avidbio.com
 AVID GROSS PROFITABILITY BY QTR:                   CONTRACT
 QTR  (1000’s)      Rev$  COGS$  Prof$  GP% INVEN$ LIABILITIES*
 FY13Q1  7-31-12   4,135  2,024  2,111  51%  5,744   16,280
 FY13Q2 10-31-12   6,061  3,703  2,358  39%  5,426   14,721
 FY13Q3  1-31-13   6,961  3,651  3,310  47%  4,635   11,790
 FY13Q4  4-30-13   4,176  3,217    959  23%  4,339   12,230
 FY14Q1  7-31-13   4,581  2,670  1,911  42%  5,679   12,692
 FY14Q2 10-31-13   7,354  4,195  3,159  43%  4,033   11,126
 FY14Q3  1-31-14   3,885  2,416  1,469  38%  5,224   12,975
 FY14Q4  4-30-14   6,474  3,829  2,645  41%  5,530   11,001
 FY15Q1  7-31-14   5,496  3,583  1,913  35%  5,998   10,896
 FY15Q2 10-31-14   6,263  4,139  2,124  34%  5,379   11,161
 FY15Q3  1-31-15   5,677  3,113  2,564  45%  6,148   14,063
 FY15Q4  4-30-15   9,308  4,758  4,550  49%  7,354   17,993
 FY16Q1  7-31-15   9,379  4,608  4,771  51% 10,457   17,890
 FY16Q2 10-31-15   9,523  4,741  4,782  50% 12,554   24,623
 FY16Q3  1-31-16   6,672  3,896  2,776  42% 15,189   37,851
 FY16Q4  4-30-16  18,783  9,721  9,062  48% 15,189   39,630
 FY17Q1  7-31-16   5,609  3,062  2,547  45% 25,274   43,262
 FY17Q2 10-31-16  23,370 15,441  7,929  34% 25,924   44,908
 FY17Q3  1-31-17  10,747  7,974  2,773  26% 33,829   52,577
 FY17Q4  4-30-17  17,904 11,782  6,122  34% 33,099   45,517
 FY18Q1  7-31-17  27,077 20,448  6,629  24% 24,235   27,755
 FY18Q2 10-31-17  12,782 16,242 -3,460 -27% 16,518   20,611
 FY18Q3  1-31-18   6,819 10,951 -4,132 -61% 14,218   24,235
 FY18Q4  4-30-18   6,943  8,904 -1,961 -28% 16,129   27,935
 FY19Q1  7-31-18  12,589 11,397  1,192   9%  9,168   17,994
 FY19Q2 10-31-18  10,178  9,844    334   3%  9,736   17,307
 FY19Q3  1-31-19  13,781 11,731  2,050  15%  8,660   14,620
 FY19Q4  4-30-19  17,055 13,407  3,648  21%  6,557   14,651
 *7-31-18 10Q: “prior-yr amts related to (deferred revenue
 + cust deposits) now reclass’d as contract liabilities.”

 FY13 TOTAL:      21,333 12,595  8,738  41%*
 FY14 TOTAL:      22,294 13,110  9,184  41%*
 FY15 TOTAL:      26,744 15,393 11,151  42%*
 FY16 TOTAL:      44,357 22,966 21,391  48%*
 FY17 TOTAL:      57,630 38,259 19,371  34%*
 FY18 TOTAL:      53,621 56,545 -2,924  -5%*
 FY19 TOTAL:      53,603 46,379  7,224  13%*
 *Avid Net-Profit(Selling/G&A) not split out from PPHM-Corp. in the fin’s.

 AVID TOTAL REV’s BY YEAR):
 FY04 4-30-04   3,039 (Avid-Revs didn’t incl. Avid’s Gov’t work)
 FY05 4-30-05   4,684
 FY06 4-30-06   3,005
 FY07 4-30-07   3,492
 FY08 4-30-08   5,897
 FY09 4-30-09  12,963
 FY10 4-30-10  13,204
 FY11 4-30-11   8,502
 FY12 4-30-12  14,783
 FY13 4-30-13  21,333
 FY14 4-30-14  22,294
 FY15 4-30-15  26,744
 FY16 4-30-16  44,357
 FY17 4-30-17  57,630
 FY18 4-30-18  53,621
 FY19 4-30-19  53,603
 **TOTAL:     349,151 (5/1/2003–4/30/19)
 .
 QTLY. NET PROFIT/LOSS BY QTR:
 (“attributable to common stockholders”; ie, incl. PREF Div’s**)
 **2-11-14: PPHM Raises $16.2M, 700k Pref. Shares w/10.5% DIV.
 FY16Q1  7-31-15 -15,101,000
 FY16Q2 10-31-15 -14,578,000
 FY16Q3  1-31-16 -18,227,000
 FY16Q4  4-30-16 -13,264,000
 FY17Q1  7-31-16 -12,437,000
 FY17Q2 10-31-16  -4,498,000
 FY17Q3  1-31-17  -9,216,000
 FY17Q4  4-30-17  -6,714,000
 FY18Q1  7-31-17  -2,647,000
 FY18Q2 10-31-17 -14,066,000
 FY18Q3  1-31-18 -12,446,000
 FY18Q4  4-30-18  +1,578,000 <=includes $9,154,000 income from disc. operations.
 FY19Q1  7-31-18  -3,403,000
 FY19Q2 10-31-18  -2,893,000
 FY19Q3  1-31-19  -2,581,000
 FY19Q4  4-30-19  -1,106,000

 Period        Halozyme ADC-Therap. Coherus-BioSci. Other-Custs
 FYE  4-30-14     91%                                    8%
 FYE  4-30-15     79%                                    9%
 FYE  4-30-16     69%                     26%            5%
 FYE  4-30-17     58%                     26%           16%
 FYE  4-30-18     55%      9%             22%           14%
 FYE  4-30-19     30%     21%             13%           36%
 ...(cust. splits not given in 7-31-18+ 10Q’s)
4-30-19 10-K: Employee Counts and Going Concern Lifted (which is nice!)
“As of 4-30-18, we employed 185 full-time emps & 1 part-time emp.”
“As of 4-30-19, we employed 211 full-time emps & 4 part-time emps.”
GOING CONCERN:
4-30-18 10-K pg.30: “...as a result of the foregoing, we have concluded that there is substantial doubt about our ability to continue as a going concern within 1 year after our fin. statements are issued.”
4-30-19 10-K pg.31: “...The accompanying consolidated financial statements have been prepared assuming we will continue as a going concern...”
10K/4-30-19 iss. 6-27-19: http://tinyurl.com/yxukx6t4
10K/4-30-18 iss. 7-16-18: https://tinyurl.com/ydc8vew5
= = = = = =
6-27-19: Qtly. Conf. Call (Hancock/Hart/Kinjerski) PR & Transcript https://tinyurl.com/y4go7nfw
...Rick Hancock, "Most importantly, during Q4, the Company achieved positive income, generating cash from dev. & mfg. operations for the 1st time since the beginning of the CDMO transition (Jan'18)."
6-28-19 Recap Article on Janney Upgrade to Buy/$10
Excerpts that quote analyst Paul Knight:
Avid was shown to have exceeded estimates and to have achieved EBITDA profitability, all while growing its backlog with 5 new contracts.
Knight’s commentary said:
”Along with the company’s positive comments about the mAb market strength, we see numerous indicators like increasing prescriptions, a great share of mAbs in FDA approvals, and peers like Lonza indicating very strong market demand. Lastly, the interim CEO and Board includes, Rick Hancock and Mark Bamforth, respectively, highly respected veterans of the biological production industry.”
He [Paul Knight] also sees EBITDA margins expanding to above 25% over time and believes that Avid can acquire strategic assets.
His report said:
”These validation projects are necessary per FDA protocols for commercial production. While current projects average around $3-5M, an approved product can drive tens of millions of revenue. Avid has about $100M of built capacity and another $100M of expansionary capacity relative to $64-67M in guided FY20 revenue.”
6-28-19: https://247wallst.com/healthcare-business/2019/06/28/why-avid-bioservices-stock-could-still-double-maybe/
= = = = = = = = =
Janney Capital - Paul Knight (init. 6-25-18): Buy/PT=$10 https://www.janney.com Coverage: https://jms.bluematrix.com/docs/html/BLUE.html
6-27-19 Qtly CC-Transcript, PR(Q4FY19/fye4-30-19), Avid Revs History Table
*Revs Guidance (FY’20 fye 4-30-20): $64-67M. 4-30-19 Backlog=$46M
*Cash: 4-30-19: $32.4M
*As of 6-14-19: 56,137,724 shares o/s.
*10K/4-30-19 iss. 6-27-19: http://tinyurl.com/yxukx6t4
*Avid Total Revs May03-Apr19: $349.2M
*Avid’s website: https://avidbio.com
This large post has 4 sections:
I. 6-27-19 Qtly. Earnings Conf. Call TRANSCRIPT (FY19/Q4 fy/e 4-30-19)
II. 6-27-19 CDMO Press Release: Q4/FY19 Earnings & Developments
IV. Updated Table of Avid Revenues By Quarter (May’06-Current)
III. Updated O/S Shares History Table – 2006-curr.
…Recall: Avid’s FY runs May-Apr, so FY’20 = May’19-Apr’20.
((( Orig. transcript from SeekingAlpha.com [http://tinyurl.com/y3yhke8q ] with numerous corrections made. )))
Link to webcast replay: http://ir.avidbio.com/events-and-presentations => https://edge.media-server.com/mmc/p/hquga2x5
TRANSCRIPT 6-27-19 FY’19/Q4 Earnings Conf. Call (fy/e 4-30-19) (Hancock/Hart/Kinjerski)
RICK HANCOCK (CEO) – OPENING COMMENTS:
Thank you to all of you who've dialed in and to those who are participating today via the webcast. Since this is my first earnings call in this role with Avid, I would like to say that I'm very pleased to be working closely with our team as we continue to transition the business and build upon the accomplishments of my predecessor, Roger Lias. I am particularly pleased to have the opportunity to discuss the achievements of Q4 FY2019, Avid's strongest quarter since becoming a dedicated CDMO. With respect to our financial performance, Q4 2019 results beat industry estimates for both revenue & EPS. Most importantly, during Q4, the Company achieved positive income, generating cash from development & mfg. operations for the 1st time since the beginning of the transition. The growth realized during the quarter was reflected in other metrics as well, and Dan will provide more details regarding our financial performance in a moment. Multiple successes on the business development front drove the quarter's strong financial performance. In Q4, our BD team advanced new business opportunities and won multiple new projects with existing customers. Though these new projects are with existing customers, many are for the development and manufacture of additional molecules, which were not part of the initial contract. Each of these programs represents a new opportunity for commercial production down the road. Tracy will provide more color on these developments shortly. With that, I'll turn the call over to Dan to provide a financial overview.
DANIEL HART (CFO) – OPENING COMMENTS:
Before I begin, I'd like to recommend that everyone participating today refer to our 10-K filing with the SEC, which we filed today for additional details. [10-K: http://tinyurl.com/yxukx6t4 ] I will now discuss our financial results from continuing operations for Q4 ended April 30, 2019, starting with revenue. As Rick stated, Q4 was our strongest to-date since officially beginning the transition to a dedicated CDMO. Revenue for Q4 of 2019 was $17.1M, an increase of 146% as compared to $6.9M for the same period of the prior year. This increase was primarily the result of the growing in the number and scope of customer projects. Revenue for the full FY 2019 was $53.6M. And while that was flat compared to FY2018, it exceeded our guidance, which we had expected to come in within the lower half of the range of $51-55M. For both Q4 and the full FY 2019, margins increased significantly as compared to prior year period. Gross margin for Q4 was 21% and gross margin for the full FY 2019 was 13%. These margins are compared to a negative -28% for Q4 of 2018 and a negative -5% for FY2018. These increases reflect the growth in customer projects, the increased utility of our existing capacity, a judicious management of expenses, and increasing operational efficiencies.
Turning now to operating expenses. Total SG&A expenses for Q4 of FY2019 were $3.6M compared to $4.2M for Q4/FY2018. For the full FY 2019, total SG&A expenses were $12.8M or 24% of revenue compared to $16.5M or 31% of revenue for the full FY 2018. It's important to note that SG&A results for the prior year included non-recurring expenses of approx. $4.4M related to the transition of our business to a pure-play CDMO. These prior year expenses included reductions in payroll & related costs, legal fees and other professional consulting fees, administrative costs, and the write-off related to a deposit of capital equipment. Excluding these non-recurring charges, SG&A increased $.8M, primarily due to increases in bonuses related to achievement levels of corporate goals and stock-based compensation.
During Q4/2019, we generated income from continuing operations of $.2M compared to a loss from continuing operations of $6.1M for Q4 of FY2018. This marks the 1st qtr. of positive income from continuing operations since announcing our transition to a dedicated CDMO back in January of 2018. FY 2019 loss from continuing operations was $5.1M compared to a prior year loss from continuing operations of $20.6M. The decrease during the full FY was partially driven by reduction in both costs of revenues and SG&A resulting in higher profitability margins. For Q4 of FY2019, the Company recorded consolidated net loss attributable to common stockholders of $1.1M or $.02 per share compared to a consolidated net income attributable to common stockholders of $1.6M or $.03 per share for the same prior year quarter. For the full year FY2019, the Company recorded a consolidated net loss attributable to common stockholders of $8.9M or $.16 per share compared to a consolidated net loss attributable to common stockholders of $26.5M or $.56 per share for full year FY2018. Both the prior Q4 and the full FY 2018, net income and loss were favorably impacted by the sale of Avid's legacy R&D assets to Oncologie, Inc. for $8M and the associated discontinued operations.
Our backlog at the end of Q4 2019 [4-30-19] was approx. $46M, an increase compared to backlog of $43M at the end of Q3 2019. We are pleased to maintain the strong backlog that will continue to contribute to our growth trend, and we expect to recognize the majority of this balance in FY2020. Lastly, during Q4 of FY2019, we generated $5.6M in operating cash flow, thus, increasing our cash & cash equivalents as of April 30, 2019 to $32.4M. Cash & cash equivalents were $42.3M as of the prior FY ended April 30, 2018. As we stated consistently throughout the last year, achieving positive income from continuing operations has been a major milestone for the Company. By aggressively pursuing and winning new business from existing clients, carefully managing cash and expenses, and consistently incorporating new efficiencies into our processes, we have successfully delivered on this goal. Based on our current backlog, as well as our forecast for typical expansion of ongoing projects, we believe the Company has reached the very important position from which they expect to achieve sustainable growth and continued profitability. This concludes my financial overview. I will now turn the call over to Tracy for an update on business activities and achievements for the quarter.
TRACY KINJERSKI (VP, BUSINESS OPERATIONS) - OPENING COMMENTS:
During Q4, Avid's increased visibility in industry and our aggressive work to expand both our client base, as well as our project pipeline, yielded great dividends. During the quarter, we had a strong presence at several of the industry's best attended events & conferences, including but not limited to, DCAT Week and Interfax. As the quarter was coming to an end, we were heavily focused on our preparation for the 2019 BIO Intl. Convention, which commenced subsequent to quarter end. Part of this conference was to further build our brand awareness and messaging in the bio therapeutics industry, while also meeting with current and potential new customers and sponsoring and supporting key industry organizations, such as DCAT and Women In Bio. As a result of this continuous exposure, as well as our customer outreach efforts, our log of new business discussions continues to grow. As evidenced by the high number of key meetings and conferences and subsequent influx of new request for proposals, we are gaining important traction with potential for customers and industry partners. Equally important, as we believe today's financial results have demonstrated, is the new business we continue to win with the existing customers. While some of these business results from the expansion of a current project, many of these projects are completely new, requiring development and or manufacture of new molecules. These wins are incredibly valuable for several reasons. First, the earlier phase projects represent opportunities for both early stage, as well as commercial production as the program advances through the various regulatory stages. Other follow-on molecules from existing customers may be later phase, leading to validation and commercial stage with more certainty and providing assurance of need for long-term manufacturing. Second, as we already have a working relationship with these companies, on-boarding and other aspects of the process are much more efficient and less costly, making these projects more profitable for Avid. And finally, the repeat business is a great testimonial for Avid. The fact that many of our clients have come back from multiple projects speaks to the collaborative relationships we established with our clients, the expertise of our team, the state-of-the-art nature of our facilities and processes and most importantly, the quality of our product.
I would now like to provide an update with respect to one of our largest customers. Halozyme Therapeutics continues to increase demand for manufacture of the recombinant human hyaluronidase enzyme, supporting their ENHANZE technology platform. Avid currently manufactures product not only for Halozyme's collaboration products, but also for collaboration product candidates currently in development. We believe that the strengthened forecasts are partially due to a key Halozyme partner for whom Avid is the exclusive supplier depleting their inventories. More importantly, this demand is also driven by new development projects and new product launches by Halozyme's partners, as well as market growth for their commercial products. We anticipate that this trend will continue into FY 2020 as Halozyme's partners advance their clinical dev. program and begin preparing for commercialization. As we discussed last quarter, Avid recently completed a process validation campaign for a new scaled up mfg. process on behalf of Halozyme in anticipation of future commercial manufacturing. In addition, we have recently completed a 2nd process validation campaign of FY2019, with another campaign in progress. Once the process validation is completed, the associated specifications for that process represents a key part of global regulatory filings. The mfg. process becomes part of the product approval and the consumers required to manufacture in specified facility using the specified process. Of course clinical trials & regulatory reviews take years, and there's no guarantee of a drug approval at the end of the process. However, for those products approved using processes validated at Avid, it’s likely that the commercial manufacturing will be conducted at Avid. To move the business to another CDMO at that point would require a new process validation and re-filing with the regulatory agency, which are highly risky, expensive and time consuming propositions. For these reasons, we see each process validation completed today as a great opportunity to build commercial business in the future.
We remain very excited about the demand in the biopharmaceutical community in general, and with our regulatory history, we believe we are uniquely positioned to serve clients who are developing products with accelerated approval time lines. Importantly, the strategy allows us to support rare-disease product development partners. As a CDMO, our aim is to support our clients to ensure availability of medicines for all regardless of the size of the patient population. The flexibility is built into our facility configuration and design, combined with the mindset of our leadership continues to foster this goal. During the year, our business dev. and project mgt. team members set and met the high standards essential to our customer-centric approach. Looking forward, we are excited by the new and expanding opportunities that we expect to fuel continued growth and increasing capacity utilization in FY2020. This concludes my business overview. And I'll now hand the call back to Rick.
RICK HANCOCK (CEO) – Q4/FY19 OPERATIONAL & COMMERCIAL UPDATE:
Thank you, Tracy. I would also like to congratulate the business operations team on its accomplishments during FY2019. The new business won in the past year has put Avid in a stronger position to continue its growth trajectory. I'd now like to provide a brief update regarding operations at Avid. We continue to make progress with the expansion of the Franklin process dev. lab, which will primarily house upstream processing. It is currently our expectation that this work will be completed in the fall. Concurrent with this work, we are evaluating all of our facilities, equipment, and processes as part of a 3-year plan in an effort to incorporate additional efficiencies where possible and new technologies where applicable. This ongoing process is essential in ensuring that Avid's processes remain at the forefront of development and manufacturing, and that our facilities represent the state-of-the-art among CDMOs. All these enhancements are taking place to improve our existing Franklin & Myford facilities. We have significant room to expand our operations and anticipate doing so as demand for our services continues to increase. Until then, we will remain focused on filling and optimizing our existing capacity.
I'll now turn to leadership at Avid. I recently stepped into serve as Avid's Interim President & CEO, following the departure of Roger Lias last month. Given my 20 years of experience in the CDMO sector and my tenure on Avid's board, I am thrilled that the opportunity to assume temporary leadership at this exciting time of growth and transition. The Avid board has initiated a search for the Company's new permanent CEO. Having said that, we are being very deliberate in this crucial process, we recognize the significant progress that has been made to date at Avid. And we will take our time to find the ideal candidate to lead the Company to ongoing success. We do not have a timeline for this process. We'll update you as there is news to report.
In closing, I'd like to emphasize that during FY2019, the Avid team successfully achieved the most critical goals for the business. Most notably, we converted the losses and negative margins this FY2018 into a sustainable position of financial strength and operational profitability. And we expect to continue revenue growth, moving forward. With respect to business development, the 5 new clients signed in late FY2018, contributed significantly to revenue diversification in FY2019. These projects substantially increased capacity utilization, which drove a meaningful improvement in margins during the year. Avid is stronger today than it has been at any point in its history. For that, we offer our sincere thanks to Roger Lias who led the transition from a drug dev. company to a leading and profitable CDMO. Looking ahead, we will continue to execute according to plan with even higher goals for revenue and new customer projects. As in FY2019, we expect to continue to achieve great successes in the coming years. With that, I'm happy to announce that for FY2020, we expect to record revenue of $64-$67M, representing growth of approx. 20-25% over FY2019. And as we continue to achieve revenue growth, we expect the improvement in margins to track accordingly. Thank you to all of our investors, industry colleagues and friends who have continued to support Avid during its transition. But most importantly, I'd like to offer a big thank you to the entire Avid team. Our employees work tirelessly and diligently to make Avid the best CDMO it can be. It is because of their unwavering commitment to excellence that I am confident in Avid's growth potential and very excited about the successes that lie ahead.
Q&A: [beg. 20:01]
1. Joe Pantginis - H.C. Wainwright
JP: ”First, just curious with the 5 new clients that were signed in late FY2019. Can you talk about what the mix is? Are they all early stage for process dev. and early process development?”
Tracy Kinjerski: As you mentioned there, there are several projects that we signed and they vary. Some of those projects came in immediately from cell-line development stage, so they are very early on. And we also had at least one project that came in that was more at the Phase II stage. So that pretty much covers it. So, a pretty good range when you look at those customers. And yes, just to reiterate, those customers were signed in late FY2018.
JP: ”Re: backlog increasing and your prepared comments talking about the facilities that you already have with regard to Franklin & Myford. What is a trigger number, if you will, that will allow you to then actively extend your capacity?”
Dan Hart: Appreciate the question. The backlog is a little tricky, because as we've discussed in the past, the backlog is only the signed contractual firm relationship that we have with the clients. It's not the entirety of our opportunity pipeline and any work that we see from our customer forecast. So, it just depends on the overall operation and financial forecast that we're looking at from our customers, not necessarily just the backlog number that is reported.
JP: ”And, when you talk about the backlog number, you did remind us obviously that it's the signed contractual work. So what else does the number not include?”
Dan Hart: The programs that we're running for our clients, they run multiple months, multiple quarters, multiple years. And those forecasts that we have from our clients, we can see as to where that particular project or program is going. However, contractually, we may only sign up for some limited portion of that entire program.
JP: ”Understood. Thanks a lot for the extra detail.”
2. Paul Knight - Janney
PK: ”I think you were considering expanding the sales force. Where are you with those efforts? What do you want to do for starters on that?”
Rick Hancock: We do have one current opening for a sales rep, and Tracy and her team are continuing to evaluate where to put addl. resources. Tracy has built a very, very strong internal business operations team, and they hand some of the activities that might normally be handled by external sales reps. So, we don't feel that we need a tremendous number of field representatives at this time to cover our industry, but we are monitoring that, so looking for people, field representatives to be focused in the hubs of biotech activity.
PK: ”Dan, is there a change in the way you're recognizing or reporting backlog? You're talking about it being in the next 12mos. But is your recording of it any different than you've done in the past? Is it a more conservative approach or no change? And then secondly, how do you want us to think about rolling out revenue quarters in the new FY?”
Dan Hart: As far as your first question on backlog, there's no change into how we account for or report our backlog. So, the cadence of that backlog is merely a factor of, if you're looking at it period-over-period, the beginning balance, if you take out any revenue, you recognize in anything that we've signed yet back to it. There's no difference as far as the content of that backlog, it's all based on contractual relationships.
As far as your 2nd question, we're not necessarily giving a qtr-over-qtr guidance as far as what that revenues looks like. But as we've said in our prepared remarks, the guidance that we're providing for FY2020 is $64-$67M.
PK: ”And Rick, if you could talk to business conditions now, customer interest, customer inquiries. How was it now vs. one year ago? Is it better, expanded? What's the tone of customer and demand right now?”
Rick Hancock: Great question. It remains extremely strong. As Tracy mentioned, we were just at BIO2019 recently. And our customers and our potential customers, we had quite a number of meetings. They continue to be very healthy. They're able to access the funds that they need to bring innovative molecules to the market, and we continue to be in a sweet spot for where a lot of those drugs are being developed. So not really huge blockbuster products, but more niche orphan indications and follow-along biosimilars that really fit very well with our capacity. And as Tracy mentioned in her remarks, quite a number of those products move through the clinical dev. process very quickly. So having a CDMO with a commercial history is very critical. We see the industry as very, very strong at this point, a lot of antibodies and other mammalian derived proteins being developed from early research all the way through later clinical trials and moving towards approval.
PK: ”And then my last question, what are the 2 or 3 things that customers you think are finding most appealing about your offering? Is it you can do early-stage work? Is it your physical location? What do you think are the key touch points that customers are liking?”
Rick Hancock: I think first and foremost, it's our tremendous regulatory history. That's one of the key differentiators that makes Avid unique compared to a lot of other people who can develop mammalian proteins. So, the number of years that we've had a commercial experience, the number of countries that we have approval for, that really sets us apart. And then as you hit on, I think the ability to take projects from early phase dev. up through clinical trials and rapidly to commercialization is very attractive. The flexibility in our platforms and the expertise and process development, in regulatory, in quality and of course in manufacturing. In terms of geography, which you mentioned, that is just something that does help us with the Bay Area, Seattle, San Diego clients in the Los Angeles area. Certainly, being in the same time zone when we have a person in the plant and we're doing production, they can just fly down from San Francisco, be here for the day and fly back. So that is very attractive. We also do get quite a bit of work in the east coast as well, and those people love to come out to beautiful southern California, particularly in the winter. So, we use our geography as a strong advantage. So, I'd say it's a combination of those factors but really one of our keys I think is our regulatory history.
3. Steve Schwartz - First Analysis
SS: ”Re: backlog, in the press release, you note $19.7M from existing customers, and I think as you stated in one of your early responses, you’re back up to $17.1M in revenue book. It looks like you've added $2.6M to the backlog from existing customers with the $3M difference. Does that mean there's about $400,000 added to the backlog from new customers? Am I reading those numbers right?”
Dan Hart: No, Steve, I’ll help and clarify that. We began Q4 with backlog of $43M. And during the quarter, we recognized $17.1M of revenue. In addition, we signed addl. contractual relationships with existing customers of $19.7M. So, adding those 3 numbers together is where we end up at our $46M backlog at the end of April.
SS: ”But then that would suggest that the backlog add from $43M to $46M was all from existing customers?”
Dan Hart: That's right.
SS: ”Okay, that clarifies it. Now, re: roll out of revenues across the year; it would really be helpful. There is really no way you can tell us maybe what the H1 looks like vs. H2? Should we just presume like 50:50? Is it more like 40:60?”
Dan Hart: Steve, we're not giving quarterly guidance at this point. All that I can tell you is that our annual is $64-67M.
SS: ”In Tracy's prepared remarks talking about the validations. In FY19, you did 2 process validations. It sounds like the 1st one was for Halozyme and then the 2nd was not, or was that also a Halozyme process?”
Tracy Kinjerski: Yes, there was only one for Halozyme.
SS: ”And then the one that's underway for FY'20 is not Halozyme either. Is that correct?”
Tracy Kinjerski: It is not, that's correct.
SS: ”There's really no way for us to get a sense of when that might transform itself into revenue from validation to actual production. Is that correct?”
Tracy Kinjerski: To commercial, right. We really need to wait for the filings and the approval of the inspections, et cetera.
Rick Hancock: Right. Essentially all of those activities are beyond our control.
SS: ”Re: gross margins, there was a very nice improvement in FY'19 and in the release, you stated a couple of reasons behind that. I just want to make sure I understand with respect to product mix. You are starting to present these numbers in the filings, but if you could just talk about it. When you refer to mix, is it the mix between development work vs. production work? Is it a mix of what's going through actual production? Can you give us a little color around that?”
Dan Hart: It's all of the above. In addition to that, it's also the type of effort, whether it's just the service or service includes materials. And also based on the type of work that we're doing, if we're doing analytical development or if we're doing straight up manufacturing, in addition to the scale of the manufacturing is also different in that type of margin. So, it's all of the above.
SS: ”And then how was that you saw the reduction in direct mfg. cost? Is that sustainable? Or was it just within the quarter?”
Dan Hart: No, that overall reduction was essentially a change that we went through near the end of last year into this year. So going forward, we won't see significant reduction such as that, though, we'll continue to focus on cost control and looking at spending wisely, just anything that's affecting our gross profit margins, but that was as we transitioned into a pure-play CDMO.
SS: ”And then my last question is around SG&A. You saw significant reduction in FY'19. What should we expect going forward for FY'20? I mean, there's going to be $.5M in there paid out to Roger, right?, so there you're going to have like a double CEO salary that's going to be in there. But aside from that, is there anything else we need to be aware of, considering the big gap between FY'18 & FY'19?”
Dan Hart: Steve, what we've said in the past that still holds true is we don't see any significant increases in SG&A. We're not at a point where we need to add a bunch of headcount or any other type of operational costs within SG&A. We can fully leverage that. We'll see some growth as the business grows, but it's not going to be anywhere near the growth of the revenue rate or cost of sales.
SS: ”Yes, OK, fantastic. Well, very nice quarter everyone, nice to see the inflection coming through here.”
Dan Hart: Thank you, Steve.
RICK HANCOCK (CEO) – CLOSING COMMENTS:
Thank you, again for participating today. And thank you for your continued supportive of Avid Bioservices. We look forward to updating you again in the near future.
= = = = = = = = = = = = = = = = = = = = = = = = = = = = = == = = =
6-27-19: Avid Bioservices Reports Financial Results for 4th Quarter and FY Ended April 30, 2019 and Recent Developments
GlobalNewsWire: http://tinyurl.com/y2k3tftn
-- Achieved Q4 Revenue of $17.1 Million, an Increase of 146% Compared to Prior Year Quarter
-- Generated Income From Continuing Operations During the Fourth Quarter of FY 2019
-- Increasing Demand from Customers Expected to Drive Continued Revenue Growth into 2020
TUSTIN, June 27, 2019 (GLOBE NEWSWIRE): Avid Bioservices, Inc. (NASDAQ:CDMO/CDMOP), a dedicated biologics contract development and manufacturing organization (CDMO) working to improve patient lives by providing high quality development and manufacturing services to biotechnology and pharmaceutical companies, today announced financial results for Q4 and full year of FY 2019 ended April 30, 2019.
HIGHLIGHTS SINCE JANUARY 31, 2019
“FY 2019 was a fundamentally transformative year for Avid, as the team successfully achieved a number of critical goals. Most notably, we converted the losses and negative margins in FY 2018 into a sustainable position of financial strength,” stated Rick Hancock, interim President and CEO. “Based on our current backlog as well as forecasts from our customers, we believe the company will achieve sustainable growth going forward. Avid is stronger today than it has been at any point in the past. With respect to business development, the 5 new clients signed in late FY 2018 contributed significantly to revenue diversification in FY 2019. These projects substantially increased capacity utilization, which drove a meaningful improvement in margins during the year. Of particular note is the new business we continue to win from existing customers. While some of this business results from the expansion of current projects, many of these projects are completely new, requiring development and/or manufacture of a new molecule. These ‘repeat business’ wins are particularly valuable to Avid as each offers the opportunity for later stage and commercial production, they generally onboard very efficiently and as a result are more profitable, and they provide strong testimonials as to the quality of our work and product.”
”Avid finished the year with a strong Q4, growing revenue to $17.1 million while increasing gross margins to 21%,” said Dan Hart, CFO. “During Q4 we generated $5.6 million in operating cash flow increasing our net cash and cash equivalents by $4.6 million to $32.4 million. Looking ahead, we are encouraged by the forecasted increase in demand which we expect to strengthen the company’s overall financial standing and position us for profitability.”
FINANCIAL HIGHLIGHTS AND GUIDANCE
* The company is providing revenue guidance for the full FY 2020 [May’19-Apr’20] of $64-67M (ASC 606).
* Revenue was $17.1 million for Q4 of FY 2019, a 146% increase compared to $6.9 million for Q4 of last fiscal year. This increase is primarily due to growing demand from a more diversified client base. Revenue for the full FY 2019 met guidance at $53.6 million, and was flat compared to full FY 2018.
* As of April 30, 2019, revenue backlog was approximately $46 million, the majority of which is expected to be recognized in FY 2020.
* Gross margin for Q4 of FY 2019 was +21%, and gross margin for full FY 2019 was +13%, both representing significant improvements compared to gross margins of negative -28% during Q4 of FY 2018 and negative -5% for full FY 2018. The improvements in gross margins for both FY 2019 periods were primarily attributed to our product mix, increased capacity utilization and a reduction in direct mfg. costs.
Selling, general and administrative expenses (“SG&A”) for Q4 of FY 2019 were $3.6 million, or 21% of revenue, compared to $4.2 million, or 60% of revenue, for Q4 of last year. For full FY 2019, total SG&A expenses were $12.8 million, or 24% of revenue compared to $16.5 million last fiscal year, or 31% of revenue. The decrease in SG&A was primarily due to a reduction in payroll and related costs, legal fees and other professional consulting fees, and facility costs, which were partially offset by increases in bonuses related to certain achievement levels of corporate goals and stock-based compensation.
During Q4 of FY 2019 we generated income from continuing operations of $.2 million compared to a net loss from continuing operations of $6.1 million for Q4 of FY 2018. FY 2019 loss from continuing operations was $5.1 million compared to a prior year loss from continuing operations of $20.6 million. The decrease during the full fiscal year was primarily due to reductions in both cost of revenues and SG&A resulting in higher profitability margins.
For Q4 of FY 2019, the company recorded consolidated net loss attributable to common stockholders of $1.1 million or $.02 per share, compared to a consolidated net income attributable to common stockholders of $1.6 million or $.03 per share, for Q4 of FY 2018. For full FY 2019, the company recorded a consolidated net loss attributable to common stockholders of $8.9 million or $.16 per share, compared to a consolidated net loss attributable to common stockholders of $26.5 million or $.56 per share, for full FY 2018. For both Q4 and full FY 2018, net income and loss were favorably impacted by the sale of the company’s legacy R&D assets to Oncologie, Inc. for $8.0 million and the associated discontinued operations.
Avid reported $32.4 million in cash and cash equivalents as of April 30, 2019, compared to $42.3 million on April 30, 2018.
More detailed financial information and analysis may be found in Avid Bioservices’ Annual Report on Form 10-K, which will be filed with the SEC today. [10-K: http://tinyurl.com/yxukx6t4 ]
RECENT DEVELOPMENTS
* Signed project expansion orders and new manufacturing projects related to new molecules with current clients during Q4 of FY 2019 representing future revenue in the amount of $19.7 million.
* Completed a second process validation campaign during FY 2019. Completion of a process validation campaign is a critical step in the regulatory product approval process, and is likely to result in future commercial production at Avid.
* The first process validation campaign of FY 2020 is in progress.
CONFERENCE CALL
Avid will host a conference call and webcast this afternoon, June 27, 2019, at 4:30PM EDT (1:30PM PDT). To listen to the conference call, please dial (877) 312-5443 or (253) 237-1126 and request the Avid Bioservices conference call. To listen to the live webcast, or access the archived webcast, please visit: http://ir.avidbio.com/events.cfm .
ABOUT AVID BIOSERVICES, INC.
Avid Bioservices is a dedicated contract development and manufacturing organization (CDMO) focused on development and CGMP manufacturing of biopharmaceutical products derived from mammalian cell culture. The company provides a comprehensive range of process development, high quality CGMP clinical and commercial manufacturing services for the biotechnology and biopharmaceutical industries. With 25 years of experience producing monoclonal antibodies and recombinant proteins in batch, fed-batch and perfusion modes, Avid's services include CGMP clinical and commercial product manufacturing, purification, bulk packaging, stability testing and regulatory strategy, submission and support. The company also provides a variety of process development activities, including cell line development and optimization, cell culture and feed optimization, analytical methods development and product characterization. http://www.avidbio.com
Forward-Looking *snip*
AVID BIOSERVICES, INC.
CONSOLIDATED STATEMENTS OF OPERATIONS AND COMPREHENSIVE LOSS
(in thousands, expect share and per share information)
Three Months Ended April 30, 2019 Twelve Months Ended April 30, 2018
2019 2018 2019 2018
Revenues $ 17,055 $ 6,943 $ 53,603 $ 53,621
Cost of revenues 13,407 8,904 46,379 56,545
Gross profit (loss) 3,648 (1,961) 7,224 (2,924)
Operating expenses:
Selling, general and administrative 3,573 4,183 12,846 16,456
Restructuring charges — — — 1,258
Total operating expenses 3,573 4,183 12,846 17,714
Operating income (loss) 75 (6,144) (5,622) (20,638)
Interest and other income, net 92 10 282 75
Income (loss) from continuing operations before income taxes $ 167 $ (6,134) $ (5,340) $ (20,563)
Income tax benefit 67 — 284 —
Income (loss) from continuing operations 234 (6,134) (5,056) (20,563)
Income (loss) from discontinued operations, net of tax 102 9,154 841 (1,250)
Net income (loss) $ 336 $ 3,020 $ (4,215) $ (21,813)
Comprehensive income (loss) $ 336 $ 3,020 $ (4,215) $ (21,813)
Series E preferred stock accumulated dividends (1,442) (1,442) (4,686) (4,686)
Net (loss) income attributable to common stockholders $ (1,106) $ 1,578 $ (8,901) $ (26,499)
Basic and diluted net (loss) income per common share attributable to common stockholders:
Continuing operations $ (0.02) $ (0.14) $ (0.17) $ (0.53)
Discontinued operations $ — $ 0.17 $ 0.01 $ (0.03)
Net (loss) income per share attributable to common stockholders $ (0.02) $ 0.03 $ (0.16) $ (0.56)
Weighted average basic and diluted shares outstanding: 56,079,970 53,360,424 55,981,060 47,063,020
(1) On May 1, 2018, the Company adopted Accounting Standards Codification (ASC) Topic 606, Revenue from Contracts with Customers (ASC 606), using the modified retrospective method applied to all contracts not completed as of May 1, 2018. Under the modified retrospective method, results for the reporting periods beginning on or after May 1, 2018 are presented in accordance with ASC 606, while prior period amounts are not adjusted and continue to be reported under the accounting standards that were in effect prior to May 1, 2018.
AVID BIOSERVICES, INC.
CONSOLIDATED BALANCE SHEETS (in thousands, expect share information)
April 30, 2019 April 30, 2018
ASSETS
Current assets:
Cash and cash equivalents $ 32,351 $ 42,265
Accounts receivable 7,374 3,754
Contract assets 4,327 —
Inventories 6,557 16,129
Prepaid expenses 709 679
Assets of discontinued operations — 5,000
Total current assets 51,318 67,827
Property and equipment, net 25,625 26,479
Restricted cash 1,150 1,150
Other assets 302 304
Total assets $ 78,395 $ 95,760
LIABILITIES AND STOCKHOLDERS’ EQUITY
Current liabilities:
Accounts payable $ 4,352 $ 1,909
Accrued payroll and related costs 3,540 2,564
Contract liabilities 14,651 27,935
Other current liabilities 619 905
Liabilities of discontinued operations — 4,550
Total current liabilities 23,162 37,863
Deferred rent, less current portion 2,072 2,159
Capital lease, less current portion 93 —
Commitments and contingencies
Stockholders’ equity:
Preferred stock, $0.001 par value; 5,000,000 shares authorized; 1,647,760
shares issued and outstanding at respective dates 2 2
Common stock, $0.001 par value; 150,000,000 shares authorized; 56,135,697
and 55,689,222 shares issued and outstanding at respective dates 56 55
Additional paid-in-capital 613,615 614,810
Accumulated deficit (560,605) (559,129)
Total stockholders’ equity 53,068 55,738
Total liabilities and stockholders’ equity $ 78,395 $ 95,760
Forward-Looking *snip*
CONTACTS:
• Stephanie Diaz (Investors) Vida Strategic Partners 415-675-7401 sdiaz@vidasp.com
• Tim Brons (Media) Vida Strategic Partners 415-675-7402 tbrons@vidasp.com
- - - - - - - -
From 10-K header: “As of Jun 14, 2019, there were 56,137,724 shares outstanding.”
- - - - - - - - - - - - - - - - -
Latest 10K 4-30-19 iss. 6-27-19 http://tinyurl.com/yxukx6t4 PR: http://tinyurl.com/y2k3tftn (Cash 4-30-19=$32.4mm)
Latest 10Q 1-31-19 iss. 3-11-19 https://tinyurl.com/yxqjs7an PR: https://tinyurl.com/y2btdhqf (Cash 1-31-19=$27.8mm)
ALL SEC filings for PPHM: http://tinyurl.com/6d4jw8
= = = = = = = = = = = = = = = = = = = = = = = = = = = =
Updated PPHM REVS-BY-QTR TABLE, now thru FY19'Q4(qe 4-30-19), per the 10-K (http://tinyurl.com/yxukx6t4 ) issued 6-27-19.
• Total Avid Revs since May’03: $349.2M
• 6-27-19: FY'20 (May'19-Apr'20) Avid revs guidance $64-67M (committed B/L=$46 at 4-30-19).
• Inventories at 4-30-19 total $6.6M, DOWN from $8.7M at 1-31-19.
Avid’s website: http://www.avidbio.com
 AVID GROSS PROFITABILITY BY QTR:            DEFER          CUST
 QTR  (1000’s)      Rev$  COGS$  Prof$  GP%   REV$ INVEN$   DEP.
 FY13Q1  7-31-12   4,135  2,024  2,111  51%  6,056  5,744 10,224
 FY13Q2 10-31-12   6,061  3,703  2,358  39%  6,221  5,426  8,500
 FY13Q3  1-31-13   6,961  3,651  3,310  47%  5,061  4,635  6,729
 FY13Q4  4-30-13   4,176  3,217    959  23%  4,171  4,339  8,059
 FY14Q1  7-31-13   4,581  2,670  1,911  42%  4,164  5,679  8,528
 FY14Q2 10-31-13   7,354  4,195  3,159  43%  3,468  4,033  7,658
 FY14Q3  1-31-14   3,885  2,416  1,469  38%  4,329  5,224  8,646
 FY14Q4  4-30-14   6,474  3,829  2,645  41%  5,241  5,530  5,760
 FY15Q1  7-31-14   5,496  3,583  1,913  35%  4,670  5,998  6,226
 FY15Q2 10-31-14   6,263  4,139  2,124  34%  3,612  5,379  7,549
 FY15Q3  1-31-15   5,677  3,113  2,564  45%  5,752  6,148  8,311
 FY15Q4  4-30-15   9,308  4,758  4,550  49%  6,630  7,354 11,363
 FY16Q1  7-31-15   9,379  4,608  4,771  51%  8,291 10,457  9,599
 FY16Q2 10-31-15   9,523  4,741  4,782  50%  9,688 12,554 14,935
 FY16Q3  1-31-16   6,672  3,896  2,776  42% 15,418 15,189 22,433
 FY16Q4  4-30-16  18,783  9,721  9,062  48% 15,418 15,189 24,212
 FY17Q1  7-31-16   5,609  3,062  2,547  45% 21,531 25,274 21,731
 FY17Q2 10-31-16  23,370 15,441  7,929  34% 17,980 25,924 26,928
 FY17Q3  1-31-17  10,747  7,974  2,773  26% 26,367 33,829 26,210
 FY17Q4  4-30-17  17,904 11,782  6,122  34% 28,500 33,099 17,017
 FY18Q1  7-31-17  27,077 20,448  6,629  24% 13,433 24,235 14,322
 FY18Q2 10-31-17  12,782 16,242 -3,460 -27%  7,473 16,518 13,138
 FY18Q3  1-31-18   6,819 10,951 -4,132 -61%  6,633 14,218 17,602
 FY18Q4  4-30-18   6,943  8,904 -1,961 -28% 10,922 16,129 17,013
 FY19Q1  7-31-18  12,589 11,397  1,192   9% --,---  9,168 --,---*
 FY19Q2 10-31-18  10,178  9,844    334   3% --,---  9,736 --,---*
 FY19Q3  1-31-19  13,781 11,731  2,050  15% --,---  8,660 --,---*
 FY19Q4  4-30-19  17,055 13,407  3,648  21% --,---  6,557 --,---*
 *7-31-18 10Q: “prior-yr amts related to deferred revenue
 & cust deposits have been reclass’d to contract liabilities.”
 ...q/e  4-30-18: contract-liabilities=27,935 <=reclassified
 ...a/o  7-31-18: contract-liabilities=17,994
 ...a/o 10-31-18: contract-liabilities=17,307
 ...a/o  1-31-19: contract-liabilities=14,620
 ...a/o  4-30-19: contract-liabilities=14,651

 FY13 TOTAL:      21,333 12,595  8,738  41%*
 FY14 TOTAL:      22,294 13,110  9,184  41%*
 FY15 TOTAL:      26,744 15,393 11,151  42%*
 FY16 TOTAL:      44,357 22,966 21,391  48%*
 FY17 TOTAL:      57,630 38,259 19,371  34%*
 FY18 TOTAL:      53,621 56,545 -2,924  -5%*
 FY19 TOTAL:      53,603 46,379  7,224  13%*
 *Avid Net-Profit(Selling/G&A) not split out from PPHM-Corp. in the fin’s.

 AVID TOTAL REV’s BY YEAR):
 FY04 4-30-04   3,039 (Avid-Revs didn’t incl. Avid’s Gov’t work)
 FY05 4-30-05   4,684
 FY06 4-30-06   3,005
 FY07 4-30-07   3,492
 FY08 4-30-08   5,897
 FY09 4-30-09  12,963
 FY10 4-30-10  13,204
 FY11 4-30-11   8,502
 FY12 4-30-12  14,783
 FY13 4-30-13  21,333
 FY14 4-30-14  22,294
 FY15 4-30-15  26,744
 FY16 4-30-16  44,357
 FY17 4-30-17  57,630
 FY18 4-30-18  53,621
 FY19 4-30-19  53,603
 **TOTAL:     349,151 (5/1/2003–4/30/19)
 .
 QTLY. NET PROFIT/LOSS BY QTR:
 (“attributable to common stockholders”; ie, incl. PREF Div’s**)
 **2-11-14: PPHM Raises $16.2M, 700k Pref. Shares w/10.5% DIV.
 FY16Q1  7-31-15 -15,101,000
 FY16Q2 10-31-15 -14,578,000
 FY16Q3  1-31-16 -18,227,000
 FY16Q4  4-30-16 -13,264,000
 FY17Q1  7-31-16 -12,437,000
 FY17Q2 10-31-16  -4,498,000
 FY17Q3  1-31-17  -9,216,000
 FY17Q4  4-30-17  -6,714,000
 FY18Q1  7-31-17  -2,647,000
 FY18Q2 10-31-17 -14,066,000
 FY18Q3  1-31-18 -12,446,000
 FY18Q4  4-30-18  +1,578,000 <=includes $9,154,000 income from disc. operations.
 FY19Q1  7-31-18  -3,403,000
 FY19Q2 10-31-18  -2,893,000
 FY19Q3  1-31-19  -2,581,000
 FY19Q4  4-30-19  -1,106,000

 Period        Halozyme ADC-Therap. Coherus-BioSci. Other-Custs
 FYE  4-30-14     91%                                    8%
 FYE  4-30-15     79%                                    9%
 FYE  4-30-16     69%                     26%            5%
 FYE  4-30-17     58%                     26%           16%
 FYE  4-30-18     55%      9%             22%           14%
 FYE  4-30-19     30%     21%             13%           36%
 ...(cust. splits not given in 7-31-18+ 10Q’s)
Updated PPHM REVS-BY-QTR TABLE, now thru FY19'Q4(qe 4-30-19), per the 10-K (http://tinyurl.com/yxukx6t4 ) issued 6-27-19.
• Total Avid Revs since May’03: $349.2M
• 6-27-19: FY'20 (May'19-Apr'20) Avid revs guidance $64-67M (committed B/L=$46 at 4-30-19).
 AVID GROSS PROFITABILITY BY QTR:            DEFER          CUST
 QTR  (1000’s)      Rev$  COGS$  Prof$  GP%   REV$ INVEN$   DEP.
 FY17Q1  7-31-16   5,609  3,062  2,547  45% 21,531 25,274 21,731
 FY17Q2 10-31-16  23,370 15,441  7,929  34% 17,980 25,924 26,928
 FY17Q3  1-31-17  10,747  7,974  2,773  26% 26,367 33,829 26,210
 FY17Q4  4-30-17  17,904 11,782  6,122  34% 28,500 33,099 17,017
 FY18Q1  7-31-17  27,077 20,448  6,629  24% 13,433 24,235 14,322
 FY18Q2 10-31-17  12,782 16,242 -3,460 -27%  7,473 16,518 13,138
 FY18Q3  1-31-18   6,819 10,951 -4,132 -61%  6,633 14,218 17,602
 FY18Q4  4-30-18   6,943  8,904 -1,961 -28% 10,922 16,129 17,013
 FY19Q1  7-31-18  12,589 11,397  1,192   9% --,---  9,168 --,---
 FY19Q2 10-31-18  10,178  9,844    334   3% --,---  9,736 --,---
 FY19Q3  1-31-19  13,781 11,731  2,050  15% --,---  8,660 --,---
 FY19Q4  4-30-19  17,055 13,407  3,648  21% --,---  6,557 --,---

 FY13 TOTAL:      21,333 12,595  8,738  41%
 FY14 TOTAL:      22,294 13,110  9,184  41%
 FY15 TOTAL:      26,744 15,393 11,151  42%
 FY16 TOTAL:      44,357 22,966 21,391  48%
 FY17 TOTAL:      57,630 38,259 19,371  34%
 FY18 TOTAL:      53,621 56,545 -2,924  -5%
 FY19 TOTAL:      53,603 46,379  7,224  13%

 Period        Halozyme ADC-Therap. Coherus-BioSci. Other-Custs
 FYE  4-30-14     91%                                    8%
 FYE  4-30-15     79%                                    9%
 FYE  4-30-16     69%                     26%            5%
 FYE  4-30-17     58%                     26%           16%
 FYE  4-30-18     55%      9%             22%           14%
 FYE  4-30-19     30%     21%             13%           36%

