 News
News  Market Data
  Discover
Support: 888-992-3836
Copyright © 2023 InvestorsHub Inc.


DOW 18,000 ?
nowwhat2
![]()
DOW 18,000 ?
Register for free to join our community of investors and share your ideas. You will also get access to streaming quotes, interactive charts, trades, portfolio, live options flow and more tools.
Register for free to join our community of investors and share your ideas. You will also get access to streaming quotes, interactive charts, trades, portfolio, live options flow and more tools.
DOW 18,000 ?
Yeah but that's that we said when they were yielding 12 percent....
Now they're down to 4.5
The trend is his friend maybe : Mister Bernanke
Be wary : Of Holiday Shennanigans 2013 :


REMEMBER : When the cat is away, the RATS will PLAY !.....*As evidenced this past week
nw 2013
Is about 9 months later : and just LOOK at what gold's done...
Them folks at my former posting site ?....
Just HATED what they deemed my "overly simple charts" !....
Why, they hated them so much that they even PROHIBITED me from sharing them.....
And just LOOK at what gold's done since : (lol)

Patience remains a virtue these days

And yet these QE's are "costing" each and every American citizen, about
$ 265 dollars per month (85 billion divided by 260 million people =
$ 265 dollar bucks each).....*Or so I have (more or less) heard.
Good luck
Devaluing the dollar until America can compete with overseas wages is what these QE's are all about.....
Still got a long, long ways to go !...(Africa's grabbing the jobs)
nw2013
Post number one one four four four ?
Excellent choice there cue !
Sheesh....Last month I was thinking 1600 :

Am I this month now suddenly switching to 12 ???....No ;

I'll let the HUI (Miners) decide !
Haven't yet broken their 3 month-old uptrend line
Have a look at that chart again, at : http://investorshub.advfn.com/boards/read_msg.aspx?message_id=92229747
For, isn't the "Trend-Line" closer to 230 ?
Regardless, there are ALSO such things known as "Poke-Thrus" you know....
And in MY perfect world THAT'd be the best price to buy a couple of (well-selected) miners
Load up at HUI 2-22
Because, there's probably a nowwhat-style algo parked there
Well, I'm certainly still certain of this opinion right here :
In fact, that whole Ben Bernanke No Taper decision ?.....
Was quite possibly and magnificently, and perfectly FORETOLD by the oft-depicted chart depicted here and herein :
http://investorshub.advfn.com/boards/read_msg.aspx?message_id=92078629

Hey, this might just be one of China's "Golden Weeks" .....Who knows ?
Because evidently their markets have been closed : Hong Kong for one day and the Shanghai for two.
They HAVE 2 of the freaking things (these "Golden Weeks" per yea).....
and things often seem to get cycled around them
Whatever's occurring is being globally orchestrated : It is NOT just Ben Bernanke
See how this whole Rocket-Affair immediately proceeded that G-20 Summit ? and Canadian Bank Fraud Week ? (and triple whiching, etc., etc.)
Who'd wanna be restricted to holding for at least 90 days ?...Lol : No thanks !...
Why, I'd LIKE to be able to Kwik-Flip a trade, as much as the next guy out there....
BUT....but not at $40 bucks per frickin' trade.

No - I don't have long term views at all !.....
I USE long term views as a tool only....
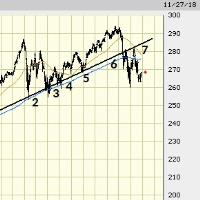
See the 2 charts below here for an example :
Of how I'd use Long Term charts to time a quick In and Out

Hey ! Look at that eh ? : Have I just fixed my formatting ?....
By saving my chart(s) in a word document first ?
Am I able to post charts without stupid spaces between 'em ?

No I don't believe they do.....But bear in mind that the variety in our funds nowhere near rivals America's....* I think I see where you were headed with your question......To : "Well why don't you just trade Rydex's Bull and/or Bear Funds ?"......(or so-and so's GDX Juniors Funds ? etc. to a SOX Fund - A Homebuilders, etc.....Yes ? No ?
I wouldn't worry too much about this pullback
For y'see, Wall Street doesn't LIKE getting caught by surprise
Such as that freaking No Taper move.....Hence :
That which gaps up ?.....Must sometimes quickly close
Plus look at your chart's Up volume compared to it's Down....
No, Wall Street never LIKES getting caught by surprise.....
*That's one of my main market tenaments
Good Luck
No such thing as "Scottrades" up here in Canada - Because OUR Banksters have THAT market all nicely wrapped up.
Interesting point about the miners you make too....but surely even if true, that couldn't totally explain things (the exact same valuations as in 1996)
Yup and or Nope : If WE wish to be executing them nice $8.oo dollar trades, we need to be on "The Trade At Least 80 Times Per Month Freaking Plan (or is it Times per Quarter Plan ?)....Whatever : I do not want to have to become a Day Trader just in order to have access to low cost trades.....Hence ? : It's usually at least $35 bucks each way : For a total of about $75 bucks - to flip a stock......Which, if one is working with let's say $2500 bucks, ends up representing about 3 percent (yer stock has to move UP at least 3 percent, before you start earning a penny).....It's horrific.....because accordingly one can become down 10 percent instantly.....So it's a super Catch 22 up here where, you're damned if you do trade and you're damned if you don't.
kbuilder - Good post - I sympathise with you / know what you mean :
Whole lot of company in your/our camp.....Except I'm in cash paying a lot less interest than yours - Probably just 1/4 percent, lol
Losing to inflation
My trading accouint`s getting dinged with "inactive" charges......
To the tune of something like $35 bucks per month
I should actively be trading but am just too lazy to do so, plus don't have the "technical skillset" to do so : the pc software and the risk management skills :
hence I've essentially been on the sidelines now for ages, which, which isn't where Benjamin Bernanke wants me/us !....lol 2013
Good Luck
That Trader Dan might not be much of of a chartist judging from what he wrote "The recent gains in gold prior to the FOMC release of yesterday were driven PRIMARILY by large speculator short covering and NOT by the FRESH INFLOW OF NEW HOT MONEY".
So their date was slightly off by a little, that's all....
Plus evidently they're just quoting : http://en.wikipedia.org/wiki/HUI_Gold_Index
Excerpt :
"The HUI Index was developed with a base value of 200.00 as of March 15, 1996."
HUI 200 Baby
Hey, Listen to what they mention at the 48 second mark here :
Yes that's a fine chart YB indeed (but it's missing the year 2013)
I've been hoping to stumble upon a similar chart myself.
Sadly yours' is unfortunately not quite up-to-date, but thanks !
The Great Bernanke Goose-Job ! . . . .
GET UP !.....

Yup - Beautiful calls Hd - Beautiful calls
But we'd like to see (or rather I'd to see)
any CHARTS you might be using to make those calls ?
Are you using charts, or DO you use (many or any) charts ?
Am just interested in how you arrive at your conclusions....
AND in what part of the world you are in ?
Thanks
Lol : Yup :
Was just working on that.....

Yup.....
And just like that thing that they have at the circus....
Barrick spikes up to the bell :


Yup there is Barrick eh ? lol
Called that in the post this replies to....

Barrick IS the HUI....(is something like 28 ? percent)
And....

My confidence could have been / should have been / was high....
I've a slight little belief that "The Miners" . . .
just "know things".

Could be a good one - and we'll see if that pans out
NOT simply pre-FOMC minute volatility ?
Might become an adherent of OBV if it works !
Hoping it does for you
Well looky thar eh ?
Man, who'd a done thunk it ?
From this :

To this : (could've fooled me !)

Some worrisome charts of gold :

Made up this post last night but had trouble
getting the picture sizes to fit
----------------
Re-examining occasionally produces epiphanies.
Not so much tonight tho really -
Because I don't recall or see too much significance to 1300
Knowing what levels the question marks represent ?
Would possibly be helpful.
*Ooops, can't find my chart with the ? marks !
The charting of gold has it's quirks and it's quarks.
Not many have it's true highs and it's lows !.....
The 1st chart suggests how 1300 = Insignificant.
The 2nd chart suggests how 1300 = Suddenly significant.
Could the 2nd chart be an epiphany ???


An interesting WalMart chart
And the golds are looking dicey

Accurately charting gold sure can be tricky
Seems they (not just Kitco) almost deliberately make it so

Another perspective re: QE

2 Bloomberg excerpts - Topic - Quantitative Easing :
Thanks for your posts HD
---------
America’s companies, from Apple Inc. (AAPL) to Verizon Communications Inc., are saving about $700 billion in interest payments with the Federal Reserve’s unprecedented stimulus.
---------
When Fed Chairman Ben S. Bernanke started to pump cash directly into the financial system in December 2008 by purchasing bonds in a policy known as quantitative easing, unemployment was the highest in 26 years and companies rated below Baa3 at Moody’s and less than BBB- by Standard & Poor’s faced $1.2 trillion of debt maturing through 2015. That’s been cut to about $115.8 billion, according to Barclays Plc.
http://www.bloomberg.com/news/2013-09-17/bernanke-saves-companies-700-billion-as-apple-to-verizon-borrow.html
"We're going to drive bond yields down so low, that the Stock Markets will be "The Only Good Place To Be"....
That way (eventually) some will feel rich again,
and THEY will spend money and rescue the world.....
What a frickin' stupid plan !
Never have HAD much faith in IT

The Bigcharts delisting of our Canadian Venture Exchange, has really thrown me off.....
I mean, according to Stockcharts, the index still exists.
Just not so according to Bigcharts.
I simply always found it to be an excellent benchmark, for gauging the precious miners
Lulu Lemon just reported ?
I've been thinking that it's $70 looks to be key....
But still can not figure out how to space my charts properly


