 News
News  Market Data
  Discover
Support: 888-992-3836
Copyright © 2023 InvestorsHub Inc.


Myself °¿°
![]()
Register for free to join our community of investors and share your ideas. You will also get access to streaming quotes, interactive charts, trades, portfolio, live options flow and more tools.
Register for free to join our community of investors and share your ideas. You will also get access to streaming quotes, interactive charts, trades, portfolio, live options flow and more tools.
edit yeah I'm kinda waiting for ext-hrs dump to the 4hr rising lower channel line myself
on the /ngU7 chart~ currently 2.866?
also want to see what spot did
I might hang on to it
Tracking 92L for development...


re: scramble to break even
I've been cautiously adding to my position ing
avg is now 26.46 and I'm very torn between part with it or not

Impressive 1hr candle pattern premarket bounce. (Engulfing) followed by
(three outside up) back to 2.917 "weeks ago report support low"
yeah 5min closing volume was wild
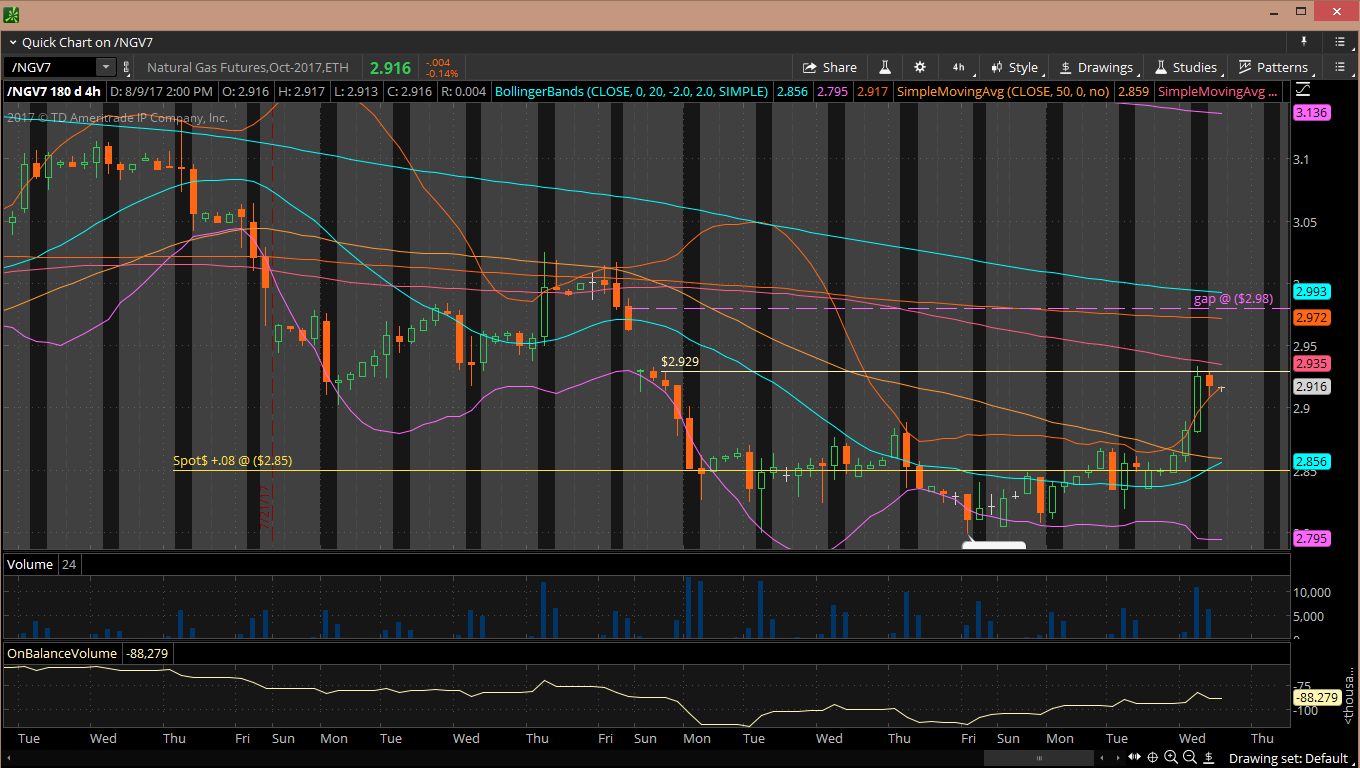
Daily Oct /ngV7 @2.903 possibly a perfect inverted H&S...
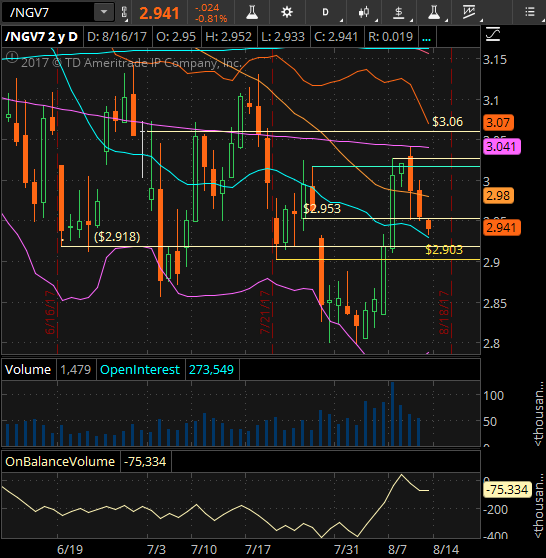
Daily Sept /ngV7 @2.903 possibly a perfect inverted H&S...
cmon 2.884-2.886
EDIT Spot$ -.03 @2.93 /ng toying with /ngU7...
"weeks ago report support low" @2.917 ext-hrs
also see /ng 2.913 ~ 3/20/17 open ext-hrs toggled ON
all my chicken scratches and notes. EDIT
click on chart and use (CTRL) & (+) to enlarge

edit /ng daily candle pattern: "bearish engulfing" followed by today's candle "three outside down"
Very bearish pattern.
dgaz daily buy confirmation = buy if printing over 24.84
Kinda hard to short while it's printing under Spot$
Why is cash price this high
unreal
Spot$ +.05 @2.96. /ng currently printing under cash price...
CLEARLY~ I don't understand what moves spot price.
I imagined it falling this week~ immediate weather.
Cooler, week over week, compared to last week.
Understanding Volume & Open Interest in Commodities: Learning Center
Technicians utilize a three dimensional approach to market analysis which includes a study of price, volume and open interest. Of these three, price is the most important. However, volume and open interest provide important secondary confirmation of the price action on a chart and often provide a lead indication of an impending change of trend. For beginning students of the market these two concepts tend to be somewhat confusing but are very important concepts to understand in- undertaking a thorough analysis of market action.
Volume represents the total amount of trading activity or contracts that have changed hands in a given commodity market for a single trading day. The greater the amount of trading during a market session the higher will be the trading volume. As mentioned earlier, a higher volume bar on the chart means that the trading activity was heavier for that day. Another way to look at this, is that the volume represents a measure of intensity or pressure behind a price trend. The greater the volume the more we can expect the existing trend to continue rather than reverse. Technicians believe that volume precedes price, meaning that the loss of upside price pressure in an uptrend or downside pressure in a downtrend will show up in the volume figures before presenting itself as a reversal in trend on the bar chart.
Open Interest is the total number of outstanding contracts that are held by market participants at the end of each day. Where volume measures the pressure or intensity behind a price trend, open interest measures the flow of money into the futures market. For each seller of a futures contract there must be a buyer of that contract. Thus a seller and a buyer combine to create only one contract. Therefore, to determine the total open interest for any given market we need only to know the totals from one side or the other, buyers or sellers, not the sum of both.
Each trade completed on the floor of a futures exchange has an impact upon the level of open interest for that day. For example, if both parties to the trade are initiating a new position ( one new buyer and one new seller), open interest will increase by one contract. If both traders are closing an existing or old position ( one old buyer and one old seller) open interest will decline by one contract. The third and final possibility is one old trader passing off his position to a new trader ( one old buyer sells to one new buyer). In this case the open interest will not change. By monitoring the changes in the open interest figures at the end of each trading day, some conclusions about the day?s activity can be drawn. Increasing open interest means that new money is flowing into the marketplace. The result will be that the present trend ( up, down or sideways) will continue. Declining open interest means that the market is liquidating and implies that the prevailing price trend is coming to an end. A knowledge of open interest can prove useful toward the end of major market moves. A levelling off of steadily increasing open interest following a sustained price advance is often an early warning of the end to an uptrending or bull market.
The relationship between the prevailing price trend, volume, and open interest can be summarized by the following table.
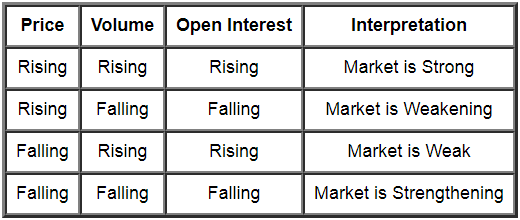
It is important to understand that the commodity price chart only records the data. In itself, it has little value. By monitoring the price trend, volume and open interest the technician is better able to gauge the buying or selling pressure behind market moves. This information can be used to confirm a price move or warn that a price move is not to be trusted. This will provide you with valuable information to develop a suitable pricing strategy and an appropriate production-marketing plan for your farming operation.
http://futures.tradingcharts.com/learning/volume_open_interest.html
Understanding Volume & Open Interest in Commodities: Learning Center
Technicians utilize a three dimensional approach to market analysis which includes a study of price, volume and open interest. Of these three, price is the most important. However, volume and open interest provide important secondary confirmation of the price action on a chart and often provide a lead indication of an impending change of trend. For beginning students of the market these two concepts tend to be somewhat confusing but are very important concepts to understand in- undertaking a thorough analysis of market action.
Volume represents the total amount of trading activity or contracts that have changed hands in a given commodity market for a single trading day. The greater the amount of trading during a market session the higher will be the trading volume. As mentioned earlier, a higher volume bar on the chart means that the trading activity was heavier for that day. Another way to look at this, is that the volume represents a measure of intensity or pressure behind a price trend. The greater the volume the more we can expect the existing trend to continue rather than reverse. Technicians believe that volume precedes price, meaning that the loss of upside price pressure in an uptrend or downside pressure in a downtrend will show up in the volume figures before presenting itself as a reversal in trend on the bar chart.
Open Interest is the total number of outstanding contracts that are held by market participants at the end of each day. Where volume measures the pressure or intensity behind a price trend, open interest measures the flow of money into the futures market. For each seller of a futures contract there must be a buyer of that contract. Thus a seller and a buyer combine to create only one contract. Therefore, to determine the total open interest for any given market we need only to know the totals from one side or the other, buyers or sellers, not the sum of both.
Each trade completed on the floor of a futures exchange has an impact upon the level of open interest for that day. For example, if both parties to the trade are initiating a new position ( one new buyer and one new seller), open interest will increase by one contract. If both traders are closing an existing or old position ( one old buyer and one old seller) open interest will decline by one contract. The third and final possibility is one old trader passing off his position to a new trader ( one old buyer sells to one new buyer). In this case the open interest will not change. By monitoring the changes in the open interest figures at the end of each trading day, some conclusions about the day?s activity can be drawn. Increasing open interest means that new money is flowing into the marketplace. The result will be that the present trend ( up, down or sideways) will continue. Declining open interest means that the market is liquidating and implies that the prevailing price trend is coming to an end. A knowledge of open interest can prove useful toward the end of major market moves. A levelling off of steadily increasing open interest following a sustained price advance is often an early warning of the end to an uptrending or bull market.
The relationship between the prevailing price trend, volume, and open interest can be summarized by the following table.
It is important to understand that the commodity price chart only records the data. In itself, it has little value. By monitoring the price trend, volume and open interest the technician is better able to gauge the buying or selling pressure behind market moves. This information can be used to confirm a price move or warn that a price move is not to be trusted. This will provide you with valuable information to develop a suitable pricing strategy and an appropriate production-marketing plan for your farming operation.
http://futures.tradingcharts.com/learning/volume_open_interest.html
some resistance @ /ng 2.962 friday's premarket low?
now we see if /ngV7 @2.98 is resistance
nearing 2 more points of interest: momentum reset and...
report support low 2.917
https://www.investing.com/economic-calendar/natural-gas-storage-386
5 bullish report in a row ^
suggests possible support @ the first bullish reports low and is also a momentum reset... penny over Spot$
We'll see if it holds up

keep an eye on /ngV7 @2.98 an old gap it came up through... see if it finds support there
Tracking 91L for development...
http://www.nhc.noaa.gov/gtwo.php?basin=atlc&fdays=5


hi eric4x isn't the vix due for a 30spike...

It's not exactly a slam dunk is it...
edit /ngU7 +.23% /ngV7 flat...ran out of edit time
on that post
contango between these 2 are slipping a bit today...#msg-133749930
Oct is reluctant to speculate
/ngUt +.23%
/ngV7 flat
Good morning: I saw one when I was a teenager in the 70's eastern wa...
It was the coolest natural thing I'd ever seen...
until I witnessed my daughter being born
I really want her to see it
expecting rain here sunday... what a relief that will be
everything is as dry as a bone
burn bans are on
very cool...
contacts database
lot you can do with that...
merge print labels for mass mail outs
could use it for future gun show promotions too
Been trying to plan the coming solar eclipse...
Everywhere is booked the night before.
So I started looking at campsites...
No single nights... 300 week was the best I found... pfft
150 miles south to be in the perfect path... I'll just get up early.
I can't ever remember the northwest having so many fires.
We have smoke coming in from every direcoin... the Canada fire is overwhelming and when the wind changes for a day we get smoke from the Portland fire.
I hear Oregon is just as bad... add smoke coming in from Montana.
Sure hope this mess clears up soon
This is not a sunset photo... smoke.
... it's strange being able to stare at the sun

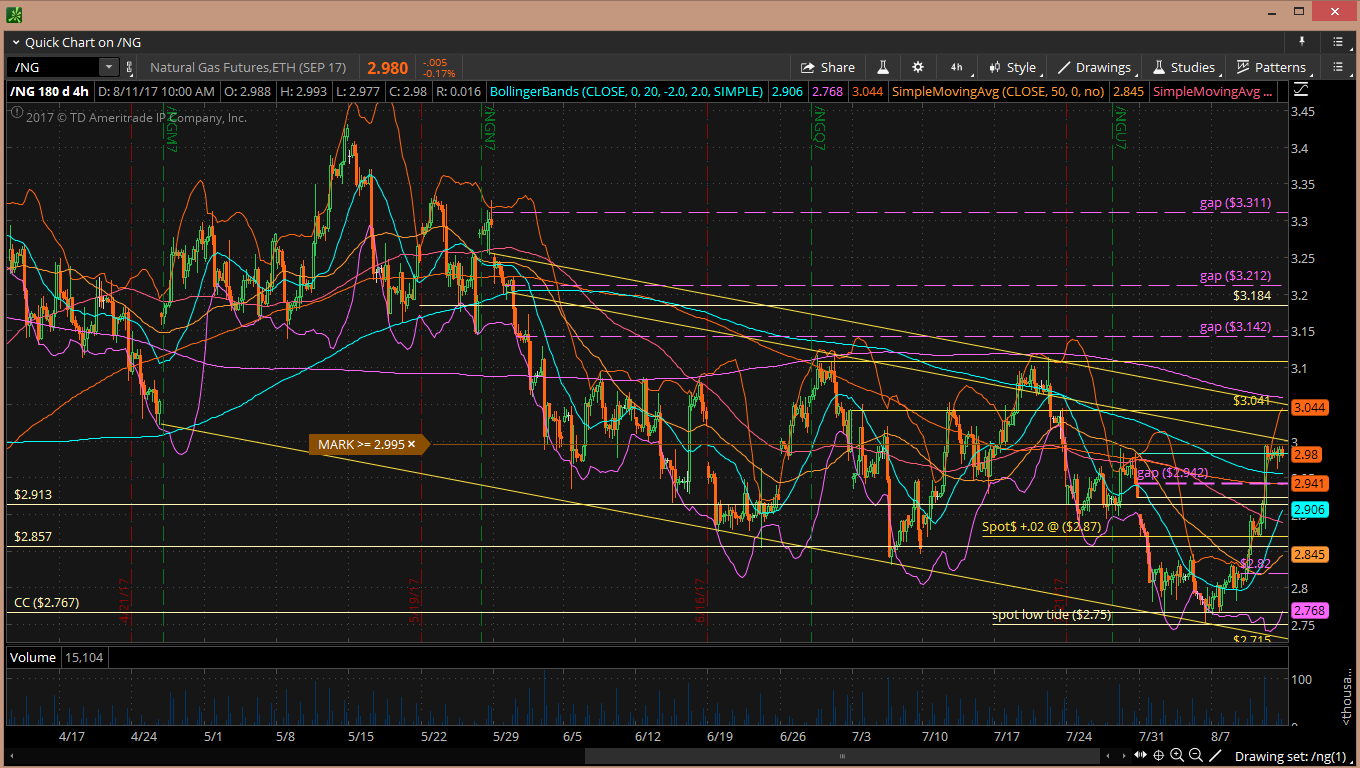
Short tomorrow's strength and stay short Friday if closes under light blue?
Spot +.02 @2.87 https://www.investing.com/commodities/natural-gas-contracts?page=chart&symbol=NGY00
weather https://www.tropicaltidbits.com/analysis/models/?model=gfs®ion=us&pkg=z500a&runtime=2017081018&fh=372&xpos=0&ypos=67.5
5min H&S or is this thing headed for 3.02-.06
And go-kart mozart was checking out the weather chart to see if it was safe outside
pfft
https://www.tropicaltidbits.com/analysis/models/?model=gfs®ion=us&pkg=z500a&runtime=2017080918&fh=372&xpos=0&ypos=67.5
a peak @ Oct...
ugaz/dgaz is rolling from Sep /ngU7 into Oct /ngV7
http://www.velocitysharesetns.com/dgaz
Spot$ +.08 @2.85
https://www.investing.com/commodities/natural-gas-contracts?page=chart&symbol=NGY00
my 2.71-2.72 target is +/- .20 below the last print of this chart
yeah these little ext-hrs 2.81 tails of hanging hammers are starting to chap my hide
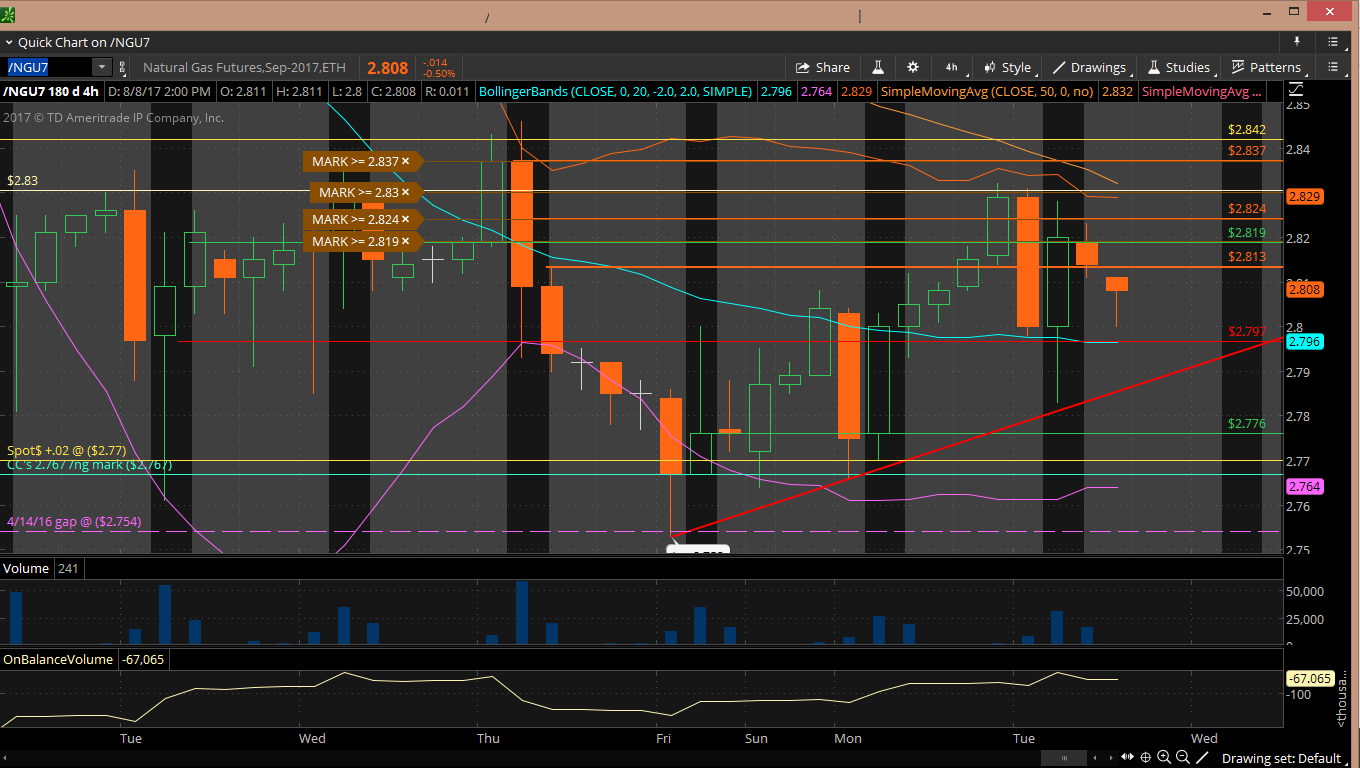
right now...I can't trade  I fully expected that last double thick orange drawing alert
@2.837 to sound but it did't... that's why my late entry.
I should know better... It'll probably be waking me up via text push to the cell pone over night.
I don't want to make the decision tomorrow... add, hold or bail
I'd rather add the other 1/2 on the way down
break the red tail trend/line... convince them all
c'mon +/- 2.71... That's My .02 ta and how I'm trading it 
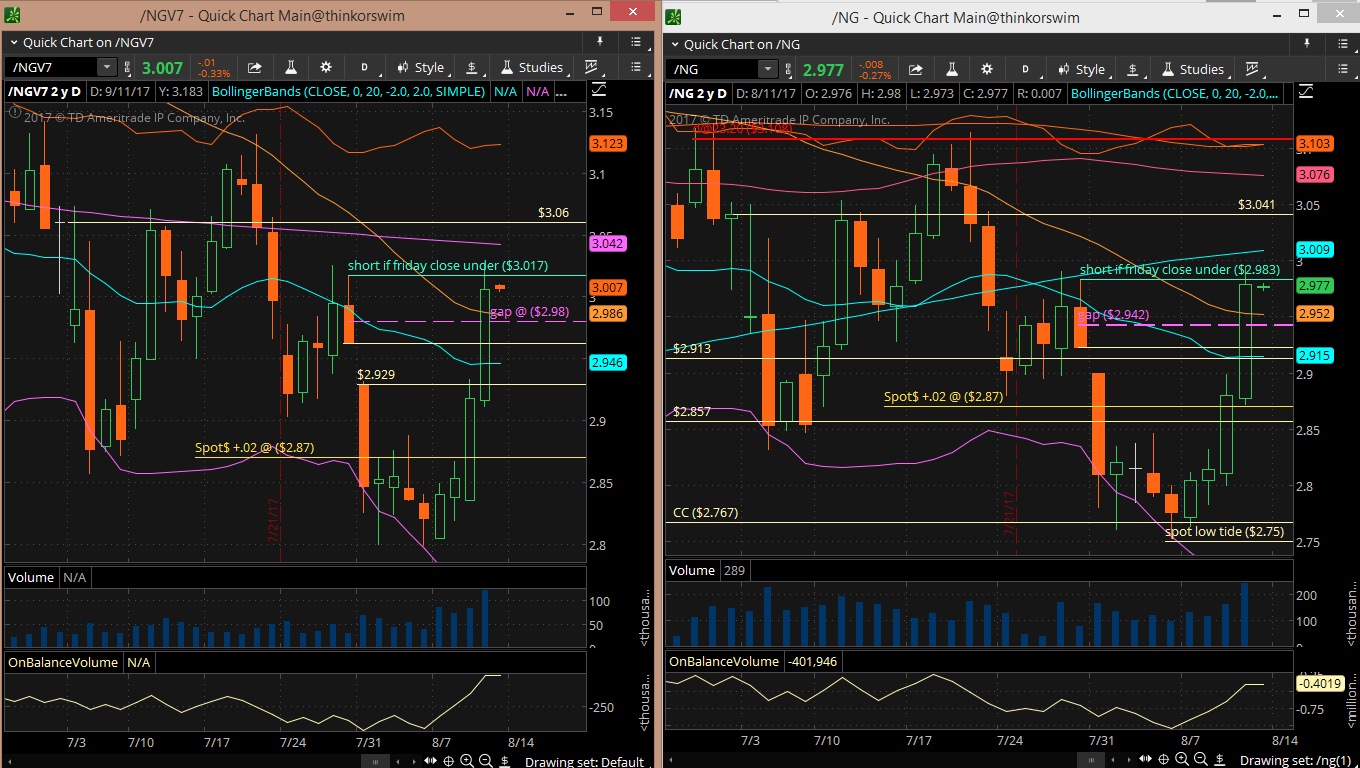
why the 1/2 order... 2 charts...
a few reasons...
* On one hand: OBV didn't close @ or above the yellow but it did intraday
while the candle was being produced.
* On the other hand: OBV didn't reach the yellow line last time either 8/2 date.
so... there is some room to add more or fold tomorrow
* Fearing 2.884... could change everything... don't like scrambling to break even
* Spot +.02 @2.77... is 2.75 low tide or not... forecast
* add negative sentiment or not
* & this is /ng ;-/
overall 4hr OBV... like to see the red tail trend/line break
click on the chart to enlarge and then use (Ctrl +) to enlarge or (Ctrl -) to... -
or see the next chart

so ready to see /ng shave off 10 points
Just curious what your chart looks like... interested.
searched your posts for your chart...
back to the 28th... couldn't find it
did you post one?
1/2 position short short @ my 2.819 mark
2.5 hrs to fix/ramp that 4hr candle OBV
tempted to go long in here for a scalp
rat bastards... so tired of getting cheated out of an awesome entry due to the time of night
trade time restrictions
I'm not chasing anything
cash is a hard trade to stay in
trying to be patient
what is gaz thinking...
could have forced many shares to change hands/positions
and could have ripped it the other direction eod
smh... GET UP AND RUN!

