 News
News  Market Data
  Discover
Support: 888-992-3836
Copyright © 2023 InvestorsHub Inc.


TinkerBelle
![]()
Register for free to join our community of investors and share your ideas. You will also get access to streaming quotes, interactive charts, trades, portfolio, live options flow and more tools.
Register for free to join our community of investors and share your ideas. You will also get access to streaming quotes, interactive charts, trades, portfolio, live options flow and more tools.
Thanks only_katx. ---- Pope, thanks for going to the conference and keeping us all informed.
I think I agree with Gump for once. :o)
Good to see you back Patriots33! I am looking forward to next week also. :o)
Nice find only_katx! Lots going on for our Kat. Now becoming a BIG KAT.
Long and strong here since December 2009! :o)
Lots of great info Rick-Uk! Thanks
Not exactly sure.........Good things coming IMO :o)
Good morning all! Why would Mr. Stead remove our good old Flow Chart from the blog? hmmmmmmmmmmmmm...... Good news coming????
Very telling post AbrahamS. Thanks!
HISTORY OF SHARE STRUCTURE REDUCTIONS:
As per the Third Quarter Disclosure statement posted October 11, 2010, they reduced the float by ANOTHER 41,383,486 shares!
http://www.otcmarkets.com/otciq/ajax/showFinancialReportById.pdf?id=37338

----------------------------------------------------------------
2,000,000,000 shares were retired January,14 2010
Quote:Kat Exploration Inc. would like to inform its investors that it has retired and eliminated 2,000,000,000 shares from its treasury of authorized shares which was originally 3,030,000,000 shares. The new amount of authorized shares is 1,030,000,000 shares.
http://www.marketwire.com/press-release/Kat-Exploration-Retires-and-Eliminates-2-Billion-Shares-From-Treasury-1101927.htm
-----------------------------------------------------------------
Retired an additional 300,000,000 on January 19, 2010:
Quote:KAT Exploration Inc...has made the decision to retire and eliminate an additional 300,000,000 shares from its treasury of authorized shares of which the new amount of authorized shares will be 730,000,000 shares. Both the company and the group of private investors believe that this reduction will further enhance and solidify shareholder confidence with its secondary directions.
http://www.marketwire.com/press-release/KAT-Exploration-Retires-Additional-300-Million-Shares-Engages-New-Consulting-Group-Dual-1103663.htm
-----------------------------------------------------------------
and then…
Quote:XXXXX,
That is correct, we saw fit to remove approx.. another 8 MILLION shares from the I/O which were restricted stock from within. They were restricted and would have come open at the end of may. Just a goodwill gesture toward investors.
K Stead
NOW, HOW ABOUT FINANCING?
Quote:KAT Exploration has secured funding for up to $5 million. The funding contract GUARANTEES $1 million over the next 6 months and the remaining $4 million to be delivered upon agreements within the contract being achieved over the course of the following 6 months of no specific date. The funding is to provide operational support for Kat for at least the next 5 years. The funding was secured with 50,000,000 restricted shares.
Kat Exploration has retired its previously executed REG-D 504. There are no REG-D 504 offerings, warrants or options in place to date.
http://www.marketwire.com/press-release/Kat-Exploration-Secures-up-5-Million-Funding-With-50-Million-Restricted-Shares-Retires-1102443.htm
Info from Biochemist2002 in the stickies above. :o)
Trust the words of (Woods).....Our Woods!!.......Dennis Woods, AKA DR. DENNIS WOODS... ABOUT RR....IN IT (SEVERAL TIMES) AND (SEVERAL WAYS) DR WOODS TALKS OF HOW (((( DENSE ))) THE DEPOSIT AT RR IS/ARE....(( EXTREMELY DENSE ))....AND HE SPECULATES THAT RR COULD ALSO BE A ...QUOTE ''''SULPHIDE''' DEPOSIT!!!.......
http://gis.geosurv.gov.nl.ca/geofilePDFS/ReceivedBatch19/NFLD_2779.pdf

Well Geo Newf.....you live closer than I ....I hope you do visit...and speak with all our Geos at the conference ....but it is not just one report that states Handcamp is a Felsic VMS...but the Canadian reports do as well ......I hope you get a chance to go there and actually see.......Personally what got me excited about Handcamp in the first place was last winter getting the chance to speak with Ken Stead on Skype myself.... his discriptions of the ancient history of how Handcamp was created millions and millions of years ago was exciting to say the least .... References Canada Department of Energy, Mines and Resources, 1980, Canadian mineral deposits not being mined in 1980: Mineral Policy Sector Internal Report MRI 80/7, 294 p.
Geological Survey of Canada, 1967, Geology Island of Newfoundland: Map 1231A, scale 1:1,000,000.
Stephens, M.B., Swinden, H.S., and Slack, J.F., 1984, Correlation of massive sulfide deposits in the Appalachian-Caledonian orogen on the basis of paleotectonic setting: Economic Geology, v. 79, no. 7, p. 1442-1478. SEEING IS BELIEVING
geo_newfie, Have you read both the Canadian and USGS reports that say it is a felsic VMS...
http://tin.er.usgs.gov/vms/show.php?labno=750&place=fCA05
And of course Ken and the Other Geos on site.....
I truly appreciate your input and opinions here geo_newfie. Thanks :o)
Hand Camp Felsic volcanogenic massive sulfide deposit, 14 of 40 in Newfoundland province (in Canada)
http://tin.er.usgs.gov/vms/show.php?labno=750&place=fCA05 AND THE DATA THE USGS USED IS HERE .... References Canada Department of Energy, Mines and Resources, 1980, Canadian mineral deposits not being mined in 1980: Mineral Policy Sector Internal Report MRI 80/7, 294 p.
Geological Survey of Canada, 1967, Geology Island of Newfoundland: Map 1231A, scale 1:1,000,000.
Stephens, M.B., Swinden, H.S., and Slack, J.F., 1984, Correlation of massive sulfide deposits in the Appalachian-Caledonian orogen on the basis of paleotectonic setting: Economic Geology, v. 79, no. 7, p. 1442-1478.
On the Kat website it says it was hole #12
http://www.katexploration.com/
Diamond drill hole DDH 012 intersected 5.5 g/t (0.16 oz./ton) gold over 1.8 m (1.4 m estimated true width) within a wider interval grading 3.5 g/t gold (0.10 oz./ton) over 3.5 m (2.6 m estimated true width). Both intersections occur within an even broader mineralized zone defined by elevated gold that includes 1.2 g/t gold over 20.9 m (15.6 m estimated true width) in DDH 004 and 1.0 g/t gold over 17.8 m (13.3 m estimated true width). Three other holes (DDH-002, 003 and 005) also intersected strong gold mineralization over wide widths as shown in the summary table. The gold is typically accompanied by elevated silver, lead and zinc.
Results of the current exploration program indicate that the mineralized zone at Handcamp is outlined well by induced polarization geophysics. The current drilling program tested the mineralized zone for approximately 0.9 km along strike (trend) at 250m to 300m spaced intervals and to a maximum vertical depth of 200 m. DDH 012 is the southwestern most drill hole of the current program and is approximately 600m southwest of the main Handcamp showing. During the second phase of exploration, the mineralization in DDH 012 will be tested to depth and along strike to the northeast and southwest where the IP anomaly has been traced a further 500 m and remains open. Two other induced polarization anomalies subparallel to that delineating the Handcamp mineralized zone remain to be tested by diamond drilling. One, about 350 m to the northwest, has been traced for 1.2 km and remains open and the second is about 900m to the northwest, and has been traced for 700 m and remains open. The two anomalies are viable targets for testing in the second phase of exploration.
I took it as "This will be 10X more this time (in this) area as we are looking for massive sulphides." But you should ask geo-newfie what he meant. :o)
YES!!!...EXACTLY SURFER... HUGE OUTLAYS BY VALE ON THE BONIVISTA . http://i.current.com/images/asset/905/160/58/1SRRu7.jpg .... VALE HAS 300 SQUARE KILOMETERS "A Sea of Yellow" SURROUNDING BOTH OF OUR ZAMBIAN STYLE LUCKYS! AKA WE GOT AN OPTION AGREEMENT WITH THE SECOND LARGEST MINING CO IN THE WORLD....AND I KNOW NAY SAYERS WILL SAY SO WHAT!...I SAY SHOW ME WHERE VALE ((( ALSO ))) HAS 300+ SQUARE MILES SURROUNDING ((( ANYTHING!! )))
THANKS GEO NEWF ..HANDCAMP IS A VOLCANIC MASSIVE SULPHIDE CORRECT?....AND WOODS SPECULATED THAT IT (RUSTY) WAS DENSE ENOUGH TO BE A MASSIVE SULFIDE DEPOSIT AS WELL... CORRECT?......MANY HERE REALY DON'T SEE THE POSSIBILITIES OF WHAT RUSTY COULD VERY WELL BE !!..... "This will be 10X more this time area as were are looking for massive sulphides!" "This will be 10X more this time area as were are looking for massive sulphides!" "This will be 10X more this time area as were are looking for massive sulphides!" "This will be 10X more this time area as were are looking for massive sulphides!" "This will be 10X more this time area as were are looking for massive sulphides!" .....I AM (((ALL IN ))) WITH FINGERS CROSSED GOD BLESS KAT GOD BLESS KEN ..AND GOD BLESS ALL OF US!!!
"The truth shall set you free"
Around the same time that our Handcamp Property was purchased by BVIG/Kat Gold Holdings, (Which by the way is still ours! ), KATX announced that it had added "Cabot" Copper/Gold Property to their list of properties.
Another great Copper/Gold property in KATX!
KAT Exploration Inc. Announces Option Agreement to Purchase 100% of the "Cabot" Copper/Gold Properties
July 19, 2010. KAT Exploration Inc. is pleased to announce that it has completed the signing of an option agreement with PNL Ventures Ltd, and Weyburn Investments Limited, for the Cabot properties, consisting of 138 claims in five separate licenses, located on the Baie Verte peninsula, Newfoundland.
KAT has agreed to acquire a 100 percent interest in the Cabot properties over a five-year period in consideration of total cash payments of $560,000, which includes a payment of $40,000 on signing and the remaining $520,000 over the remainder of the agreement. The agreement also includes a stock issuance of 3,000,000 shares, with 150,000 shares to be issued upon signing and the remaining 2,850,000 over the remainder of the agreement.
KAT also agrees to allocate minimum expenditure of $1.2 million over the five year term of the agreement and complete a National Instrument 43-101 on the Cabot properties.
If upon completion of a feasibility study of the Cabot Properties, KAT will pay a further four million shares, whereby it will then have earned 100% of the five licenses which make up the Cabot properties.
PNL Ventures Ltd, and Weyburn Investments Limited, will also retain a 2.5% NSR [Net Smelting Return] in which KAT Exploration has the right to purchase 1.5% of the 2.5%NSR for a total amount of $3.5 million.
Kat Exploration will be the operator of the project during the option period.
The Cabot properties are located on the Baie Verte Peninsula which is one of Newfoundland's most historic and prolific mining districts. Down through the years the Baie Verte peninsula alone has be host to numerous Copper, Gold and Massive Sulfide deposits. The "Tilt Cove" mine, the "Rambler" mine and the "Bretts Cove" mine to name just a few were all massive sulfide deposits. The "Deer Cove" mine, the "Nugget Pond" mine and the still operating "Pine Cove" mine were/are gold deposits.
The "Cabot Property," with its significant new Copper/Cobalt/Gold discoveries, is a prime example that tremendous potential still remains for new discoveries in this prolific mining region.
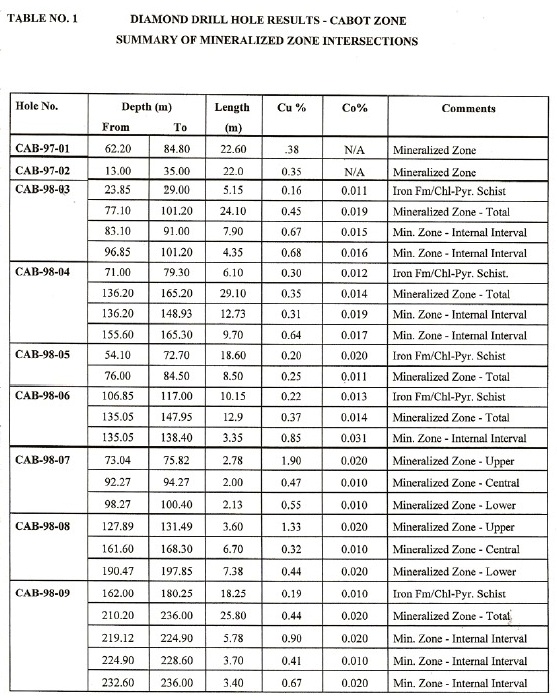
The Cabot zone consists of a discrete, intensely chloritized and moderately sericitized zone hosting an estimated 10-25% stringer/stockwork sulfides. The zone is interpreted to represent a feeder stockwork pipe commonly associated with volcanogenic massive sulfide deposits. The Cabot Zone had been tested with several past drill holes averaging 0.39% Cu over 21.6 meters with internal intervals grading up to 0.90% Cu over 5.78 meters. The best grade intersections over an appreciable width encountered 1.90% Copper over 2.78 meters and 1.33% copper over 3.66 meters respectively.
One mineralized zone exposed on surface, varies between 25-30 meters wide and a strike length of 700 meters. A rough calculation has indicated 18 to 20 million tons of low grade copper ore, with cobalt as a complementary mineral, together averaging approximately ½%. There are large areas of the properties unexplored with no drill testing that has the potential to increase the volume of ore significantly.
Ken Stead, President/CEO, states, "We have been in negotiations for the past several months in trying to acquire this property and very excited we've closed the deal. However, while we are excited about the Copper/Cobalt content, it's the Gold potential that is most attractive. One drill hole intersected 40 meters of anomalous gold along with one meter averaging 10 grams per ton. A number of recently discovered quartz veins have produced results of 10 grams of gold per ton with the highest reaching as high as 12 oz/ton. These are the kind of properties KAT Exploration is looking for as it continues to move forward and bring real value to its shareholders. KAT Exploration will continue to have interest in obtaining gold, copper, silver and other minerals that would prove to be substantial assets for the company. Multi-mineral ore deposits are where our focus has always been and will remain."
http://www.marketwire.com/press-release/KAT-Exploration-Inc-Announces-Option-Agreement-Purchase-100-Cabot-Copper-Gold-Properties-1292069.htm
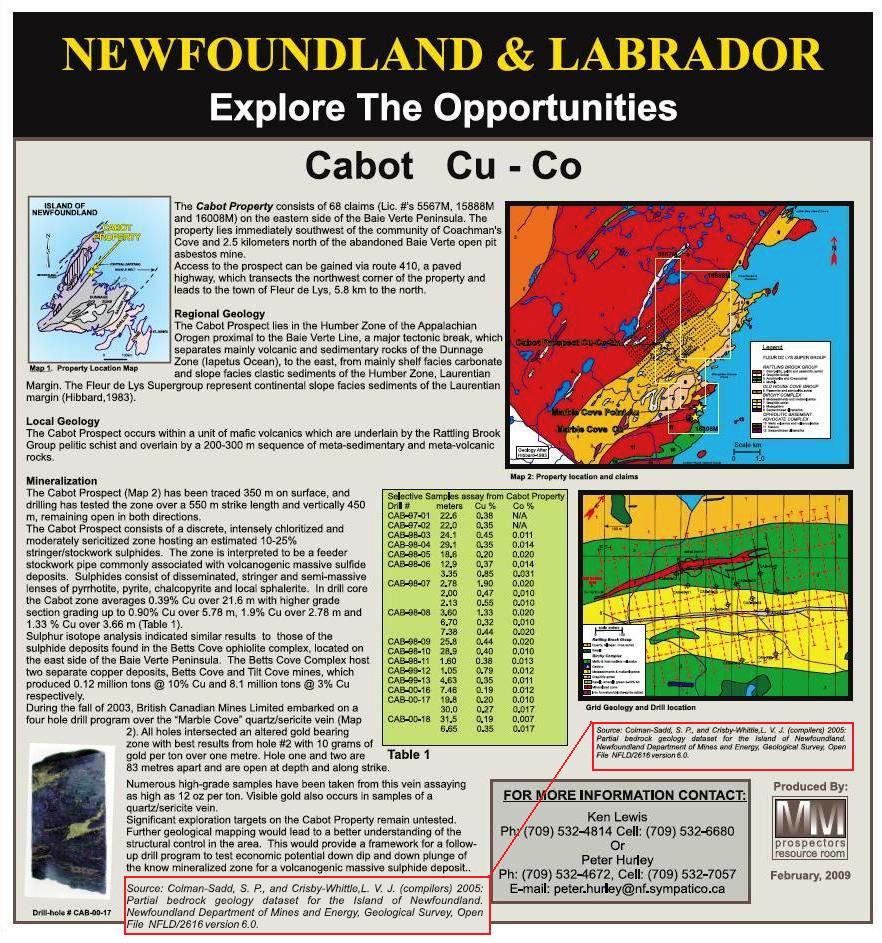
http://www.nr.gov.nl.ca/mines&en/geosurvey/matty_mitchell/Prop_for_option-copper-zinc/cabot.pdf

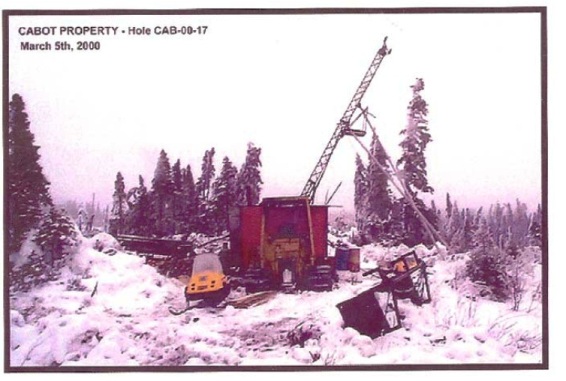
Oh yeah, and we CAN drill in the winter!
Info from Biochemist 2002 INFO in the stickies above!
NEVER LOSE SIGHT OF ((( THE BIG PICTURE ))),,,,RUSTY,,,,LUCKY,,,,CABOT,,,,TWILITE,,,,CLIFTON,,,,SHAYLEE,,,,((( ANY ONE HITS IT ))),,,AND BANG I AM A MULTI MILLIONAIRE,,,,,((( THE BIG PICTURE ))))
"The truth shall set you free"
Big Owl, I believe that otcmarkets.com has it wrong under the Company Info section with the Share Structure that you posted. This is why:
Here are the Float numbers in the financials.
Float for period ending May 31, 2010 is: 332,431,815
Float for Period ending Aug 31, 2010 is: 291,048,329
THE FLOAT HAS BEEN REDUCED !
The Number of Shares or Total Amount of the Securities Outstanding for Each
Class of Securities Authorized.
As of the quarter ended August 31, 2010:
Common Stock authorized: 700,000,000
Common Stock outstanding: 641,603,644
Preferred Stock authorized: 30,000,000
Class A Preferred outstanding: 11
Class B Preferred outstanding: 580,000
Public Float: 291,048,329
Number of shareholders of record: 102
The Number of Shares or Total Amount of the Securities Outstanding for Each
Class of Securities Authorized.
As of the quarter ended May 31, 2010:
Common Stock authorized: 700,000,000
Common Stock outstanding 641,603,664
Preferred Stock authorized: 30,000,000
Class A Preferred outstanding: 11
Class B Preferred outstanding: 580,000
Public Float: 332,431,815
Number of shareholders of record: 113
"The truth shall set you free"
Goldman Sachs lifts copper price forecasts .........Kat Exploration Shareholders...It just keeps looking better and better all the time for us!.....On the Luckys were surrounded by Vale with them holding 300+ square kilometers around us! On the Bonivista we're like two Islands of Zambia style Copper sitting in the middle of a sea of Vale. http://i.current.com/images/asset/905/160/63/3liXnK.jpg ....Then if that's not enough to make you smile were drilling any moment on Ken's Mt. / Rusty Rige a IOCG (Copper, Gold, Silver, Rees, Uranieum, and all of these metals prices are going through the roof ((( literally )))
Tag we are it!....... GOLD CLOSES AT RECORD HIGH, TOPS $ 1,350 http://www.marketwatch.com/story/gold-settles-at-fresh-record-high-tops-1350-2010-10-11
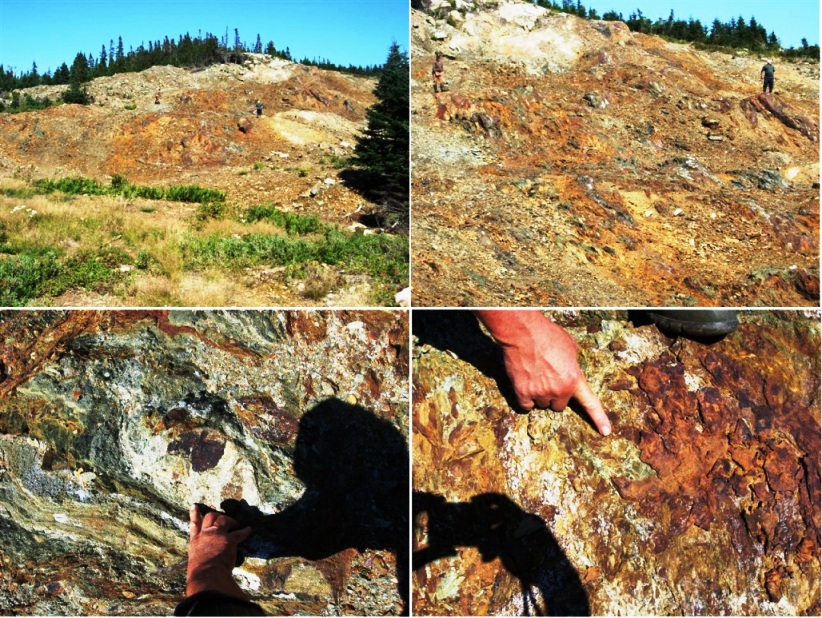
((( BOTH CABOT AND RUSTY, ALONG WITH TWILITE HAVE GOLD ....and here is photo from the stickies of CABOT ** VISABLE GOLD** drill core)))
http://investorshub.advfn.com/uimage/uploads/2010/7/20/jxwhrkatx029.jpg ....
GO TO DRUDGE REPORT ....WORLD WILL BE IN A GOLD RUSH LIKE NEVER SEEN.......I SAW IT COMMIN...I TOLD YA ABOUT IT ....AND ...NOW ...IT IS ...((( HERE ))) ..The perfect place...the perfect time............IF YOU THINK ANOTHER JR MINOR HAS MORE PROMISE ....THINK AGAIN.....GET READY FOR THE RIDE OF YOU LIFE.....THE WORLD RIGHT NOW IS TRYING TO FIGURE OUT WHICH GOLD STOCKS TO BUY.... AND TAG ....WE ARE ***IT***
http://www.drudgereport.com/
"The truth shall set you free"
"When are they going to digg this stuffium up?"" We are starting our second drill program *NOW* Kat will see three Drill programs this year!....Most Jr Pinks would be very lucky to see their first!.....And as Gold investors know.....It's not so much what you dig up ....But what you prove is in the Ground..........Think of the Ground....like a VAULT at Ft. Knox......I hope that helps so you dont get left behind
The truth shall set you free"
Thanks Pope, for breaking down all of these quotes from Dennis V. Woods. Good work.
Here is a page from the report with Dennis Woods "Certificate of qualifications" Thanks PJ, you are a Godsend. :o)
Chloebware, here is a post from geo_newfie that I believe explains the Handcamp drilling plan quite well.
geo_newfie Member Profile geo_newfie Share5 Wednesday, September 01, 2010 2:02:20 PM
Re: tantalos60 post# 93009 Post # of 100754
When you actually start pulling core/rock from the ground is when you know if you are really in a mineralized zone. All drilling programs (should) are dyanmic. They hit the top locations/targets and during the actual drilling they went a little deeper in several holes, thus the overage wrt the footage. So they cut three location in order to get that extra footage. I have been involved in drilling programs where you get to your target depth, but things still look good (i.e., veining, mineralization, etc), so you drill a little deeper to ensure you get to the end of the rocks of interest.
They got the work done they wanted and will probably roll those three other locations into Phase II along with new targets and infill drilling.
From the latest info they released the driller and are in the process of setting up a new contract to cover the upcoming drilling program at RR and maybe even HC.
Many have questioned why they didn't keep drilling while they had the rig on site. Obviously they hit their goals for Phase I and wanted to re-focus on RR. Meanwhile, get the results from Phase I HC drilling to plan the next stage. Keeping a rig onsite without drilling (i.e., standby time) is VERY expensive. So it makes sense to let the rig go and then setup a new contract. Some people have a problem with that, but it makes good business sense.
Ken is juggling two separate programs/companies, with one focused on Au and the other base metals. We can armchair how he is doing it all we want, but he is taking his time. Many juniors just throw a ton of money and drill-drill-drill without a real plan. A friend of mine worked for a junior on a project overseas and the project geologist showed up, pointed at 6 or so locations to drill and left. Meanwhile one of the locations was in the middle of a village, the other through a thrust belt. He was just instructed to drill and spend investors money so that they see that progress was being made!! This is NOT what Ken is doing.
Yet you can see the mentality - investors want the company to DRILL. Many here have the same problem. I see management taking their time to get it right. Unfortunately people are impatient and the PPS suffers on the short term.
I like his plan to increase the value of both KATX and KATG. And stepping back from KATG until it is free trading makes sense too. Why drill more when the PPS cannot benefit? IMO
http://investorshub.advfn.com/boards/read_msg.aspx?message_id=53956933
You forget to Add "Simple Math"....The value of Handcamp....every time!! ... and we're drilling a KATX property (Rusty Ridge) this week!!!...and all during this time over on (Handcamp) BVIG/KATG property.....Heavy Equipment is removing the overburden and marking all drill holes!! You know that hole grid thing?....that is on the website....The truth shall set you free.
You can read the interpretation of Handcamp Phase I results here (scroll down):
http://www.katexploration.com/index.php?option=com_blog&view=comments&pid=14
Handcamp Phase-II drilling grid displayed below:


Images from Biochemist2002 and Rick-UK info in the stickies....thanks
Ken Stead, President CEO, states, "The first phase of exploration, which included induced polarization geophysics, trenching and 1640m of diamond drilling in 12 drill holes, has now been completed on the Hand Camp Property. A second phase starting this fall is in planning and will include additional line cutting, induced polarization geophysics and diamond drilling. With data collected so far and the very encouraging results from this first phase, the company feels that this project warrants a full scale exploration program to determine the true significance of the deposit. With just four areas drilled at such wide intervals within such a large structure and the fact that we intersected gold in all 12 drill holes, we feel there is high potential for further encouraging results within this mineralized structure. Also the number of targets yet remaining to be tested outside this determined structure lends itself to a high degree of optimism that this project will be of great value to the company."
Geochemical analyses and assay data consistently and routinely return anomalous gold, silver, lead, zinc and copper values over considerable widths. As an added bonus the distribution of these elements is uniform in comparison to many gold deposits that are subject to the nugget effect enhancing the potential for the delineation of economic concentrations of polymetallic mineralization.
http://www.marketwire.com/press-release/KAT-Exploration-Inc-Bella-Viaggio-Inc-Handcamp-Drilling-Intersects-Very-Encouraging-1309659.htm
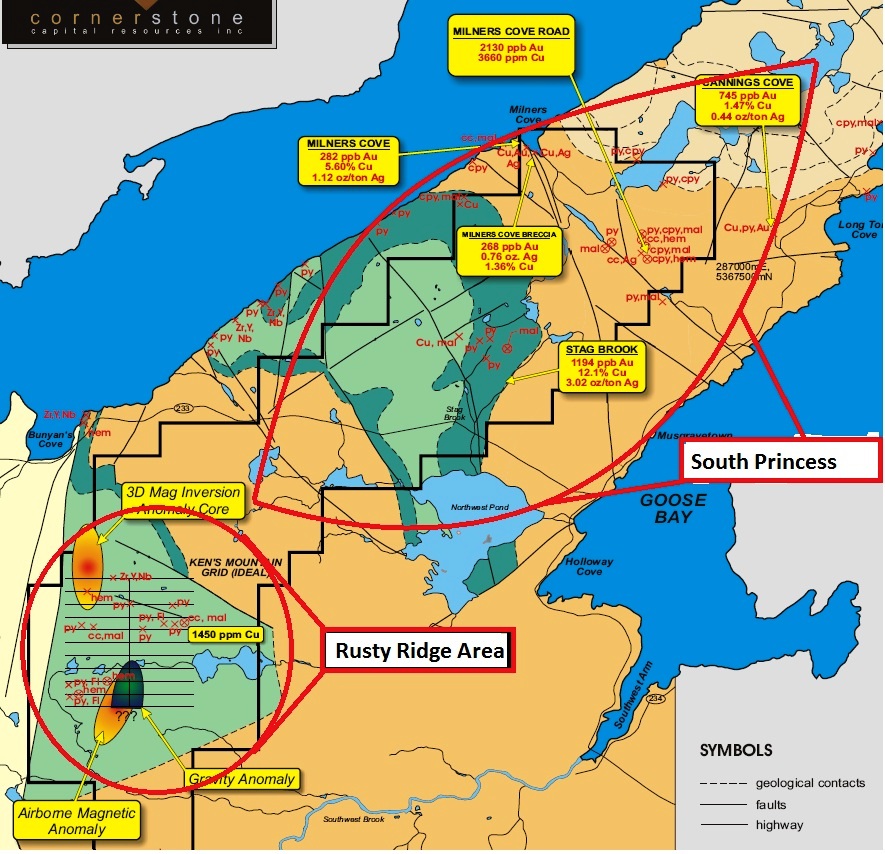
Excerpts from the Ken's Mountain, (Rusty Ridge) Assessment Report
http://gis.geosurv.gov.nl.ca/geofilePDFS/ReceivedBatch19/NFLD_2779.pdf
CONCLUSIONS
The results of the 2001 exploration program were highly successful in identifying coincidental
magnetic, IP/resistivity and soil geochemical anomalies that suggest potential for a body of iron
oxide +/- base, precious and rare earth type mineralization, similar in style and setting to the
giant Olympic Dam deposit in Australia.
Olympic Dam and related deposits all occur within continental rift sequence rocks adjacent to
major structures. The South Princess Property is located within a continental extensional
environment within peralkaline rocks emplaced adjacent to a regional fault system (O’Brien,
1993). The presence of a large magnetic body that appears to be intrusive into the overlying rock
sequences that appear regionally altered, are variably pyritic and contain vein type fluorite
mineralization appears to suggest a magmatic origin for the mineralization.
Recently completed 3D inversion modeling of the airborne magnetic data show a discreet, strong
magnetic anomaly underlying the Ken’s Mountain area. Coincident with this are moderate to
strong IP chargeability anomalies that suggest either, graphite or significant concentrations of
sulphides. Graphite can be for the most part eliminated as the rocks are terrestrial, not marine
meaning that conductive argillaceous rocks would not be expected in this environment.
________________________________________________________________
The magnetic and gradient array IP/resistivity results from Ken’s Mountain are highly anomalous.
Numerous magnetic, resistive and chargeable formations and structures are apparent throughout the
grid area. These features are, in part, coincident with each other, and hence likely associated with
common geologic formations and structures. The anomalous features dominantly trend north-south
in the western portion of the grid, and north-northeast over much of the remainder of the grid, which
implies that there are at least two separate geologic terranes within the grid area. Most of the
anomalous formations are interpreted to be at or near surface, except for a broad linear zone in the
northwest portion of the grid, which may have a deeper source as well as near-surface structures.
The most significant anomalies from an economic standpoint are the very high amplitude (i.e.
greater than 40 msec) chargeability zones that trend across the entire grid between 9200E and
9600E, and along the eastern edge of the grid between lines 8600N and 9000N. These linear,
chargeable bodies are interpreted to be due to significant concentrations of conductive mineralization
(e.g. sulphides or graphite), and possibly even semi-massive to massive mineralization since, in
some cases, they also appear to have lower resistivities than the surrounding formations. The
anomalous chargeable zones are also partially coincident with magnetic anomalies, which supports
an interpretation of sulphide mineralization rather than graphite.
Respectfully submitted,
Dennis V. Woods, Ph.D., P.Eng. Consulting Geophysicist
http://www.discogeo.com/offices.html

http://investorshub.advfn.com/boards/read_msg.aspx?message_id=55310220
Thanks :o)
"Anybody have the link to Dennis V. Woods report on Rusty Ridge?"
Gooddolphin, Stervc just posted here yesterday. :o)
http://investorshub.advfn.com/boards/read_msg.aspx?message_id=55243394
And, it's posted in the stickies above.
Sho-Nuff, here it is. :o)
By: Jack Zwicker On Wednesday, 15 September 2010
http://www.katexploration.com/index.php?option=com_blog
Mappo, I did not write that. They are from a PDF File that has tons of new/old Geo info on the Rusty Ridge Property. Check it out here: gis.geosurv.gov.nl.ca/geofilePDFS/ReceivedBatch19/NFLD_2779.pdf
Dennis V. Woods, Ph.D, P.Eng was the Geologist who signed off on much of the work. http://www.discogeo.com/offices.html The full report can be seen on the sister site at FB.
I like the word MASSIVE too. Rusty Ridge is MASSIVE.

Apparent Chargeability
Unlike the weak chargeability expression over the Holloway Cove grid, the apparent chargeability
response over the Ken’s Mountain grid is highly anomalous. Zones of anomalous apparent
chargeability of greater than 20 msec are observed throughout the grid, in a pattern that is similar to
the apparent resistivity and magnetic maps. In addition, linear chargeability anomalies with
apparent chargeabilities of greater than 40 msec, and in places greater than 50 msec, extend across
the entire grid at about 9200E to 9600E and along the eastern edge of the grid from line 8600N to
9000N. These high chargeabilities must be caused by significant concentrations of disseminated
conductive mineralization, and possibly even semi-massive to massive mineralization.
The broad chargeability high in the west half of the grid appears to be composed of individual,
linear, chargeable structures that extend for several hundred metres to over a kilometre in length in
north-south trends, similar to the character of the magnetic and resistivity anomalies in this area.
The chargeability response appears to more closely correlate to the magnetic response, suggesting a
common genesis for these features and possibly even common mineralization. However, the
correlation is not precisely one-to-one so that the actual causative sources for these anomalies are
probably much more complex. The depth of burial of the anomalous chargeability response cannot
be estimated from gradient array data, however since there is coincidence between magnetic and
chargeable features, and the magnetic structures are interpreted to be at or near surface, the
chargeable bodies are also assumed to be shallow if not right at surface. This interpretation is also
consistent with the high amplitude of the chargeability anomalies.
The correlation between chargeability and resistivity is not as marked as between chargeability and
magnetics. In fact, closer examination of individual chargeability anomalies reveals better
correlation to low resistivity zones within or along side of high resistivity anomalies. This suggests
that the chargeable zones are indeed composed of semi-massive to massive mineralization: at least
sufficient conductive mineralization to cause a reduction in bulk-rock resistivity. Separate causative
sources such as disseminated mineralization within electrolytic conductive shear structures could
also be responsible for this pattern of response.
Apparent Resistivity
The rocks of the Ken’s Mountain grid are generally more resistive than the rocks of the Holloway
Cove grid. Numerous zones and anomalies of greater than 2000 ohm-m are observed throughout
the grid area, and many of the more pronounced anomalies have apparent resistivities of greater than
3000 ohm-m. The most significant resistivity anomaly is observed in the west-central region of the
survey grid with an apparent resistivity greater than 4000 ohm-m. Such high apparent resistivities
are commonly not associated with clastic sedimentary rocks; volcanics and/or intrusives may be a
more plausible explanation. The only conductive sections more typical of clastic sedimentary rocks
are found in the far northeast corner of the grid, in a small isolated zone in the centre of the grid, and
along the western edge of the grid to the west of 9100E-9200E.
The high resistivity formations appear to generally mirror the structural trend of the magnetic
formations: a broad region of anomalously high apparent resistivity in the west and northwest
portion of the grid with north-south alignment of individual resistive structures, and north-northeast
trending resistive bodies over much of the remainder of the grid. Although the coincidence between
resistivity anomalies and magnetic anomalies is not one-to-one, there appears to be sufficient
correlation that a common geological explanation is likely for many of the anomalous zones.
DISCUSSION OF RESULTS – KEN’S MOUNTAIN GRID
Magnetics
The magnetic field over the Ken’s Mountain grid is much more anomalous than the Holloway Cove
grid. High-amplitude anomalies are observed over almost the entire grid area, although they are
most intense and most extensive in the northwest portion of the grid. In this region, the anomalous
magnetic structures appear to be aligned north-south. Over the remainder of the grid, the magnetic
anomalies have a north-northeast trend, indicative perhaps of a separate geologic terrane.
Almost all of the anomalous magnetic features appear to be close to or at surface, as evidenced by
the dominant, spike-like, spatial characteristic of the anomalous response. A few anomalies (e.g.
10050E/9400N and 10600E/9600N) have broader, lower-amplitude profiles, indicating smaller
magnetic bodies at greater depth of burial. The highly anomalous magnetic region in the northwest
portion of the grid is particularly interesting as it displays, not only the sharp, high-amplitude
characteristics of near-surface magnetic structures, but also a much broader, background, anomalous
high: perhaps indicative of a larger magnetic formation at significant depth (i.e. > 200-300 m).
However, this broad background high may also be caused by a broad geologic formation with
disseminated magnetic mineralization. The sharper magnetic anomalies within this zone would then
be related to more concentrated magnetic mineralization, rather than to shallower magnetic bodies........
DISCUSSION OF RESULTS – HOLLOWAY COVE GRID
Magnetics
The magnetic field over the Holloway Cove grid is mostly uniform and non-anomalous except for a
region of moderately anomalous response in the centre of the grid and extending into the northeast
corner. The north-northeast trending anomalous zone appears to be composed of a series of en
echelon magnetic bodies, each of which extends for a few hundred metres north-south at a bearing
of 340° to 360°. (Note that detailed interpretations of trend directions and dimensions are subject to
error because of the 200 m spacing between survey lines). The magnetic structures appear to vary in
depth with the deeper bodies toward the south end of the zone and the shallower bodies in the north,
especially at line 9900N where the magnetic structure is clearly near surface.
Apparent Resistivity
In general, the rocks of the Holloway Cove grid are anomalously conductive. Apparent resistivity
over most of the grid is less than 1000 ohm-m, and much of the region is less than 500 ohm-m.
Such low resistivities are commonly due to clastic sedimentary rocks or overburden.
Within this general area of low resistivity is a 500 m wide zone of anomalously high resistivity,
which extends north-south up the middle of the grid from line 8000N to about the centre of grid
where it appears to separate into narrower dyke-like structures that trend at about 020° and 340° to
the north end of the grid. A cross fault between lines 9400N and 9600N appears to have partially
displaced these trends at the north end of the grid.
The dyke-like form of these high-resistivity structures, even within the 500 m wide zone in the
southern portion of the grid, suggest that the causative source may be intrusive. However the range
of resistivity of up to only 2000-2500 ohm-m is not consistent with intrusive rocks. Although high
resistivities may have been moderated by the effects of surrounding low resistivity material (e.g.
sedimentary rocks or overburden), another possible explanation for these linear, moderate resistivity
zones is weak silicification within fault or shear structures.
There is only general correlation between the anomalous magnetic zone in the central area of the
grid and the anomalous high resistivity zone. Some resistivity structures appear to correlate to
individual magnetic bodies (e.g. the weak anomaly at about 10550E from 9000N to 9600N), but in
general, there is little detailed coincidence between anomalous structures. Indeed, the most
prominent high-resistivity structure that extends from 9800E/8400N to 9600E/9600N trends from a
coincident magnetic anomaly at the south end, into a region of zero magnetic response in the north.
The resistivity structure trending at 020° from 10100E/9000N to 10350E/9900E crosses in and out
of an approximately coincident magnetic zone.
Apparent Chargeability
The apparent chargeability response over the Holloway Cove grid is not particularly anomalous.
The values are slightly elevated over much of the grid, but at the 8 to 10 msec level, they cannot be
considered significant. In addition, there is little discernable pattern to the chargeability response
other than vague north-south trends, which are probably more of a function of the inherent grid
trend bias perpendicular to the survey line direction. Also, there is little correlation between the
apparent chargeability response pattern and the apparent resistivity structures, other than a possible
increase in chargeability along resistivity gradients.
The only chargeability anomaly of any significance is a 200 by 400 m elliptical zone in the
northwest corner of the grid (centred at 9200E/9500N) with peak values of about 12 to 13 msec.
Although not particularly intense, this anomaly does appear to be spatially consistent and even
correlates approximately to a moderate resistivity high of similar dimensions. The amplitude and
form of the anomaly suggests that it is likely due to a zone of weak mineralization or perhaps to
more concentrated mineralization buried at depth within non-chargeable host rock..........
Ken'??s Mountain...IP/Resistivity Survey Coverage 8000N..................................................................
8200N
8400N
8600N
8800N
9000N
9200N
9400N
9600N
9800N
10000N
9000E to 11000E
9000E to 11000E
9000E to 11000E
9000E to 11000E
9000E to 11000E
9000E to 11000E
9000E to 11000E
9000E to 11000E
9000E to 11000E
9000E to 11000E
9000E to 11000E
Total
2000
2000
2000
1500
1800
2000
2000
2000
2000
2000
2000
21.3 km
DATA PROCESSING AND PRESENTATION
Magnetics
The GSM-19 and Omni IV magnetic data were processed by standard procedures. Following
diurnal correction of the GSM-19 total magnetic intensity data using the Omni IV base station data,
the magnetic data were reformatted into standard XYZ data format (i.e. line #, station #, data...) and
then concatenated into survey data files. The data were then plotted as line profiles for visual
inspection and to facilitate the correction of any duplicate readings and any obviously noisy
readings, e.g. single-station spikes of greater than 1000 nT.
The final processed magnetic data are shown as a combined line profile, contour and colour image
plot of the total magnetic intensity at 1:5,000 scale on a topographic base map in Appendix B. The
profile amplitude scales and base levels are indicated on the plots. The total magnetic intensity
colour image is generated by first gridding the corrected data to a regular, even interval. The grid
image is linearly biased in a direction parallel to the dominant geologic strike by defining a
rectangular, 25 x 50 m grid cell size with the long dimension rotated to the average strike direction.
If there are different geologic trends in different parts of the survey area, the rectangular gridding
procedure is carried out in separate zones, each with different trend directions. The final grids are
generated by combining the separate grids and re-gridding everything to a 25 x 25 m cell size. The
grids are is then contoured and coloured using equal-area colour zoning (i.e. equal amounts of red,
yellow, green and blue). Separate magnetic plots are generated for the two separate survey grids.....
DATA PROCESSING AND PRESENTATION
Magnetics
The GSM-19 and Omni IV magnetic data were processed by standard procedures. Following
diurnal correction of the GSM-19 total magnetic intensity data using the Omni IV base station data,
the magnetic data were reformatted into standard XYZ data format (i.e. line #, station #, data...) and
then concatenated into survey data files. The data were then plotted as line profiles for visual
inspection and to facilitate the correction of any duplicate readings and any obviously noisy
readings, e.g. single-station spikes of greater than 1000 nT.
The final processed magnetic data are shown as a combined line profile, contour and colour image
plot of the total magnetic intensity at 1:5,000 scale on a topographic base map in Appendix B. The
profile amplitude scales and base levels are indicated on the plots. The total magnetic intensity
colour image is generated by first gridding the corrected data to a regular, even interval. The grid
image is linearly biased in a direction parallel to the dominant geologic strike by defining a
rectangular, 25 x 50 m grid cell size with the long dimension rotated to the average strike direction.
If there are different geologic trends in different parts of the survey area, the rectangular gridding
procedure is carried out in separate zones, each with different trend directions. The final grids are
generated by combining the separate grids and re-gridding everything to a 25 x 25 m cell size. The
grids are is then contoured and coloured using equal-area colour zoning (i.e. equal amounts of red,
yellow, green and blue). Separate magnetic plots are generated for the two separate survey grids...
IP/Resistivity
The ELREC-6 automatically records the following information with each reading: current electrode
locations, first potential dipole location, six primary voltages in millivolts, six SP voltages in
millivolts, six sets of 10 secondary voltages normalized by the primary voltage in millivolts per volt
(mV/V), six integrated normalized secondary voltages (i.e. chargeabilities) in milliseconds (ms), the
transmitter current keyed in by the operator, the number of stacks, the standard deviation error of the
stacks, and the time of the reading.
Successive primary, secondary and spontaneous potential readings are averaged during the stacking
process. The receiver operator determines the number of stacks based on the quality of the data as
exemplified by the consistency of individual readings and the indicated stacking error. Depending
on the telluric noise and the amplitude of the receiver voltages (which depends on the apparent
resistivity of the ground and the amount of current generated by the transmitter), typical stack counts
are in the range 3 to 23
The 10 normalized secondary voltages are the mean values in 10 user specified, time-delay sample
intervals: #1 - 80 to 100 ms, #2�100 to 120 ms, #3 - 120 to 160 ms, #4 - 160 to 220 ms, #5 - 220 to
320 ms, #6 - 320 to 460 ms, #7 - 460 to 640 ms, #8- 640 to 900 ms, #9 - 900 to 1280 ms, and #10 -
1280 to 1840 ms. The total integrated chargeability is the sum of each normalized secondary voltage
multiplied by the length of its sample interval, and then normalized to one-second integration by
dividing by the total sample interval (i.e. 1.76 sec).
The data from each of six channels are automatically stored with all associated header information
with every reading. The positions of all electrodes for any given dipole at any reading location can
be derived from this header information. The data are concatenated into a single data file as the
survey progresses. Normally new data files are started each day and for each individual line. The
data files are dumped to a portable computer at the end of every survey day.
The first stage of the data processing procedure is to reformat the dump files into standard "XYZ"
data files. Apparent resistivity is calculated from the primary voltage, the current, and the electrode
locations using standard formulation; apparent chargeability is given by the total integrated........
chargeability; and the station locations are defined as the mid-points of the receiver dipoles. The
data from each line are then concatenated into a single data file for the entire grid, and then plotted
as combined line profile, contour and colour image plots on a topographic base map at 1:5,000 scale
in Appendix B. The colour grid images are generated by first gridding the apparent resistivity and
apparent chargeability data to a regular, even interval. The grid image is linearly biased in a
direction parallel to the dominant geologic strike by defining a rectangular, 25 x 50 m grid cell size
with the long dimension rotated to the average strike direction. Separate plots are generated for the
apparent resistivity and apparent chargeability data from both survey grids.
INTERPRETATION PROCEDURES
Magnetics
Areas of anomalous magnetic intensity, displaying both positive and negative anomalies relative to
the ambient field strength, are composed of geologic formations with above average magnetite or
pyrrhotite content (e.g. ultramafics, iron formations, etc.). Strong negative anomalies may be caused
by reversely polarized or rotated magnetic formations with strong remnant magnetization.
Alternatively, large negative anomalies can be associated with positive anomalies due to the dipolar
characteristics of anomalous magnetic fields. Narrow, high-amplitude anomalies are due to
magnetic features very close to surface - broad magnetic anomalies indicate deeper burial or more
uniform magnetization. Areas of lower magnetic intensity than the ambient field, characterized by
broad, low-amplitude, negative total intensity anomalies, could be related to hydrothermal alteration
of magnetite to hematite. Geologic contacts or possible faulting can also be inferred from the
magnetic colour image along pronounced linear gradients and other discontinuities.
IP/Resistivity
Resistivity and chargeability are bulk or whole-rock properties: they depend on physical properties
that are common to the entire rock mass over the sample volume, which is a function of the
resolution limit of the electrode array. Hence, a small zone of highly conductive or chargeable
material may not produce as large an anomalous response as a more subtle variation in the average
concentration of conductive or chargeable minerals in the entire rock mass. However, if the
electrode array is small enough, the smaller anomalous zones will be detectable, but only at shallow
depth since small electrode arrays do not have as great a penetrate depth as large arrays.
Variations in resistivity are due to variations in the content and habit of the major rock-forming
minerals, especially the porosity and permeability of the rock, since resistivity is primarily a
function of the amount and conductivity (a direct function of the amount of dissolved salts) of
interstitial groundwater. Hence, highly porous formations such as overburden, or rock types with
high concentrations of conductive mineralogy such as graphitic argillites tend to have anomalously
low resistivity, whereas massive rock types with little conductive mineral content and low porosity
(e.g. granitic intrusives), have anomalously high resistivity. Alteration has a pronounced effect on
resistivity: clay alteration tends to reduce overall resistivity while quartz replacement will increase
resistivity in confined regions.
Chargeability is a function of the minor constituents of the rock mass: e.g. sulphide mineralization,
graphite content, and to a lesser extent, magnetite and other oxides, and clay mineralogy. The habit
of these minerals is critically important to the amplitude of the chargeability response. Since
chargeability is a surface area phenomenon, smaller grain size and more anhedral texture (e.g. finely
disseminated, clastic sedimentary graphite or pyrite) will produce greater chargeability than coarsegrained
mineralogy such as primary or secondary sulphides in volcanics or intrusives.........
.Ken’s Mountain/IP/Resistivity.......
WHAT DID YOU WANT TO KNOW ....AND WHEN DID YOU WANNA KNOW IT!
(((EVERYTHING)))...AND.... (((NOW !)))
......""gradient array IP/resistivity survey was carried out using a 6 channel, Iris ELREC-6
time-domain IP receiver and a Huntec M-4 2.5 kW transmitter powered by a 6.5 Hp motor
generator. Cornerstone personnel pre-selected a 50 m dipole length and reading interval for the
gradient array survey. This array allows rapid data acquisition, but limits the resolution........ 8000N
8200N
8400N
8600N
8800N
9000N
9200N
9400N
9600N
9800N
10000N
9000E to 11000E
9000E to 11000E
9000E to 11000E
9000E to 11000E
9000E to 11000E
9000E to 11000E
9000E to 11000E
9000E to 11000E
9000E to 11000E
9000E to 11000E
9000E to 11000E
Total
2000
2000
2000
1675
1850
2000
2000
2000
2000
2000
2000
21.5 km
IP/Resistivity
The gradient array IP/resistivity survey was carried out using a 6 channel, Iris ELREC-6
time-domain IP receiver and a Huntec M-4 2.5 kW transmitter powered by a 6.5 Hp motor
generator. Cornerstone personnel pre-selected a 50 m dipole length and reading interval for the
gradient array survey. This array allows rapid data acquisition, but limits the resolution of the
survey results to the 50 m dipole spacing, since it is impossible to distinguish between small
anomalous zones that are close together than the dipole length. Hence, a small anomalous zone of
mineralization several metres across would appear to be 50 metres wide, or two narrow zones of
sulphide mineralization less than 50 metres apart would appear to be a single anomalous zone.
Larger dipole spacing is used in gradient array IP/resistivity to facilitate fast, cost-effective,
reconnaissance surveying to identify areas of interest for more detailed follow up surveying.
On the Holloway Cove grid, a total of 18.3 km of surveying was carried out in 5 days for an average
production rate of more than 3.6 km per day. This included a travel day and a day to lay out and
pick up the current wires. A single transmitter current bipole (two electrodes separated by great
distance) was set up to survey the entire grid. The current bipole straddled the entire grid and was
aligned east-west across the centre of the grid. The eastern current electrode was located at about
9000N/11400E and the western current was located at about 9000N/8050E. The eastern current
electrode was set up next to the ocean, as far east as possible but still approximately along the
east-west centre line of the survey grid.........
Each current electrode set-up consisted of a group of stainless steel stakes, driven about a meter into
wet soil in a 5 metre circular configuration. Current electrodes were connected to the transmitter
with 16 gauge wire suspended in tree branches, above the ground where possible, and clearly
labelled with warning signs to identify the hazard to any passers-by. Prior to commencement of the
survey, Discovery personnel spent several hours informing locals in the immediate area that an
electrical survey was ongoing and the dangers of handling the current wire. The transmitter was
placed at a convenient location between the bipole electrodes and was operated on an 8-second
period and a 50% duty cycle: i.e. 2 s on (+'ve), 2 s off, 2 s on (-'ve), 2 s off, etc. Transmitter current
was stable at 2.4 Amps. The survey was interrupted on the second day due to a broken current wire
caused by a moose catching the wire while crossing under it.
On the Ken’s Mountain grid, a total of 21.3 km of surveying was carried out in 6 days for an
average production rate of about 3.6 km per day. This included a travel day and 1.5 days to set-up
and pick-up the electrodes and current wires of four separate current bipoles used to carry out the
survey. The grid was divided into four overlapping blocks and four separate transmitter bipoles
were established straddling each block. The first set up was positioned to survey the eastern side of
lines 9000N to 10000N inclusive using current electrodes located at 9500N/11600E and 9500N/
9200E. The second set up was positioned to survey the western side of lines 9000N to 10000N
inclusive with electrodes at 9500N/10800E and 9500N/8400E. The third set up was used to survey
the eastern side of lines 8000N to 9000N inclusive with electrodes at 8400N/11600E and 8400N/
9200E. The fourth set up was positioned to survey the western side of lines 8000N to 9000N
inclusive with current electrodes located at 8400N/10800E and at 8400N/8400E.
Each current electrode set-up consisted of a group of stainless steel stakes, driven about a meter into
wet soil in a 5 metre circular configuration. Each current bipole was connected in turn to the
transmitter, which was placed at a convenient location near the centre of the grid, with 16 gauge
wire suspended in tree branches, above the ground where possible and clearly labelled with warning
signs to identify the hazard to any passers-by. The transmitter operated on an 8-second period and a
50% duty cycle: i.e. 2 s on (+'ve), 2 s off, 2 s on (-'ve), 2 s off, etc. Transmitter currents varied from
2.4 Amps to 1.7 Amps depending on the soil conditions at each of the four separate set ups.
For both surveys, the receiver was placed in the middle of a spread of five 50 m spaced, stainless steel,
potential electrodes and individual 16 gauge wires were run from each electrode to the
receiver. The receiver spread was moved along the survey lines in 200 m steps, reading potential
and chargeability values over the four contiguous 50 metre dipoles at each set-up. Non-polarising
porous pots, filled with a saturated solution of copper sulphate were compared against the stainless
steel electrodes on the first day of surveying. There was no notable difference in secondary voltages
and as a result a decision was made to use stainless steel electrodes for the duration of the survey.
Although the receiver is capable of recording six dipoles concurrently, only four dipoles were used
for logistical reasons.
The receiver simultaneously records the primary, secondary and SP voltages from the four potential
dipoles. The integrated chargeability is measured in 10 time windows from an initial delay of 80
milliseconds (ms) out to 1840 ms. Chargeability values are normalized for primary voltage and for
integration window width. For each receiver dipole, a value of apparent resistivity (in Ohm-m) and
apparent chargeability (in msec) was calculated. Duplicate readings at overlapping stations and on
overlapping lines between separate survey blocks on the Ken’s Mountain grid were averaged or in
some cases dropped in the final data compendium.
Details of the survey coverage are listed in Table 2 and survey line locations are shown in Figure 2b.
TABLE 2: IP/Resistivity Survey Coverage
Grid
Holloway Cove
Line
8000N
8200N
8400N
8600N
8800N
9000N
9200N
9400N
9600N
9800N
9900N
Stations
9000E to 10500E
9000E to 10300E
9000E to 10400E
9000E to 10500E
9000E to 10800E
9000E to 10800E
9000E to 10800E
9000E to 10800E
9000E to 10800E
9000E to 10800E
9000E to 10800E
Total
Total (e)
1500
1300
1400
1500
1800
1800
1800
1800
1800
1800
1800
18.3 km
I AINT EVEN STARTED YET ....I AM JUST GETTIN WARMED UP!.........IT WILL TAKE A WEEK JUST TO LAY OUT THE DATA AND WORK KEN HAS DONE...ANYONE THINKING THIS RR IS JUST SOME OLE """PASS AROUND PROPERTY"" JUST BECAUSE OTHERS PAINTED IT THAT WAY WITH A FAST TALKIN BRUSH AND TOOK THE ....EXIT TO THE LEFT.....WELL.....ALL I GOTTA SAY....IS WHAT FRANK SINATRA SAID BEST...."REGRETS.....I GOTTA FEW"....BUT YOURS WONT BE ....."TOO FEW TO MENTION"........HOLD ON TIGHT .....WERE GOING FOR THE REAL (((( BRASS RING BABY ))) or your welcome to the exit door...hell I will even open it for ya ....I got some extra cash to get a few more!............................................................................................
SURVEY PROCEDURES
Magnetics
The magnetic survey was carried out using three GEM Systems GSM-19 Overhauser magnetometers.
The GSM-19 is a portable, high sensitivity Overhauser effect* magnetometer/gradiometer
designed for handheld or base station use for geophysical exploration. Optionally, the addition of a
VLF sensor is available for a combined magnetometer/gradiometer–VLF measurement system. The
GSM-19 is a microprocessor-based instrument with large memory storage capabilities (up to 2
Mbytes) and has an absolute accuracy over its full temperature range of 0.2 nT. Synchronized
operation between hand held and base station units allows corrections for diurnal variations of
*Overhauser Effect. In contrast to a standard proton magnetometer sensor, where only a proton
rich liquid is required to produce a precession signal, the Overhauser effect sensor must also have
a free radical added to the liquid. This free radical ensures the presence of free, unbound electrons
that couple with protons, producing a two-spin system. A strong RF magnetic field is used to disturb
the electron-proton coupling. By saturation free electron resonance lines, the polarization of
protons in the sensor liquid is greatly increased. The Overhauser effect offers a more powerful
method of proton polarization than standard DC polarization, i.e. stronger signals are archived
from smaller sensors, and with less power.

