News
News  Market Data
  Discover
Support: 888-992-3836
Copyright © 2023 InvestorsHub Inc.


| Followers | 1651 |
| Posts | 18,274 |
| Boards Moderated | 1 |
| Alias Born | 11/10/2004 |
| Twitter Profile: | Temporarily Unavailable |
| Follow on Twitter: | Follow @ Temporarily Unavailable |
lowtrade
![]()
Register for free to join our community of investors and share your ideas. You will also get access to streaming quotes, interactive charts, trades, portfolio, live options flow and more tools.
Register for free to join our community of investors and share your ideas. You will also get access to streaming quotes, interactive charts, trades, portfolio, live options flow and more tools.
Again thanks. I had Flowers on weekly watch, but since I was playing FAS/FAZ and not planning on swing trading for a while. I didn't check back on any watch stocks. Actually that was a stupid error I know better. I planned to watching them and didn't follow the plan.
Your heads up was great, I would have missed it.. Don't mind missing a trade, but do mind missing a plan. I'm rechecking all my watch stock now. LOL Dumb ass on my part. Should have had a standing order waiting for yesterday.
I have some concern about SIAF's volume. I just posted I decided to place it on strong watch again. For a possible 4th trade.
This post is to say caution. Event if it does break .925 top resistance, it may not continue. Don't get caught, raise your entry higher, as volume interest if falling. And after large never ending runs, TIP; you really want continued volume interest, with continued price.
Maybe I should have just kept my mouth shut and been happy with the 3rd time charm. Because this one might bite you on the ass. If playing be fast on the gain trigger, IMO. If volume comes, never mind. Play at your own risk.
http://stockcharts.com/h-sc/ui?s=SIAF&p=D&yr=0&mn=3&dy=0&id=p27189857479
COSI may have put in it's flag retrace bottom today. Keep an eye on it for 3rd flag up break at 2.50 top resistance, again.
link back
I think the market retrace is about over. New swing trades should start soon. This may be one of them.

Thanks for the 9% so far. Liked what I saw and bought the open. Flag target $8.50.
This one's chart was like the NEW TIP I'm looking for, the week 2 high tight flag break. NPTN is in week 3 and ENCR week 2. This one broke week 3. It's a project in the works.
Got 1% at FAS/FAZ today. in/out/in/out LOL on the "V" bottom. Thinking this S&P 3 to 4% retrace is about over. The gap could still fill for 4%, but I think the reversal mid day signaled 3% will be it.
Looking for high and tight flags. To work on stats for new TIP.
Not so far.
Just meant I was done posting about it.
I hate emotion. Not my cup of tea.
Done with that one, have a few posts about it if you use
board search, MHYS. I'm out without plans on looking back. Banked 60% and happy.
WOW an old timer. What was your handle back in 2001 to 2008. I might remember you. Monkish was a student of mine, before he turned darkside and changed his handle to just MONK. I heard he went crazy the year I stopped trading and was gone from IHUB, at the crash. But if he got you, I wouldn't tell everyone. Implies a follower more then individual trader.
Wow haven't looked at OTCBB website for some time and found something interesting. As the SEC was FORCED to finally tighten up regulations on the OTC. The industry dwindled.
2006 back in the naked shorting and NEVER cover heydays. There were 222 M&Ms. Now after 2 rounds of tightening up on naked shorting, there are only 50 M&Ms. In the most every naked short position is covered in the REG SHO 13days, era.
http://www.otcbb.com/dynamic/tradingdata/marketmakerspositions/mmakersdata.htm
After the lack of 10x plays, in the "Now days @ the OTC" era. I'd expect to see it go smaller yet.
Could be a broker/dealer working with them. But didn't find them on the market maker list.
http://www.otcbb.com/asp/tradeact_mv.asp?Issue=fbec&searchby=issue&sortby=volume&Month=8-1-2014&downloadname=mv201408.exe&view.x=29&view.y=12
Mid term elections coming. VOTE
Kick our non functioning government out. please. LOL
I watch the daily show and much of the time what's politically presented is sooo stupid scary, I want to cry instead of laugh.
Incumbents: Fire them all!! VOTE
I have no idea how these guys get around things like that. I saw that, but some how the dilution was issued. Not in 4.99% of OS pieces. Since the OS more then doubled from 225 mil to 579 mil. March 31st to now, it's out the door and in their hands.
Also I've seen those 5% restriction many times before and with days later a ownership filings, showing 15% ownership.
FBEC TA chart
Support indicators StochRSI & CMF are positive.
That's it I'm going to let loose of this sewer rat. Play at your own risk ! I happen to like it.
Entry/exit indicators;

FBEC
For got to speculate on what happens when trench issuances are involved.
You usually see the last trench .0003 sold up to the first trench .0015 price level. Then that one sold. This means it could be a triple zero 10x play.
Could be !
More dark thoughts from under my tin foil hat on FBEC.
Was thinking about the share structure changes there and how with the last 2 day volumes were so large. Could the darkside be dumping already?
We're looking at 350 mil for sale. The first court ordered issuance was June 6th and if the company issued after in the .0015/.002 area. They would not be selling that now !!! The second court ordered issuance was Sept 12th. As I was just told (can't confirm and have no idea where the posted got that number, but makes sense, I was waiting for an announcement on the second court ordered compliance) the OS went from 384 mil to 579 mil. The cash owed was $57k, on the second court order. Math says the new dilution was issued at .0003 for 195 mil = $57k. And it took place 2 weeks after the order. This timing will come into the picture later.
Now we have 2 trenches of share issuances, 158 mil Q2 and 195 mil Q3 dilution or 350 mil for sale. Some at .0003 and some at .0015 say.
And we have 584 mil traded the last 2 days at FBEC, while price hasn't broken 1st resistance. So what the hell is happening? The darkside dumping under .0007 just doesn't make sense. Barely getting a double on the last dilution. Where is the volume coming from. LOL Naked shorting.
Next subject, Dark masters often have a fav M&M and since this IBC Fund outfit sues for shares, they probably have a M&M they use all the time. When an M&M is going to run a fleecing, they have no problem with naked shorting to aid with pre run accumulation.
I say in an accumulation move 25% of the volume is retail and 75% the darkside. 584 mil - 25% = 438 mil. So I'll add that to the 350 mil and go out on a limb and expect there is actually 788 million shares for sale soon.
A lot of this speculation is based on an M&M in the darkside pocket, helping by causing the volume to be accumulation, not dumping the original 350 mil.
If you look at the chart below and remember the first dilution was ordered June 6th, look what happened to the price right after. June 12th there was a large gap down open. What do I say about LARGE gap downs on the OTC. They can't happen with out M&M help. Sept 12th second court order and the price was in the .0006 area with low steady volume. 2 weeks later the volumes popped and price fell to .0003 issuance level.
I'm thinking these 2 price pull downs right after the company was ordered to issues shares to IBC Fund's Were M&M HELPED price pull downs, so their client would get as many shares as possible, before the company had the chance to issue the stock.
Kind of helps confirm an M&M is working with the darkside and that helps confirm the resent volume is dark accumulation.
Boy I can get way out there, when I have my tin foil hat protecting my brain from evil.
110% speculation FBEC has 788 million shares for sale as of today.
We'll see !

Never thought about the island reversal being bullish or bearish. Because when it happens it's so bad. But I guess it is bullish as most of the time it channels and eventually has a come back. Haven't seen to many break south out of the channel. But time is money and they often last 6 months.
yep
Keep an eye on FBEC for the get even 2g.

Life is like a box of chocolates. Never know what you'll get. Damn wish I saw yesterdays fall. Could have given the recommendation to implement the get even plan and sell half at 2.70.
Good luck, but the chart now has become an island reversal pattern. Plenty of posts here about those. Try board search on that. Volume in / volume out, months waiting. Trade the bottom channel while waiting.
FBEC
Guess they issued the last court settlement $57k worth or 195 mil shares to IBC Funds, LLC. Because Sept 2nd OS was 384 mil. And that level was reached on a prior court case on $101k, between the company & IBC Funds, LLC. Which took the OS from 225 Q2 to 384 mil Q3.
Doing the math, then IBC Funds, LLC holds 350 mil +/- for sale. Over twice what the OS was March 31st @ 225 mil.
IBC Funds are not an actual VC firm. They buy up vendor debt owed by companies and take startups to court for shares. Then they sell to the retail herd for profits.
I entered FBEC small, yesterday on the pop to 1st resistance .0007, plan going larger if .0008 next is hit.
Pulled in 60% +/- with my small and larger positions combined on MHYS at open. My .0012 sell order stopped out quick. Hope you took profits also.
I know I said I was not going back to SIAF for the 4th time, but had to check and see what was up. Like what I see.
SIAF back on strong watch.
FAS/FAZ at the big board hasn't been doing very well this week. Broke even + .25% Monday, & only +.5% Tues, But +3% so far today.
Also keeping an eye on NPTN. Was expecting a climb start last week (week 2) on my new high and tight TIP. This is week 3 hum. Almost broke out but no cigar.
http://stockcharts.com/h-sc/ui?s=NPTN&p=D&yr=0&mn=3&dy=0&id=p27195789827
I don't like the pincher play. Because it's been my experience it doesn't work well. Many count on it giving a new move indication when tight. I've seen it fail to often, so I don't use it or teach it.
What you do is put the ADX and PPO TA indicators together and when the two lines get close, there is suppose to be a move start. This is just like the BBands getting tight. But IMO the BBands are more reliable. So I watch the BBands.
Geese I hope riskychick implemented the get even plan on yesterdays break from the basing area. I should have been watching FNMA. Selling half @ 2.70 target will work after the last 2 days there.
So to answer your question.
Quote:
how am i supposed to know if the candle for that day will be a high exhaustion peak and then close red?
The answer is you can't, but you can react after you see it. Basic, simple and clean !
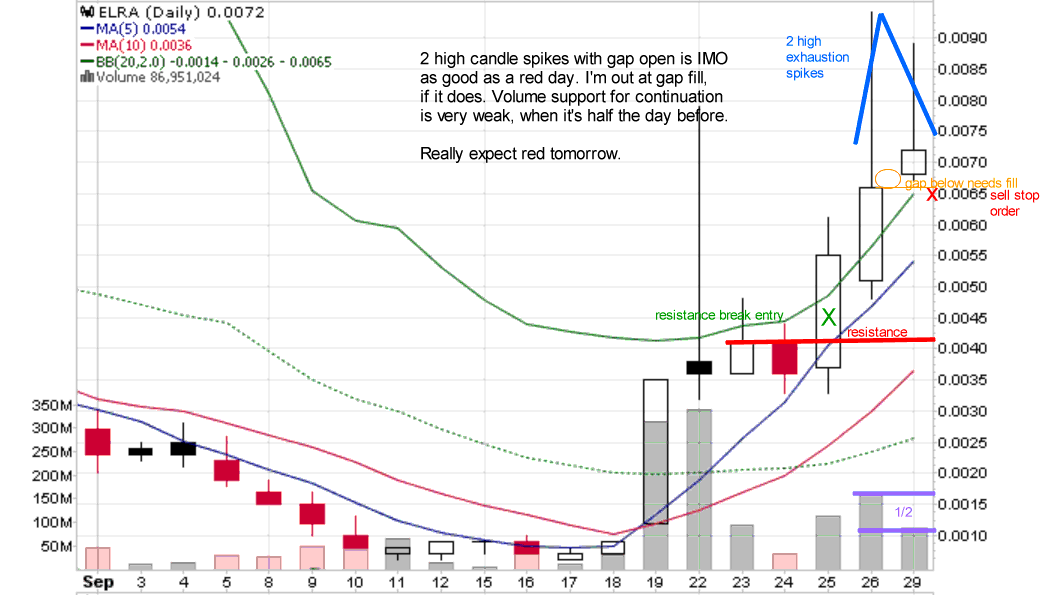
Closed ELRA for 55%, there's the expected red day.
http://stockcharts.com/h-sc/ui?s=ELRA&p=D&yr=0&mn=3&dy=0&id=p59036734261
New standing .30 buy closed at ENCR, another big price pull down end of day. .30 to .25 in last half hour. 2 days in a row. Yes this one is going to be interesting. Can't nail down what the EOD pull downs are all about. Event with my tin foil hat on. LOL
http://stockcharts.com/h-sc/ui?s=ENCR&p=D&yr=0&mn=3&dy=0&id=p18175218608
Expect exiting MHYS in rush hour tomorrow. On the high exhaustion candle spike.
http://stockcharts.com/h-sc/ui?s=MHYS&p=D&yr=0&mn=3&dy=0&id=p67196288571
Just re-read you post and thought I should cover some statements and weak areas in your development.
my question to you is how am i supposed to know if the candle for that day will be a high exhaustion peak and then close red?
how am i supposed to know if the candle for that day will be a high exhaustion peak and then close red?
Just wondering why do you explain this to people for free?
Lets put NBRI back on strong watch. Remember that one? Well it's been diluting and the walk down bottom is getting hit a little to large for the volume accumulation to be bottom fishers alone.
From under my tin foil hat; I think it's VCs and friends accumulation before the new 10% of the OS dilution gets sold.
Play this as a single bottom bounce play. IMO

Ps; MHYS
Expect exit signal at MHYS tomorrow. Watch for red day after todays high candle spike. The rush hour run was not feed! Have no idea why the dark master let it just channel, selling lower. Guess their happy with the 2 day, double/triple, like "Now days @ the OTC" Strange, but at any rate, if tomorrow doesn't continue, I'm taking profits.

Bottom rectangle channel.
BTCS
Ascending triangle
God NO. If you stick around and study some of old posts, you'll learn why. This will take time and hard work. But you just presented a chart which kills all playing the OTC. To many things wrong with it to explain in 1 post. But IMO stop looking at those type of charts. .0002 and .0001 charts are only for the rich bottom fishers which can plop cash down and wait for months if needed.
Yea I know. You are having trouble with emotion still. That's why I keep slapping your face to try to get you to stop the emotion chit. Could have just let these little statements go. But I want to help, not criticize. Hope you understand. because you can expect more bitch slaps in the future. Till you settle down some. LOL
All should read this post, to help understand what technical analysis is all about. This answer ended up going beyond your question.
--------------------------------------------
I did answer that but, yes, candle bodies closes gaps, not wicks. This subject, as with all charting, can't be considered correct or wrong though. As there is no one single god dictating black & white rules.
My interpretation is from experience of watch gaps for 10 years. Because I've seen to many gaps which have wick fills, still be re-visited with candle bodies later. And this happened more the 50% of the time, so I teach and personally require candle body fills to satisfy a close.
The thought process and theory is based on emotion causes gaps in price, emotion can satisfy them. You need the masses to say the gap was uncalled for. Not just another emotion surge.
At any rate, using candle bodies actually is safer, but I wouldn't argue the subject, with any other technical analyst. I'd just do things my way, because of my experience. Others can do things there way. All charting is not black and white. Neither is this. It's an art form, seen in the eye of the chartist/artist.
Every Rule of Thumb, TIP and non book chart pattern, I post about is seen in my mind, using my experience. Adding to what I've learned from standard practices. And backed up by repetitive observations. It's some one noticing repetition in chart, which caused the first chart pattern to be taught. I just add to the excepted standards found in books, with my personal experiences. IMO every good analyst should try to improve their knowledge. And continue past what they learn in books, using experience. I happen to pass it on. But I'm sure every technical analyst uses their own special observations.
The more you see something happen, the more you can rely on it ! Is basically "charting" or analysis and how I teach one to always look for new things, to aid with decision making.
Charting and technical indicators together become technical analysis. Charting is a art from, finding patterns in price movement and indicators are mathematical calculations explaining charting patterns. Together they aid with entry or exit decisions, based on historical price movement, by projecting future price action.
Some analyst see shares of gray. I try to see 256 colors, by reading the sentiment and phycology behind the gray.
Been working tonight and the last thing I did was to re-look at ENCR, because of the wash trading volume, I saw end of day.
Guess what I noticed. My TIP theory worked at this stock once already +/-. Didn't notice that before. It popped just at the end of week 2 start of week 3.
The more you see something happen, the more you can rely on it !
Good night
This one is a working TIP. Haven't seen the theory work enough to completely trust it yet. But it has worked several times so far.
Theory;
When a run holds at or above FIBs 50% a week, second week produces new run.
The theory is based on phycology will follow sentiment after 1 week. So if a run hasn't broken down after the first week, investors will generate a new positive feeling of safely and start moving in again. Remember traders sentiment got the price pop. Investors invest in the up trend phycology.

crappy management usually protects themselves with billions in preferred shares
Thanks for that explanation. Makes more sense now. You made an informed long term commitment. Can't say thinking big boards is silly, if that's where you expected to end up eventually. I hope eSports produces the needed revenue for continue growth. Because stagnation causes weathering on the vine in many successful start ups. Actually becomes the #2 reason for failure. Sitting on the pot, too long. Poor management is #1. you solved that.
Again wish you and your fellow long term investors success.
fundamental business model based on revenue expansion
ELRA eval 1st 10x I've seen in some time.
Love your comment in ELRA post history;
I gamble in the sewers.