 News
News  Market Data
  Discover

Support: 888-992-3836
Copyright © 2023 InvestorsHub Inc.


C C
![]()
Register for free to join our community of investors and share your ideas. You will also get access to streaming quotes, interactive charts, trades, portfolio, live options flow and more tools.
Register for free to join our community of investors and share your ideas. You will also get access to streaming quotes, interactive charts, trades, portfolio, live options flow and more tools.
think we could get past the latest highs
chart appears to be bassing.....hope so....I'm all in
3.10 is the high to over come....and....we could be off to the races
like to see back up to 3.50 would be nice move from here
sorry over looked ur post
cc
nice find
bought ng last night just before the close
appeared ready to run.....and....it ran according to plan....great when things go according to plan
ng up nicely this morning
cc
according to NOAA...the chart below ...20017 is close to the 2005-2006 winter
it appears we could have extreme cold/warm weather this year....from one extreme to the other end of heat and cold
Alaska ranked 33rd warmest since 1918: the coolest annual period since 1999
......be prepared.....with these extreme moves in temp we could see ng usage increase this year....shall see if I'm right

The temperature for the 2005-2006 winter season (Dec-Feb) was the 11th warmest such period on record (1896-2006), with much warmer than average temperatures in parts of the central and northern Plains, Great Lakes, parts of the Northeast and across California. This was due in part to a record warm January for the U.S. Thirteen states in the central and northern Plains and Great Lakes ranked record warmest during this period.
The year was the record warmest year-to-date period through September. During September and October, temperatures were unseasonably cold across a large portion of the country. November temperatures rebounded and were 18th warmest on record. The resulting 2006 fall season (September-November) ranked 39th warmest on record, or just above the 20th century mean. Even with the November warmth, below average temperatures remained across much of the central Plains, Ohio Valley and the Southeast.
Annual temperatures for 2006 averaged across the state of Alaska ranked 33rd warmest since 1918: the coolest annual period since 1999
https://www.ncdc.noaa.gov/sotc/national/200613
cc
topped out at 3.087
Wend....topped out at 3.095
could it go on up from here
or
keep going downward
time will tell.....?????
warm weather coming.....?????
https://digital.weather.gov/
http://www.cpc.ncep.noaa.gov/products/predictions/long_range/two_class.php
cc
u missed the whole point of the post.....going on into 2019
As solar activity continues to decline from these low peaks toward a minimum in early 2019, we expect temperatures in much of the nation to be much colder than last winter, but still above normal.
we will still have our heat waves this summer that u can proliferate about
http://www.dictionary.com/browse/proliferate
# 2
have a nice day
cc
right......the point of that post was comparing the solar cycles with future warm vs cold weather going on into 2019
seems the further the flares go out into space the warmer the weather can be
from what I can gather
look at the chart I posted.....it shows solar activity vs warm/cold weather activity
As solar activity continues to decline from these low peaks toward a minimum in early 2019, we expect temperatures in much of the nation to be much colder than last winter, but still above normal.
cc
know what u mean
14.30
cc
could be something to the solar flares.....off the sun
cc
yah u been killing it
got me some UGAZ @ 3.30 just before closing
wish had more time to trade
I posted an incorrect post about the winter of 2016 and 2017 and dude fell for it
what a sap......lol
cc
possible to hit 5
do we bounce from here
or
back to 2.50 and bounce
where is the catalyst
cc
I tend to think the article about solar activity could be more correct than the other one
makes more sense
cc
From what can gather from their post solar activity is up we have warmer weather..
..solar activity is down we have cooler weather
Appears solar activity will be down bringing on cooler weather but not much cooler than last winter
Shall see...Dont believe they will know for sure till we get tru summer time
cc
2017 Winter Outlook
which one do we believe..... 2 differant versions
Turns out, the outlook is on the positive side with favor falling on the northeast. The forecast says New England and New York will have an “ice cold and snow-filled” ski season. Meanwhile, the Rocky Mountain region and Pacific northwest are looking towards average to colder-than-average winters with average to above-average snowfall totals.

http://unofficialnetworks.com/2016/08/farmers-almanac-2016-2017-winter-weather-prediction-forecast
cc
Almanac U S WINTER WEATHER FORECAST 2016–2017

OVERALL WINTER WEATHER FORECAST 2016–2017
Solar Cycle 24, the smallest in more than 100 years, is well into its declining phase after reaching double peaks in late 2011 and early 2014. As solar activity continues to decline from these low peaks toward a minimum in early 2019, we expect temperatures in much of the nation to be much colder than last winter, but still above normal.
Graph: NOAA/Space Weather Prediction Center
The winter of 2016–17 will feature above-normal snowfall in the northernmost states, along the spine of the Appalachians, and in northern Illinois, but below-normal snowfall in other areas.
With last winter’s strong El Niño being replaced by a moderate La Niña this winter, cold air masses will be able to build in Canada and move southward into the United States. Other important factors in the coming weather patterns include the Atlantic Multidecadal Oscillation (AMO) in a continued warm phase, the North Atlantic Oscillation (NAO) in a cold phase, and the Pacific Decadal Oscillation (PDO) in the early stages of its warm cycle. Oscillations are linked ocean–atmosphere patterns that influence the weather over periods of weeks to years.
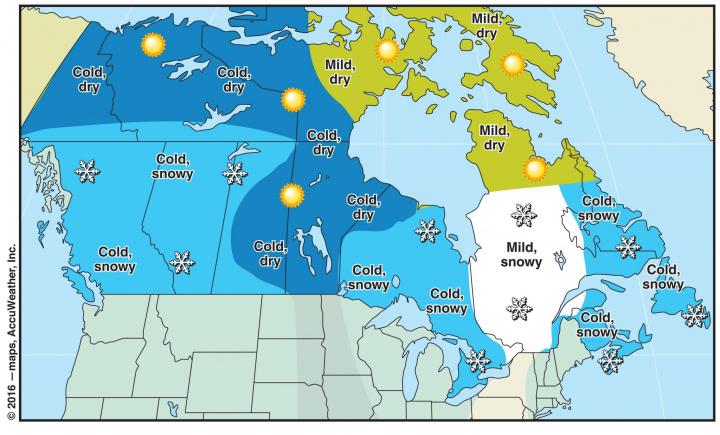
CANADA WINTER WEATHER FORECAST 2016–2017
Most of Canada (see map below) will have below-normal temperatures this winter, although Quebec and eastern Nunavut will have above-normal temperatures.
http://www.almanac.com/extra/winter-weather-forecast-2016-2017
cc
Open internet is declining...
could mean direction of NG is changing direction
cc
first alerted on Thursday to MY @ 22.55
now 24.35
cc
DSLV moved .40 this morning
cc
looking at the chart....how many long tails do u see
ng keeps trying to drop and some one trys to prop it up
is it big money....or....they playing with you
shots covering caused the run from what I heard
why would it run from here.....what catalyst will cause the next run....other than technical
how long can they keep this up is question u need to ask yourself
do we need more consolidation before the next move
do we need more support before next move
I'm just a guy on the side lines saying why
shall see
cc
DSLV trying for lift off
cc
GOLD.....who trades what
https://www.bullionstar.com/blogs/gold-market-charts/gold-market-charts-april-2017/
cc
GOLD.....who trades what....who owns what
https://www.bullionstar.com/blogs/gold-market-charts/gold-market-charts-april-2017/
cc
Nuclear Power plants closing.....demand flat for last decade
nat gas is cheaper in long term
nat gas 1/3
coal 1/3
building more wind & solar
cc
should have taken my own advice.....DSLV moved over 1.25 today
cc
that was some nice trading there my friend
not able to pm you right now
except on fridays when they have free subscriptions
cc
thanks 4 all the posts.....pm's
I have dropped my subscription with I-hub
may get it back latter.....don't have lots of time
DSLV appears like may be trying to lift off
TES may be trying
10.20 needs to hold....shall see
cc
would not be surprised if runs to 3.03 area and drops back down
to 2.95 area and tries to get better floor
not much volume pushing ng right now
who really knows 4 sure
don't like chart set up right now....makes me think want to revisit lows from yesterday
shall see
cc
Oil prices fell nearly 1 percent on Monday on concerns that the cutting of ties with Qatar by top crude exporter Saudi Arabia and other Arab states could hamper a global deal to reduce oil production.
Saudi Arabia, the United Arab Emirates, Egypt and Bahrain closed transport links with top liquefied natural gas (LNG) and condensate shipper Qatar, accusing it of supporting extremism and undermining regional stability.
The news initially pushed Brent crude prices up as much as 1.6 percent as geopolitical fears rippled through the market. But August Brent prices ended the session 48 cents or 0.96 percent lower at $49.47 a barrel.
U.S. West Texas Intermediate futures settled 26 cents or 0.55 percent lower at $47.40. U.S. gasoline futures led the energy complex lower, falling about 2.5 percent to settle at $1.5381 a gallon, on technical selling, brokers said.
With production capacity of about 600,000 barrels per day (bpd), Qatar's crude output ranks as one of the smallest among the Organization of the Petroleum Exporting Countries, but tension within the cartel could weaken the supply deal aimed at supporting prices.
cc
Keep in mind they have to rinse n wash out of NG
Takes time for turn around
some one has to buy them out
cc
sold 14.12
does it retrace back to bottom and back up ????????
off to doctors appt
cc
was going to wake up n sell.....woke up late
will hold for now
my original number was 2.95 for turn around
should have kept to it
cc
winter supposed to be wet and cold to the bone
according to some weather forcasts
cc
see in morning if this moves ng
cc
see if the news moves Oil/GAS in morning
cc
Oil jumps on Mideast tensions, London attacks hurt sterling; stocks subdued
Most Popular Articles
NewsAnalysis
By Reuters - Jun 04, 2017
Saudi Arabia raises July crude prices to Asia after OPEC extends cuts
SINGAPORE (Reuters) - The dollar inched up from a seven-month low hit after U.S. jobs growth in May missed expectations, while sterling fell after the attacks in London that killed at least seven people and wounded 48, just days before Thursday's national election.
Oil jumped after Saudi Arabia, Egypt, the United Arab Emirates and Bahrain severed their ties with Qatar on Monday, accusing the wealthy Gulf Arab state of supporting terrorism.
The coordinated move dramatically escalates a simmering dispute over Qatar's support for the Muslim Brotherhood, the world's oldest Islamist movement, and affects some of the world's biggest oil and gas exporters.
Global benchmark Brent> (LCOc1) advanced 1.1 percent to $50.48 a barrel. U.S. oil (CLc1) also climbed 1 percent to $48.17.
Qatar is the biggest supplier of liquefied natural gas (LNG) and a major seller of condensate - a low-density liquid fuel and refining product derived from natural gas.
https://www.investing.com/news/stock-market-news/dollar-dented-by-jobs-miss,-london-attacks-hurt-sterling;-stocks-subdued-491683
cc
Short-covering Rally Fueled by Supply Worries - Natural Gas Price Fundamental Daily Forecast –
4 hours ago
July Natural Gas futures are getting a lift early Monday, underpinned by the news that Saudi Arabia and three other sovereign nations cut diplomatic ties with Qatar.
This is significant news, according to CNBC, because Qatar shares the world’s largest gas field, South pars, with Iran.
July Natural Gas is trading at $3.035, up $0.038 or 1.27% early Monday.
According to CNBC, Saudi Arabia along with Bahrain, UAE and Egypt cut diplomatic relations with Gulf Arab state Qatar on Monday, because of Doha’s ties to terrorism and the need to maintain national security. Additionally, the countries ended all sea and air contacts with Qatar.
CNBC also said that Saudi Arabia’s official state news agency, citing an official source, said the kingdom had decided to sever diplomatic and consular relations with Qatar “proceeding from the exercise of its sovereign right guaranteed by international law and the protection of national security from the dangers of terrorism and extremism”.
The surprise move by the Saudis and the other nations is causing a little unrest in the natural gas market early Monday while coming at a time when the July futures contract is trading under severely oversold conditions.
The early price action suggests that short-covering is taking place and perhaps some light speculative buying. If the rally gains traction, we could see a rally back to the major Fibonacci target level at $3.124.
If the rally fails to draw enough attention to fuel a rally into the upside target then new shorting pressure may re-emerge with the next major downside target the February 28 bottom at $2.888.
According to natgasweather.com, natural gas demand will be near to slightly stronger than normal.
https://www.fxempire.com/forecasts/article/natural-gas-price-fundamental-daily-forecast-short-covering-rally-fueled-by-supply-worries-412308
cc
the chart set up
each chart and info is differant
can be the chart......news....heat maps....futures price....beginning of month....end of month.....volume.....they all play a part
some times trades are not recorded.....not showing volume
they can be commercial trades we never see and cause movement
that'z a hard one to pin point....can be feel of over all market
don't mean to be hard to pin down.....but time frame has lots to do with it
l8r
cc
Here are the temps for last week
55 to 75 degrees

looking at the next 6 to 10 days will be warmer than last week
possibly causing draw on ng reserves
could be good for ng futures
shall see
temps coming next week appear to be 75 to 90
could be good draw down
http://www.cpc.ncep.noaa.gov/products/predictions/short_range/heat/hi_610.php
cc
The implied net flow to working gas totaled 85 billion cubic feet (Bcf) for the week ending May 26. The week-over-week net change in working gas was 81 Bcf, and the 4 Bcf difference resulted from a non-flow inventory adjustment that reduced working gas levels by 4 Bcf for the report week. Working natural gas stocks are 2,525 Bcf, which is 13% less than the year-ago level and 10% more than the five-year (2012–16) average for this week.
https://www.eia.gov/naturalgas/weekly/
cc

