 News
News  Market Data
  Discover
Support: 888-992-3836
Copyright © 2023 InvestorsHub Inc.


floydianslips
![]()
Register for free to join our community of investors and share your ideas. You will also get access to streaming quotes, interactive charts, trades, portfolio, live options flow and more tools.
Register for free to join our community of investors and share your ideas. You will also get access to streaming quotes, interactive charts, trades, portfolio, live options flow and more tools.
Yeah, I have been finding a lot of flags. Not so many ascending triangles. Would like a cup and handle or two, but what are you going to do? Unfortunately I have some cash still tied up in stupid moves I made before I found your board and some sort of trading sanity. Double bottoms seem to be a flavor of the day also.
Nice. If only optimism paid the bills! Okay I will give a couple more that aren't downtrend sym tri's.


Haha, I told you I was an optimist.
A couple of strong watch stocks. TIV & UQM. Both symmetrical triangles. I know they can break either way, but I am an optimist.


I got bored last night and read your exchange on the ATRN board. Great stuff. I was laughing at the German guy/girl and the nonsense that was spilling out from them. They must be getting paid by a promo company right? It seemed like they were 3 years old on a playground....well why don't you put your successes against mine? Haha, get the f out of town you promo clown. Some people don't want to know the truth, or even a perspective that differs from their own.
Paid promoter?
Nice, I got no scratch to get into it right now. My plan was .22 to .30, but no go. I am having some issues with my brokers lately. Very annoying, but still nice to see plans that would have panned out. Got into ABR today though.

LQMT is off and running.
RIGH and MJNA. Here are two speculation plays I am in. I found both of them while searching for stocks from the CBIS sector. RIGH looks like it wants to move whenever the gates are open. Looks similar to a pond to me.
MJNA just speculating on retail emotion carrying it up a bit.


Terrific. Thank you sir. Many hours a day to try and learn this. You are invaluable. I just found those flags today so tomorrow the show begins. I will read your comments about the other patterns and figure those out too. I never knew I would enjoy this so much.
Thanks again
DMND. This one is to go with all the gap talk lately. If DMND can get their chit together it could be an epic gap run.

Well this message was a double of another one. Somehow it produced 2 posts. I don't know how to delete it so.....well one thing is that I have been watching CCTC for awhile now, and of course my internet crapped out today so I missed the boat. Oh well. I have been working hard on the plan the trade and trade the plan philosophy. So I will let that one go. I have been watching JOEZ also. I had entry at $1.00 for myself, so maybe tomorrow I will enter.
My brain hurts from all the charts I have been looking at, but it is good practice. If anyone is interested a good way to look at charts is to go to finviz.com and click on screener. You can set you perameters there and if you put your mouse on the price of the stock a mini chart will pop up. I then make a list of interesting looking charts and then head to stockcharts.com to really analyze them. I am up to "F" in US stocks and have found many nice patterns. I am sure there is an easier and faster way, but this has been working for me.
Hope this helps someone...again I was just trying to delete a duplicate post.
CCUR and BK. And a sym triangle and an ascending wedge.


AGYS and CALD.
Here are a couple of flags put onto strong watch today.


CMFO and TEA added to strong watch.


MNTG decided to blow past the resistance. It is now in a short flag pattern. I have been watching this one sky rocket looking for an entry. Haven't pulled the trigger yet though.

Hey LT, what do you think about ENB?

In small in CYBI. Hopefully a bit more volume to come....

If CYBI breaks above resistance I was wondering how you would play it? I am not sure if a candlestick tale counts as bouncing on the 50%. Or is it a 100% pole play? Thanks.

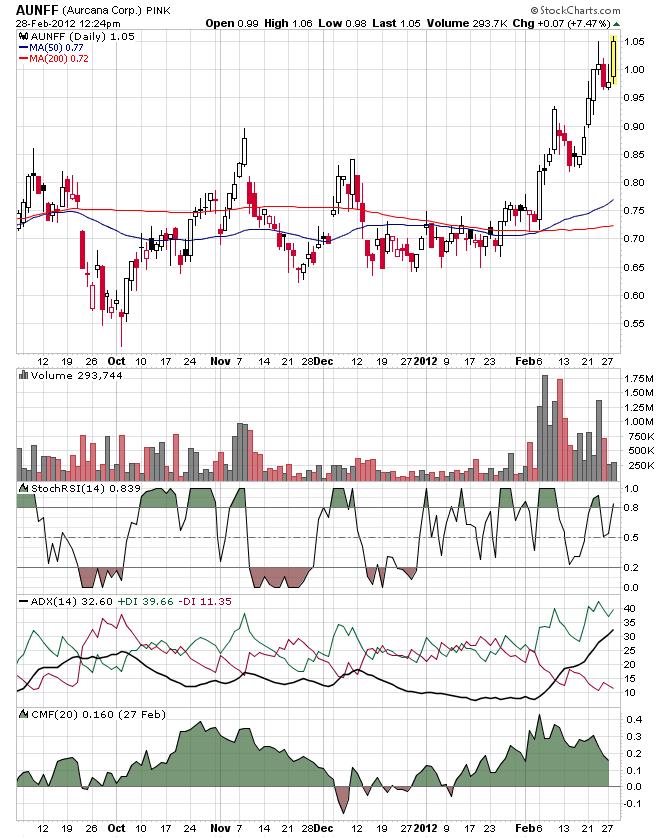
Third generation Flag breakout for AUNFF.
Possible cup and handle for PVSP. IMO

Thanks. That is what I was thinking after I posted that. May be a good play.
Just one more for tonight.

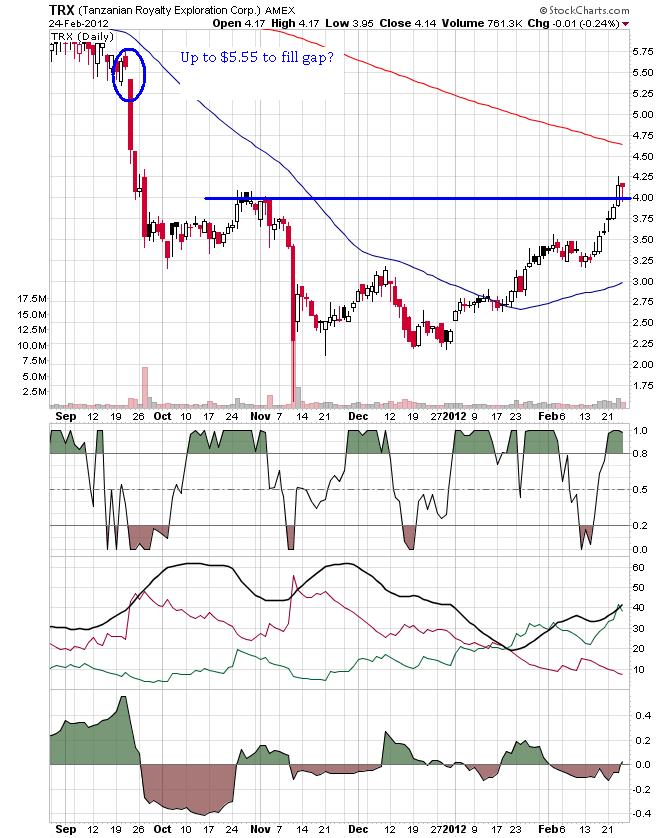
Alas another chart. I feel these are better than the others I have provided at least. Entry after $4.25?
Any thoughts on this one? Appears it broke all resistances. Any way to play this at this point?

Major resistance at $3.10.
However charts look good and 50 is catching 200.

Here is another one on strong watch.

I don't remember seeing any MNTG charts here.
Broke upward channel.

I understand. These have been put on watch. I am not necessarily looking for these pops they just happen to be some of the charts that I have tried to analyze. Luckily I have time to spend a few hours a day learning this. Everyday I check out your board and try to contribute sometimes. The rest of the time is trying to learn L2 and looking at many charts to find good plays. I will keep the flash in the pans to a minimum. Gracia.
So you reckon it's a one and done, wham bam thank you ma'am, hit and run job?
Here is another interesting chart. Loads of PR recently also.

Looks like the ol' crowd favorite COHO developed a small ascending triangle.

Haha, no kidding. At least it wasn't me this time. Thanks to our mutual friend lowtrade. Patience and the knowledge that there will be others are starting to resound through my dreams. Here is another chart I found that is random...to my unrefined eye that is.

Just added MUX to strong watch for flag pattern. Target $9.00.

Thanks for the the advice on the other stocks LT. Unfortunately I don't have the funds available right now to play them. Really liked CBIS on the flag...anyhoo, I was wondering what you thought of this one. They have put out a PR every week in Feb and it is a crazy spike the last couple of days. Perhaps a right place right time situation?

What made you decide to enter now? It seems all the indicators are not very good for entry. Perhaps I am missing something....again.
Howdy lowtrade. Here are a couple of charts that interest me. I am pretty sure you are in CIM...if I remember properly. It appears to be a flag bouncing off of the 38. From what you told me before I can expect new highs with this pattern. Does this mean that a target price would be:
3.15-2.55=.60
2.90+.60= 3.50?
Also SHEN, should this be played like a double bottom? That is the way I see it. I tried to make it a cup and handle, but it seems to short of a time frame and to much of an angle for that.
Thanks


Okay here goes. It appears to me that CBIS is a flag pattern. Is it to be expected that from the bounce off the 61.8 line that a goal exit price would be .08? Or am I completely off base....again?
Although I just notice the exhaustion candle followed by a red day....followed by a green day...so far. I need a helmet because this is blowing my mind.
Thank you mucho. I have been copying charts into paint and doing the math for the fib myself. It is a whole lot easier and faster your way. Just when I think I am figuring this out a bit, wham more info. It is enjoyable however. You are a gentleman and a scholar.
Roger. Thanks for that. I just had to look up the PDUFA. I think I will finish my wine and pick this back up in the morning. I appreciate everyone on this board who wants to help and not just gloat or talk smack.
Thanks a lot. That is the info I was looking for. I actually just found a website that explains it some also. As far as the bio stocks info, that is good too. Eventually I will figure this out a bit. It is coming....slowly.

