News
News  Market Data
  Discover
Support: 888-992-3836
Copyright © 2023 InvestorsHub Inc.


gitonwithit
![]()
Register for free to join our community of investors and share your ideas. You will also get access to streaming quotes, interactive charts, trades, portfolio, live options flow and more tools.
Register for free to join our community of investors and share your ideas. You will also get access to streaming quotes, interactive charts, trades, portfolio, live options flow and more tools.
TOS SQ9 Study
Modified this from Richard Houser's code on the Yahoo TOS group. Plan to go back and make it autoadjust to the highest/lowest on the chart and add the 30 degree hashes and the 72/144 also. Works pretty good though!
 declare upper;

 input date        = 20120628;
 input priceType   = { default low, high };
 input offset      = 40;
 def sign          = if priceType == priceType.low then (1) else (-1);

 def p1            = if GetYYYYMMDD() == date
                        then if priceType == priceType.low
                         then low
                         else high
                       else Double.NaN;
 def price         = if priceType == priceType.low then LowestAll( p1 ) else HighestAll( p1 );
 def sqrtPrice     = Sqrt( price );

 plot i0           = price;
 plot i1           = Sqr( sqrtPrice + ( 0.25 * sign ) );
 plot i2           = Sqr( sqrtPrice + ( 0.50 * sign ) );
 plot i3           = Sqr( sqrtPrice + ( 0.75 * sign ) );
 plot i4           = Sqr( sqrtPrice + ( 1.00 * sign ) );
 plot i5           = Sqr( sqrtPrice + ( 1.25 * sign ) );
 plot i6           = Sqr( sqrtPrice + ( 1.50 * sign ) );
 plot i7           = Sqr( sqrtPrice + ( 1.75 * sign ) );
 plot i8           = Sqr( sqrtPrice + ( 2.00 * sign ) );
 plot i9           = Sqr( sqrtPrice + ( 2.25 * sign ) );
 plot i10           = Sqr( sqrtPrice + ( 2.5 * sign ) );
 plot i11           = Sqr( sqrtPrice + ( 2.75 * sign ) );
 plot i12           = Sqr( sqrtPrice + ( 3.00 * sign ) );
 plot i13           = Sqr( sqrtPrice + ( 3.25 * sign ) );
 plot i14           = Sqr( sqrtPrice + ( 3.50 * sign ) );
 plot i15           = Sqr( sqrtPrice + ( 3.75 * sign ) );
 plot i16           = Sqr( sqrtPrice + ( 4.00 * sign ) );


 #===============================[ Look & Feel ]================================
 i0.SetPaintingStrategy( PaintingStrategy.HORIZONTAL );
 i0.SetDefaultColor( GetColor( 7 ) );
 i0.HideBubble();

 i1.SetPaintingStrategy( PaintingStrategy.HORIZONTAL );
 i1.SetDefaultColor( GetColor( 7 ) );
 ##i1.HideBubble();

 i2.SetPaintingStrategy( PaintingStrategy.HORIZONTAL );
 i2.SetDefaultColor( GetColor( 7 ) );
 ##i2.HideBubble();

 i3.SetPaintingStrategy( PaintingStrategy.HORIZONTAL );
 i3.SetDefaultColor( GetColor( 7 ) );
 ##i3.HideBubble();

 i4.SetPaintingStrategy( PaintingStrategy.HORIZONTAL );
 i4.SetDefaultColor( GetColor( 7 ) );
 ##i4.HideBubble();

 i5.SetPaintingStrategy( PaintingStrategy.HORIZONTAL );
 i5.SetDefaultColor( GetColor( 7 ) );
 ##i5.HideBubble();

 i6.SetPaintingStrategy( PaintingStrategy.HORIZONTAL );
 i6.SetDefaultColor( GetColor( 7 ) );
 ##i6.HideBubble();

 i7.SetPaintingStrategy( PaintingStrategy.HORIZONTAL );
 i7.SetDefaultColor( GetColor( 7 ) );
 ##i7.HideBubble();

 i8.SetPaintingStrategy( PaintingStrategy.HORIZONTAL );
 i8.SetDefaultColor( GetColor( 7 ) );
 ##i8.HideBubble();

 i9.SetPaintingStrategy( PaintingStrategy.HORIZONTAL );
 i9.SetDefaultColor( GetColor( 7 ) );

 i10.SetPaintingStrategy( PaintingStrategy.HORIZONTAL );
 i10.SetDefaultColor( GetColor( 7 ) );

 i11.SetPaintingStrategy( PaintingStrategy.HORIZONTAL );
 i11.SetDefaultColor( GetColor( 7 ) );

 i12.SetPaintingStrategy( PaintingStrategy.HORIZONTAL );
 i12.SetDefaultColor( GetColor( 7 ) );

 i13.SetPaintingStrategy( PaintingStrategy.HORIZONTAL );
 i13.SetDefaultColor( GetColor( 7 ) );

 i14.SetPaintingStrategy( PaintingStrategy.HORIZONTAL );
 i14.SetDefaultColor( GetColor( 7 ) );

 i15.SetPaintingStrategy( PaintingStrategy.HORIZONTAL );
 i15.SetDefaultColor( GetColor( 7 ) );

 i16.SetPaintingStrategy( PaintingStrategy.HORIZONTAL );
 i16.SetDefaultColor( GetColor( 7 ) );

 AddChartBubble(!IsNaN(close[offset]) and IsNaN(close[offset-1]), i1, "45 D " , Color.green);

 AddChartBubble(!IsNaN(close[offset]) and IsNaN(close[offset-1]), i2, "90 D " , Color.green);

 AddChartBubble(!IsNaN(close[offset]) and IsNaN(close[offset-1]), i3, "135 D " , Color.green);

 AddChartBubble(!IsNaN(close[offset]) and IsNaN(close[offset-1]), i4, "180 D " , Color.green);

 AddChartBubble(!IsNaN(close[offset]) and IsNaN(close[offset-1]), i5, "225 D " , Color.green);

 AddChartBubble(!IsNaN(close[offset]) and IsNaN(close[offset-1]), i6, "270 D " , Color.green);

 AddChartBubble(!IsNaN(close[offset]) and IsNaN(close[offset-1]), i7, "315 D " , Color.green);

 AddChartBubble(!IsNaN(close[offset]) and IsNaN(close[offset-1]), i8, "360 D " , Color.green);

 AddChartBubble(!IsNaN(close[offset]) and IsNaN(close[offset-1]), i9, "405 D " , Color.green);

 AddChartBubble(!IsNaN(close[offset]) and IsNaN(close[offset-1]), i10, "450 D " , Color.green);

 AddChartBubble(!IsNaN(close[offset]) and IsNaN(close[offset-1]), i11, "495 D " , Color.green);

 AddChartBubble(!IsNaN(close[offset]) and IsNaN(close[offset-1]), i12, "540 D " , Color.green);

 AddChartBubble(!IsNaN(close[offset]) and IsNaN(close[offset-1]), i13, "585 D " , Color.green);

 AddChartBubble(!IsNaN(close[offset]) and IsNaN(close[offset-1]), i14, "630 D " , Color.green);

 AddChartBubble(!IsNaN(close[offset]) and IsNaN(close[offset-1]), i15, "675 D " , Color.green);

 AddChartBubble(!IsNaN(close[offset]) and IsNaN(close[offset-1]), i16, "720 D " , Color.green);
Trythisagain do you ever do any TOS scans? I saw your board on TOS and I've been working on some scans relating to Gann stuff just wondering if you use it.
TOS Scan that I have been working with that looks for bar counts between high and low that are along the 270 degree of the SQ9. So far TOS seems woefully inadequate for scanning by date since only constants are allowed with many of the date functions like getYYYYMMDD()[1] works but not replacing the "1" with a variable. Either that or I don't know enough about it yet!
Anyway, here is the scan along with a fundamental filter of last>10, it looks for the high or low of the last 300 bars to be within the last 10 days too.
 def highbar = getmaxvalueoffset(high,500);
 def lowbar = getminvalueoffset(low,500);
 def range = if highbar<10 or lowbar<10 and volume[1]>volumeavg(50) and volume[1]>500000 then absvalue(highbar-lowbar) else 0;
 plot lookup = if range==72 or range==144 or range==25 or range ==49 or range==81 or range==121 or range ==169 or range==361 and volume[1]>500000 then range else double.NaN;
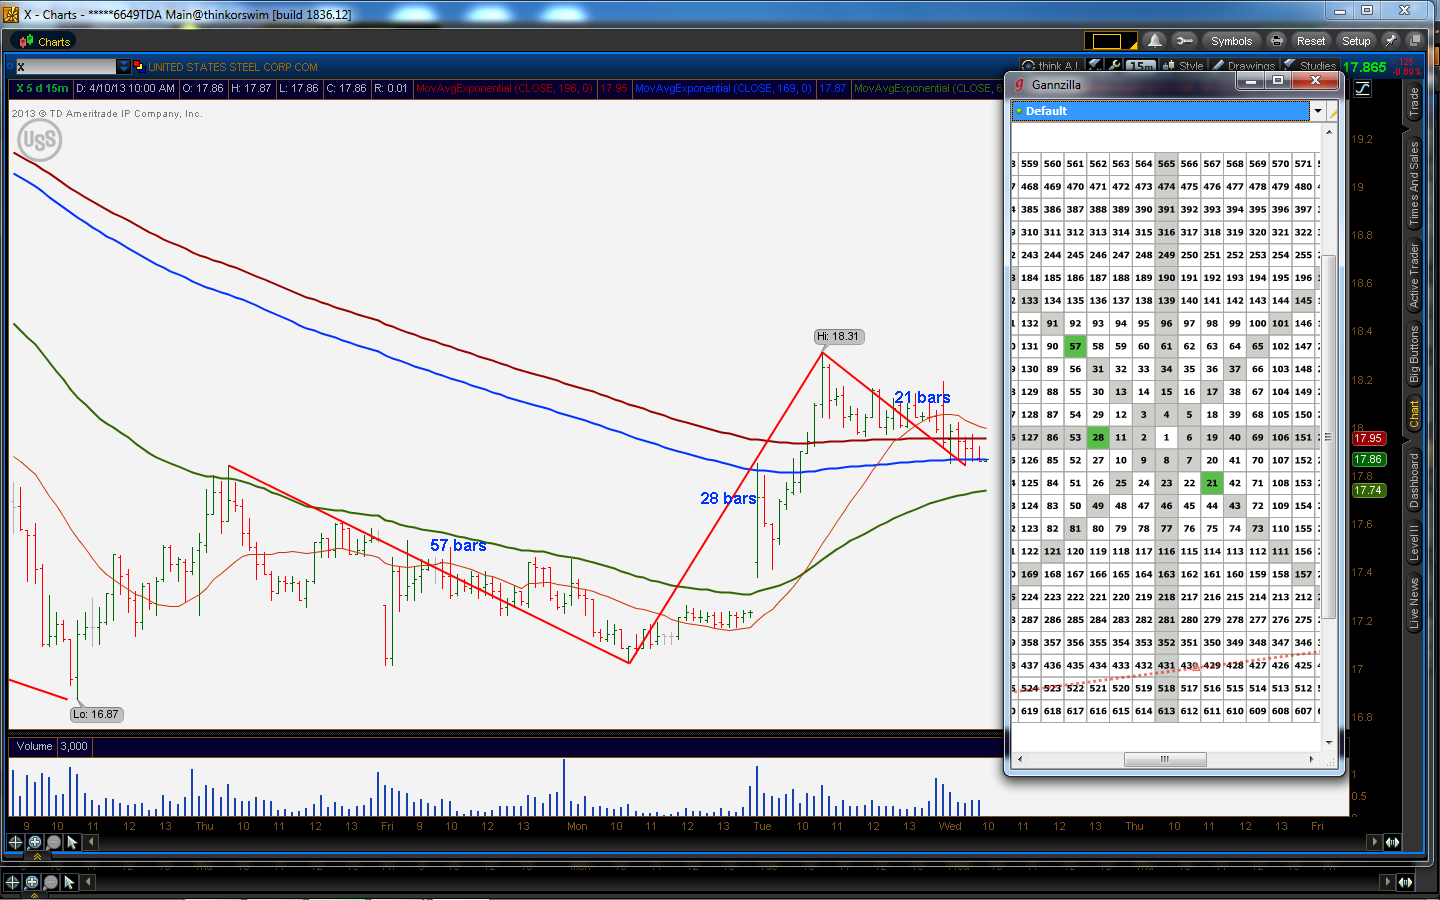
X Chart. I've been following X with some interest mainly because of the short interest trying to pick a point where she might pop. Here is 72 days from the last high and longer term I see 2.84 price movement in 561 days which is pretty close to the "2" ratio (284/561). We'll see what happens.

Cool whatever, I certainly don't have all the answers but maybe in time some more folks will join and contribute their knowledge too. Gann is some pretty timeless stuff and as much as I try to apply it it FX it just doesn't make as much sense because of the decimals and the minimum price steps and the zero sum nature of it. Calculated some interesting sq9 stuff with some of the yen crosses but then the same methodology didn't seem to apply to stuff like au or gu so I just decided to see if I could use it as intended. Gann did a lot of stuff and my favorite is the square of 9 and most of my charts are related to it in terms of time cycles
Well guys I don't know about you but I am buying some METAL this week, physical that is! All this crap about Cyprus dumping a few tons on the market I say hogwash! Fundamentals will rule in the end and the fact is that there are no bullets left that anyone can load up to rectify the reckless fiscal irresponsibilities of the past. They can talk shit out the side of their mouth all day long and play with the CPI and whatever but it doesn't change one single thing about the true facts. They play golf every weekend while the country goes to hell in a handbasket and still just talk about the same old things on Monday morning. I believe in hard assets until the makings of a true recovery are in place in maybe 10 years or more.
BTW I started a gann board on ihub too. After thinking about it for a long time I have come to the conclusion that gann stuff is really hard to apply to a zero sum market like FX so been trying to learn as much as I can about it and apply it to stocks and commodities and indexes like gann used. Not to say there aren't cycles and gann applications in FX but FX I think has some unnatural pressures which make basic gann stuff very hard to use. Hell anything is hard to use in FX sometimes!
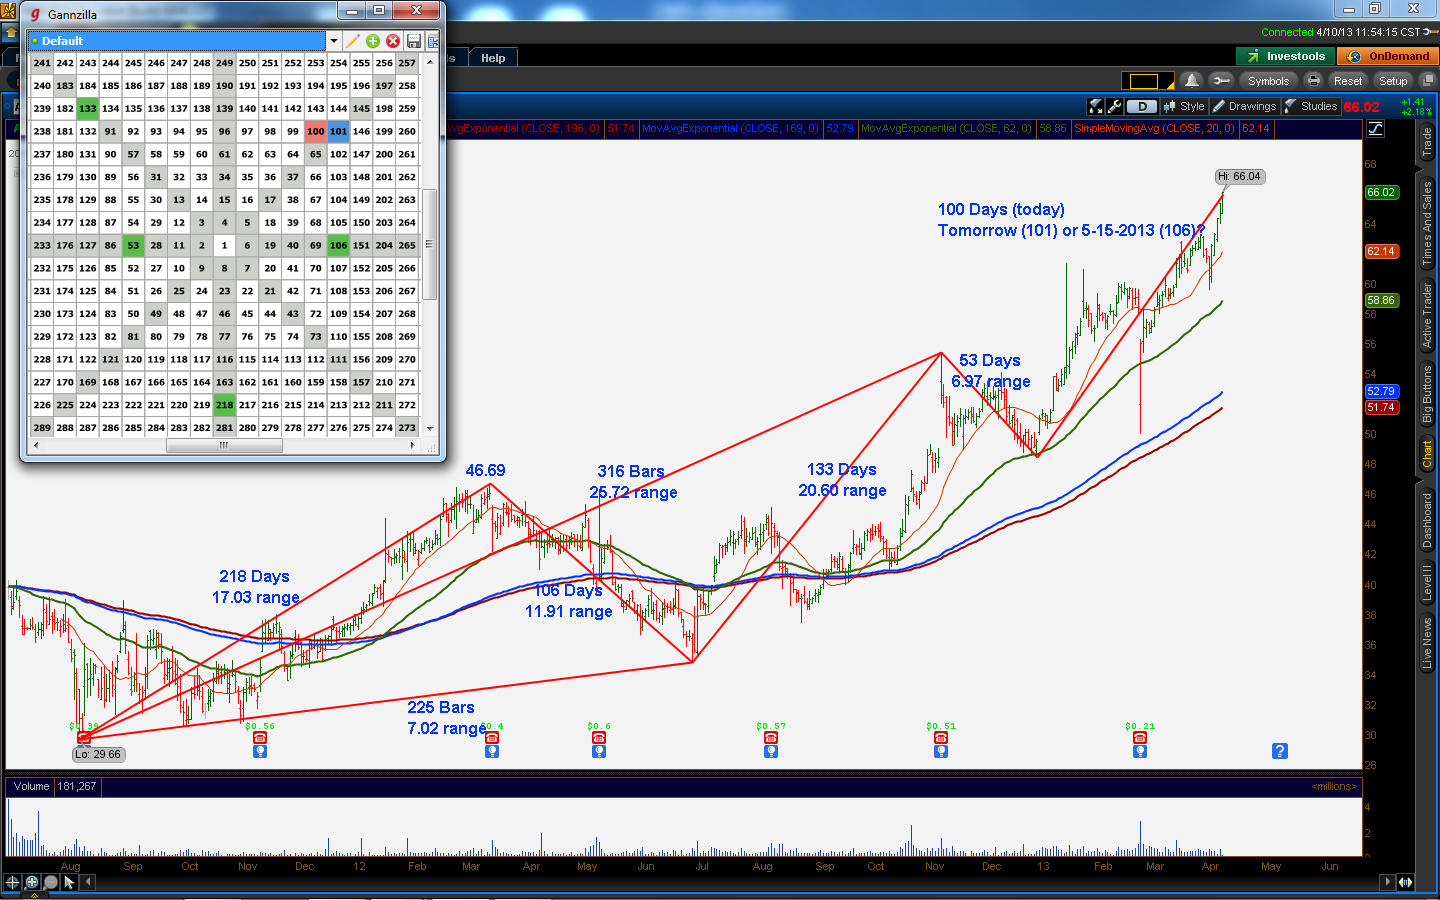
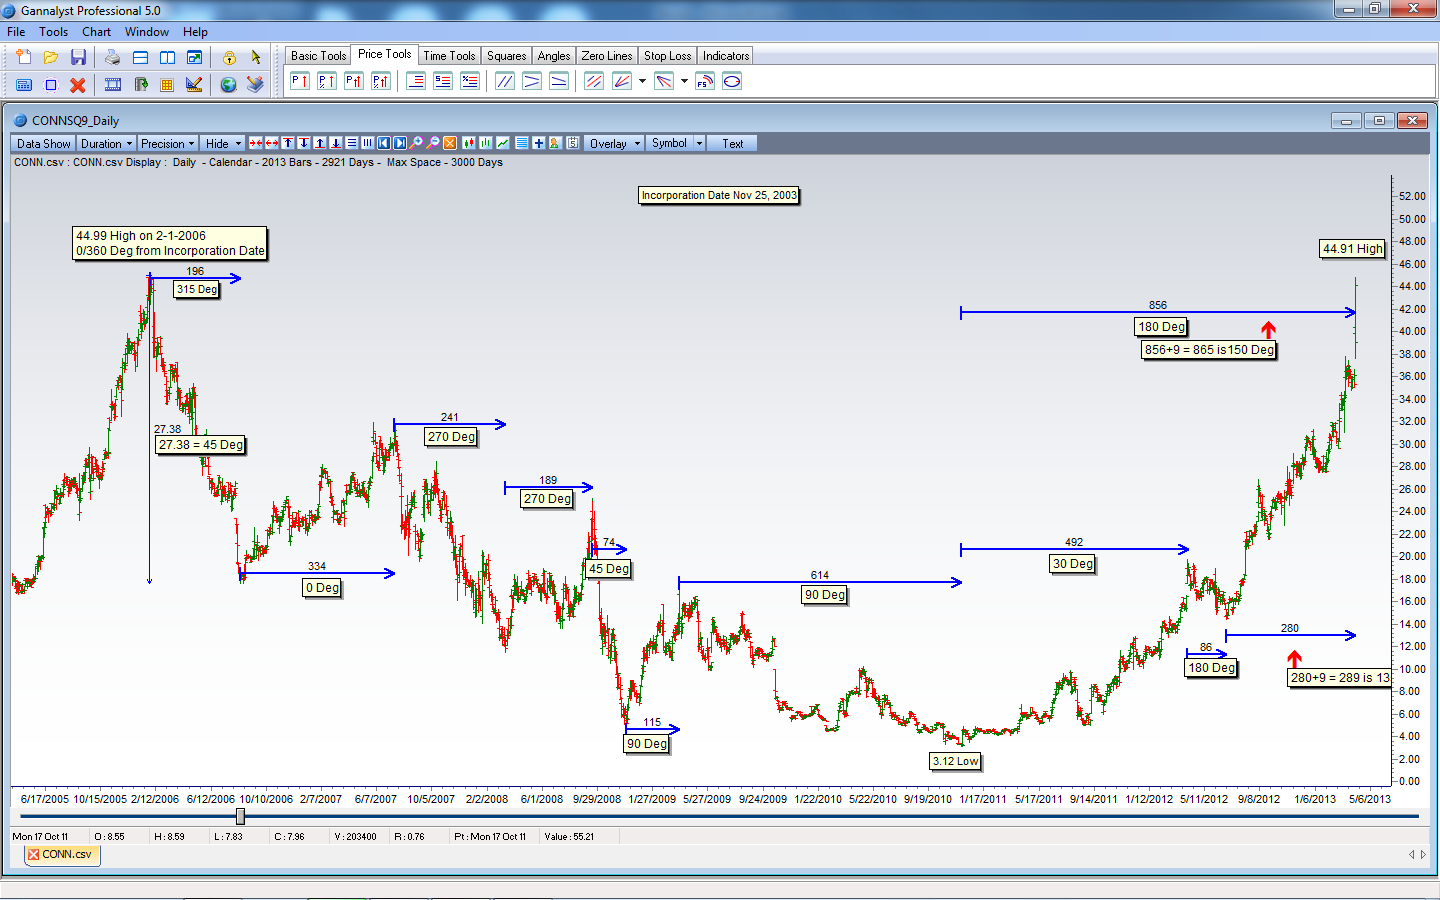
Here's a pretty datailed look at CONN times from a SQ9 perspective using Gannzilla. Could be something coming up in 8 days when the 150 degree 3.12 to current timeframe aligns with the 289 day 135 degree mark. Have to check the prices to be sure, right now the 856 day is exactly 180 degrees. Pretty amazing that the 2-1-2006 high was exactly 360 degrees from the 11-25-2003 incorporation date.
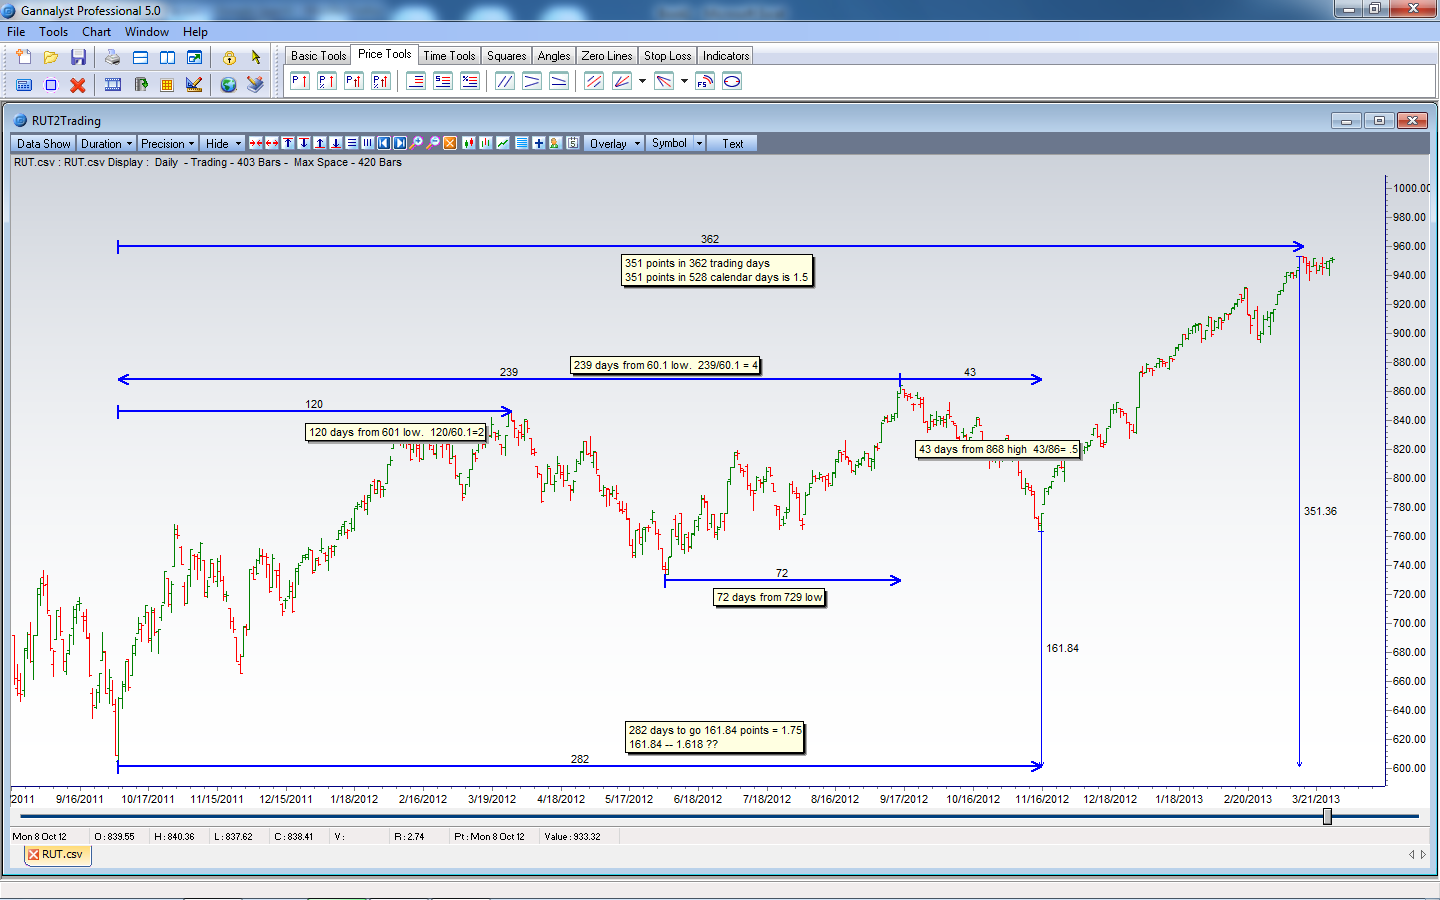
Russell 2000, Gann Style
This is trading day chart (except for the double notation for the calendar days at the top). Haven't updated the candles since it hasn't broken the 954 top but I would look for more drop to come. 1.5 ratio on that long of timeframe is pretty serious mark to pass. I like RUT because it consist of 2000 stocks instead of just a small selection and better indicator of overall sentiment I think.
Also, here's a good article on Gann if you're interested.
http://www.ibfx.com/Education/Gann-Theory

Actually I'm not so sure that the top isn't in already, or if not it very very close.
In this chart the two heavy green time/price sequences are almost exactly the same at 1.5. For the heavy red, it shows 1467 when I back it up to 3-15-2013, and converting to trading days from calendar I get 1044 plus or minus a bit (not sure how leap years really fit into the whole thing). So the ratio between rise and run is 1.707 with .707 being the square root of .5 and the inverse of 1.414 (the square root of 2). So 1 + .707 and you can take it from there. Whether it sticks or not who knows but I'm already long SRTY and planning on holding for a double at least maybe more. Also the 409 you see shows as 282 when I change to trading day view but using the days/365*260 I get 291. Not sure which one is right. 409 however is 1.12 of 365 and 1.128 is the root of 1.272 (the inverse of .786). .786 is the root of .618. Anyhow, we'll see what happens.

Anyone else think we're on the verge of a major breakdown?


They've already punished the savers with artificially low interest rates for decades and now they're just outright taking their money.
You guys read zerohedge today?
Here's another good read too.
http://blogs.telegraph.co.uk/finance/ambroseevans-pritchard/100023283/another-step-towards-an-east-west-trade-war/
And Daneric
http://danericselliottwaves.blogspot.com/
Russel 2000
10 points to go on RUT and it's flush time for the koolaid boat. 125 months from that low also. Be short and stay short I think.

Tough stuff today baby, and it's just Monday!
Low volume run in the afternoon? Me thinks they looking for suckers here on the afternoon flag.
Yup, last weekly high will hold on gj
FAIL.
JPY fail. USD fail. All the BS fiat lies told about no inflation despite easing FAIL.
EJ Weekly. Since these are weekly candles the divisions may not be exactly represented as in exact fibs but you can see what it look like. I'll check the daily.

72 weeks from the bottom on GJ also known as 360 trading days. Much farther to fall here so don't be fooled by the Abelaid.

Daily doji on GJ, imagine that!
Soundtrack for the forthcoming movie provided by:
"Since the gold standard determines the money supply, there is not much scope for the central bank to use monetary policy to stabilize the economy,” Bernanke said during a speech at George Washington University last year. "Under a gold standard, typically the money supply goes up and interest rates go down in a period of strong economic activity -- so that's the reverse of what a central bank would normally do today."
Read more: http://www.foxnews.com/politics/2013/02/06/virginia-is-one-step-closer-to-returning-to-gold-standard/?test=latestnews#ixzz2KBERDGvO
That's the whole point no?
Last chart and I gotta run. Have a good un guys and watch for falling Koolaid jugs!

Yes, consider this 5 touch triangle.

I think the range the last few days says a lot too. Down triple digits then up triple digits then I suspect today is going to be down some more. Reality about to set in and no amount of printing is going to fix it.
Who knows, maybe should hold for 104. Reddish lines are the same length and there are some unique candle prints on the top to bottom fibs at this level.
This is a monthly chart and we are 67 months from the top so on a really really long timeframe, however 67 is a key number.
"Watch for significant days in solar year - Dec. 22, March 21, June 22, Sep 21/23 etc. and days on important angles from these days e.g. 15 days from Dec. 22 i.e. Jan 5-6, Feb 5, May 6, July 7, August 8 etc.
Important count of days: Significant changes in trend may take place on the following days from the significant highs/ lows - 30, 45, 60, 90, 135, 150, 180, 210, 225, 315, 330 and 360.
These are calendar day counts: Trading day counts are 11, 22, 33, 45, 56, 67, 78, 90, 101, 112, 123, 135, 146, 157, 168 and 180. True understanding of cycles are obtained from the calendar days."
http://www.cyclesresearchinstitute.org/cycles-research-markets/gann.shtml

Of particular note and interest are the mathematics of where we are at right now. This is a weekly of GJ and we have the .707 which is the inverse of 1.414 (the square root of 2), 1.902 which is the square root of 3.618, 1.272 connecting these points which is the square root of 1.618. Less apparent until we draw the fibs from top to bottom is that the .447 of the top to bottom move is exactly the "center" of all this back on 3-21-12. .447 is the inverse of 2.236 (the square root of 5). Now I can't tell you exactly how all these fit together but there are enough geometric and mathematical things together right here for me to think at least 500 pips to be had.

You bet
I don't know about you guys but I shorted all the GJ I could afford above 147 this morning. Shot in the dark at the time but I think that leading 15 minute channel breakdown would confirm that we've got some downside to go.
Well we shall see I guess if it goes higher or not, although I do think because of govt intervention equities are not a true measure of broad economic prosperity or growth. Bernanke has said all along that he wants to push money into risk assets which is what got us into this shit in the first place so lacking a decent understanding of that principle we simply get more of the same. Whether the boomerang tracks higher or not before it returns to normalcy who knows. At some point the simple MATH of the situation at hand will dictate where we go regardless of where the puppeteers try to mandate. I do think Bernanke, Reid, Abe, and the rest of the goofballs out there will get a paragraph in history as opposed to a chapter unless it's a friggin book about lessons that were there for the taking but ignored.