 News
News  Market Data
  Discover
Support: 888-992-3836
Copyright © 2023 InvestorsHub Inc.


C C
![]()
Register for free to join our community of investors and share your ideas. You will also get access to streaming quotes, interactive charts, trades, portfolio, live options flow and more tools.
Register for free to join our community of investors and share your ideas. You will also get access to streaming quotes, interactive charts, trades, portfolio, live options flow and more tools.
looking for entry into ng.....over 1200 contracts moved and down it goes
looking to enter DGAZ or UGAZ
ng....bid and ask little movement.....should have moved that many contracts
bid side built up higher than ask side and .....
pooooooof.... build disappears on bid side
down it goes
not convinced one way or other as of yet
appears this could be line in the sand move..... one way or another
are they walking the dog......down
12.57 below and down it goes from what I see
cc
open interest's increase is caused by entries into contracts
decrease is caused by exits in contracts
open interest has been decreasing = more folks exiting contracts than holding contracts......
folks not sure which way ng is going so they exit contracts
money managers.....where is all that money going.....they have to park it some where to make money
last post 4 this evening....
l8r
cc
think or swim by TdAmeritrade
hope this helps....headed out...back tomorrow
cc
what happened to 12.96
8:30 this morning UGAZ was 12.91
close @ 12.37
did u short it @ 12.96
where did u get in at
have 2 posts left
highs didn't get high enough.....at least didn't break below lows of last few days
today....low volume
no real commitment by buyers to go one way or another
could it be near capitulation point .....need hold....?????????
cc
I use TOS
On my phone....will try n look it up on computer later
cc
Went n turned water on at rent house
So they have water
Replaced all water lines n glue had to set over night
Mom nor daughter could turn on water this morning
Fixing to do taxes atgggggghhhhhhhhh
cc
headed out he door.....to work
wish u well
cc
2.922 was my choice as well
can u post a chart showing open interest
or a location for tracing it for the board
slow churning.....volume has it come in yet
not convinced yet.....has volume...but ????????????
I have it on TOS
http://futures.tradingcharts.com/chart/NG
cc
thanks.....taking day off from work
a little R & R today
does it re-visit the high again of 2.948 ?????
will it go on up or back down
no catalyst as of yet......doesn't feel like short covering
not enough volume
looking for confirmation
cc
sold 2.937
cc
ng could be trying lift off with open interest so low
open interest was around same point on 2-28
when ng run started @.... 2.887
ran to around 3.50
in ng 2.906
sold 2.937
cc
could be trying lift off with open interest so low
open interest was around same point on 2-28
when ng run started @.... 2.887
ran to around 3.50
in ng 2.906
cc
Open Interest...on 5-2 = 325k...on 6-21 = 99k
1. If prices are rising and open interest is increasing at a rate faster than its five-year seasonal average, this is a bullish sign. More participants are entering the market, involving additional buying, and any purchases are generally aggressive in nature.
2. If the open interest numbers flatten following a rising trend in both price and open interest, take this as a warning sign of an impending top.
3. High open interest at market tops is a bearish signal if the price drop is sudden, since this will force many weak longs to liquidate. Occasionally, such conditions set off a self-feeding, downward spiral.
4. An unusually high or record open interest in a bull market is a danger signal. When a rising trend of open interest begins to reverse, expect a bear trend to get underway.
5. A breakout from a trading range will be much stronger if open interest rises during the consolidation. This is because many traders will be caught on the wrong side of the market when the breakout finally takes place. When the price moves out of the trading range, these traders are forced to abandon their positions. It is possible to take this rule one step further and say the greater the rise in open interest during the consolidation, the greater the potential for the subsequent move.
6. Rising prices and a decline in open interest at a rate greater than the seasonal norm is bearish. This market condition develops because short covering, not fundamental demand, is fueling the rising price trend. In these circumstances money is flowing out of the market. Consequently, when the short covering has run its course, prices will decline.
7. If prices are declining and the open interest rises more than the seasonal average, this indicates that new short positions are being opened. As long as this process continues it is a bearish factor, but once the shorts begin to cover, it turns bullish.
8. A decline in both price and open interest indicates liquidation by discouraged traders with long positions. As long as this trend continues, it is a bearish sign. Once open interest stabilizes at a low level, the liquidation is over and prices are then in a position to rally again.
cc
Using Open Interest To Find Bull/Bear Signals
Open interest is an indicator often used by traders to confirm trends and trend reversals for both the futures and options markets. Open interest represents the total number of open contracts on a security. Here we'll take a look at the importance of the relationship between volume and open interest in confirming trends and their impending changes.
Volume and Open Interest
Used in conjunction with open interest, volume represents the total number of shares or contracts that have changed hands in a one-day trading session in the commodities or options market. The greater the amount of trading during a market session, the higher the trading volume. A new student to technical analysis can easily see that the volume represents a measure of intensity or pressure behind a price trend. The greater the volume, the more we can expect the existing trend to continue rather than reverse.
Technicians believe that volume precedes price, which means that the loss of either upside price pressure in an uptrend or downside pressure in a downtrend will show up in the volume figures before presenting itself as a reversal in trend on the bar chart. The rules that have been set in stone for both volume and open interest are combined because of their similarity; however, having said that, there are always exceptions to the rule.

Figure 1: General rules for volume and open interest
So, price action increasing in an uptrend and open interest on the rise is interpreted as new money coming into the market (reflecting new buyers); this is considered bullish. Now, if the price action is rising and the open interest is on the decline, short sellers covering their positions are causing the rally. Money is therefore leaving the marketplace; this is a bearish sign.
If prices are in a downtrend and open interest is on the rise, chartists know that new money is coming into the market, showing aggressive new short selling. This scenario will prove out a continuation of a downtrend and a bearish condition. Lastly, if the total open interest is falling off and prices are declining, the price decline is likely being caused by disgruntled long position holders being forced to liquidate their positions. Technicians view this scenario as a strong position technically because the downtrend will end once all the sellers have sold their positions. The following chart therefore emerges:
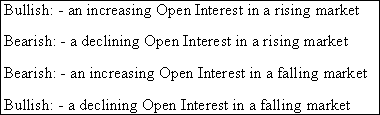
Figure 2: Bullish and bearish signs according to open interest
When open interest is high at a market top and the price falls off dramatically, this scenario should be considered bearish. In other terms, this means that all of the long position holders that bought near the top of the market are now in a loss position, and their panic to sell keeps the price action under pressure.
http://www.investopedia.com/articles/technical/02/112002.asp
cc
we need to put on ...Seat Belts n Helmets
cc
acrazjo chartz don't lie
chartz tell a story
MM's print chart to go some where.....our job as investors/traders is to interpret those chartz.....where are they going.....what are they doing.....what are they saying....where are they going to turn
if you look deep enough into the chart I believe one can tell it'z historical points of recovery/turn/movement/direction
I used to NOT think this.....but....think it'z true
if there'z money in a chart I believe they are printed at turning points
look at the chart ur trading.....name one stock u trade a lot.....where there is a lot of money turning in that stock
I would be very surprised if it'z not being printed
not to say it is controlled......but historical turning points are contrived I believe
one can look at a chart without indicators and tell where it'z going
have done it time after time.....some times within .005 of getting close to the point of turn....not every time
don't get it right every time....but....most of the time can get very very close
I use NO indicators to trade with.....know how to use them
but have found indicators tell u where a stock has been not where it is going
I know this is hard for some to trade/wrap their head around.....but....it works for me....not 4 every one
best of luck to u
had a buy order in 4 UGAZ for 12.30.....just cancelled it
right or wrong.....way I read it
risk vs reward
conservation of maoney
cc
UGAZ could form a reversal H & S if 12.25 holds and back up it goes
if UGAZ chart breaks down we could be headed for 10.21
then 5.70 is next stop off point
not for sure it will......
ur right there has NOT been much volume 4 today.....not good
UGAZ held up on fumes
cc
CL chart says trying to break down
has broken down tru support back in May
trying to reach support back in Nov of 2016
MY.....looking into historical points
NG is currently on life support.....if this line fails we are headed lower....I feel
that is my opinion....for what it'z worth
if this line of defense fails we could possibly be headed for 2.5 - 2.6 area
cc
doesn't have complete direction yet....UGAZ chart broken
the chart is re-setting.....getting direction
chart is printing for direction
which way it goes......I call it the herd principal
turning the herd
if you look into the chart you can get direction
will try and do that tonight.....after America Has Tallent
if I can.....shall see
cc
had buy order in @ 12.30 around 2:00 pm
placed on my phone and internet went whacko just after
no internet service since 2:15
still no internet on phone.....trying to figure out
will try turning off and back on
now at home....on computer.....came down to 12.31 and bounced
argggghhhhhhhhhhh
cc
Yes it eventually ....probably will
Headed on vacation mid July
To Disney world with grandkids
Will stay on grounds and catch shuttle...will have wrist bands to get on rides...wrist bands will allow us to go to head of line to get in rides as well as eating places
Gonna be nice
We are used to the heat here in Louisiana...weather/heat wont be a problem
I like the heat
Am waiting to enter U for now
Watching for signs
cc
Thanks...saw that
cc
didn't buy this morning
headed out to work
don't have time to play it
cc
started to buy last night just before closing
could have bought at 12.40
but didn't
not sure yet if headed up as of yet
shall see this morning
ran out of post last night or would have let u know
have 15 posts per day
from now on will watch closer
--------
ask on UGAZ was 12.39........now 12.50
bid was 12.39......now 12.42
it'z all over the place
seat belts n helmets
------
bid 12.47.....ask 12.50
--------
bid 12.49....ask.....12.55
------
12.51.....ask....12.56
this is crazy....all less than 5 minutes
last trade has never changed.....still @...12.45
---------
1 min latter
some one just bought @ 12.52 and they'r walking it back down
cc
Look back at April how low it was
Bammmmm
It turned n jacked up real high
Went from 2.82 to around 3.30
cc
Crack that whip....turn the herd......lol
cc
At work.....chart broken 4 UGAZ.....
cc
Lol
DGAZ slams into lows.....n....back up it comes with a vengance
the herd principal
cc
no problem.....have to head to work soon myself
folks careful....could still have 2.8 to take out
all ready broke tru the low of April
chart is broken
cc
surehand.....if u want I will
think it would be nice if you would explain....for newbies....how to read it
how do they use it
if u would....put it all in a post and can link it up there
cc
remember the herd principal
cc
remember this one on the DGAZ board.....warned um
most didn't listen
ur chart (DGAZ) indicates reversal coming
look at the diversion of right leg of lower high on Macd and CCI
usually indicates lows coming
so who gets caught if ur playing....r u quick enough....can u stay ahead of the big boys
do they slam it shut before u can get ur sell tru
helmets n seat belts folks
ur chart indicates reversal coming
look at the diversion of right leg of lower high on Macd and CCI
usually indicates lows coming
so who gets caught if ur playing....r u quick enough....can u stay ahead of the big boys
do they slam it shut before u can get ur sell tru
helmets n seat belts folks
arggghhhhhhhhhhhh for long hot summer
broke tru support
cc
could be ......fixing to get real ugly
broke tru support......arggghhhhhhhhhhhh for long hot summer
cc
do I see it right......now....2.971
cc
herding the market[.....making it go the way they want it to go
just when you think your safe
they herd the market the other way
panic selling soon
cc
if it breaks below here we could possibly 2.50 - 2.40
cc

