 News
News  Market Data
  Discover
Support: 888-992-3836
Copyright © 2023 InvestorsHub Inc.


| Followers | 1652 |
| Posts | 18,274 |
| Boards Moderated | 1 |
| Alias Born | 11/10/2004 |
| Twitter Profile: | Temporarily Unavailable |
| Follow on Twitter: | Follow @ Temporarily Unavailable |
lowtrade
![]()
Register for free to join our community of investors and share your ideas. You will also get access to streaming quotes, interactive charts, trades, portfolio, live options flow and more tools.
Register for free to join our community of investors and share your ideas. You will also get access to streaming quotes, interactive charts, trades, portfolio, live options flow and more tools.
CDE
See an exhaustion candle today. Nothing goes up for ever. Fundies don't look good. No idea what caused this run. But IMO doesn't deserve it. Maybe an all boats thing with the S&P going crazy also. Ps; closed my FAS position today. Think S&P emotion is dying down)
At any rate a swing trader should take NOTE when they see a high candle exhaustion candle spike. Especially when it includes larger then normal volume. Odds are the reversal is just around the corner. I'd recommend playing it much closer to the vest from now on. Definitely not a long term hold after any exhaustion candle. More of a fingers crosses(maybe) it will continue swing position.
LUCK
Chart wise says the same thing. Flags normally come in 3's. This exhaustion candle is at the third flags target price.
Ps; The black candle notes it gapped open and finished below the opening gap. Also not a good sign for continuation. Because it's a signal retail wanted more, but emotion lost to reality and enough just became enough. Black candles :Trading psychology thing.

It seems to be a fine company with growth and a descent management. But the stock is dull.
Check 2016 interim report
https://www.thea2milkcompany.com/investor-centre/results/
Mid term chart needed work to find? Have no idea where you found it to become interested.
http://www.nasdaq.com/symbol/acopf/interactive-chart?timeframe=6m&charttype=line
They missed annual earnings. Means squat if your in it long term for the dividend income, like I've been for 2 years. Actually each time it hits a large price dive below my basis price, I usually add some and lower my Basis, thus increasing My ROI.
Actually Sold out of NYMT 2016, took Dec divvy & small cash profits from my basis point. When I evaluated what's new in the world of REITs, I ended buying back in on the first price decline @ $4.40.
Right now would be a good time to start a position in this dividend stock. Not saying buy, saying learn about dividend stocks, then decide if NYMT fits your needs. There are other high ROI REITs out there.
Some links for research;
http://www.finviz.com/quote.ashx?t=nymt
http://www.dividendinvestor.com/?chk=ba7d91456546013&symbol=nymt&submit=GO
http://www.dividendinvestor.com/historical.php?no=25222
old posts; education posts
http://investorshub.advfn.com/boards/read_msg.aspx?message_id=116534464&txt2find=nymt
http://investorshub.advfn.com/boards/read_msg.aspx?message_id=116536518&txt2find=nymt
CUR chart

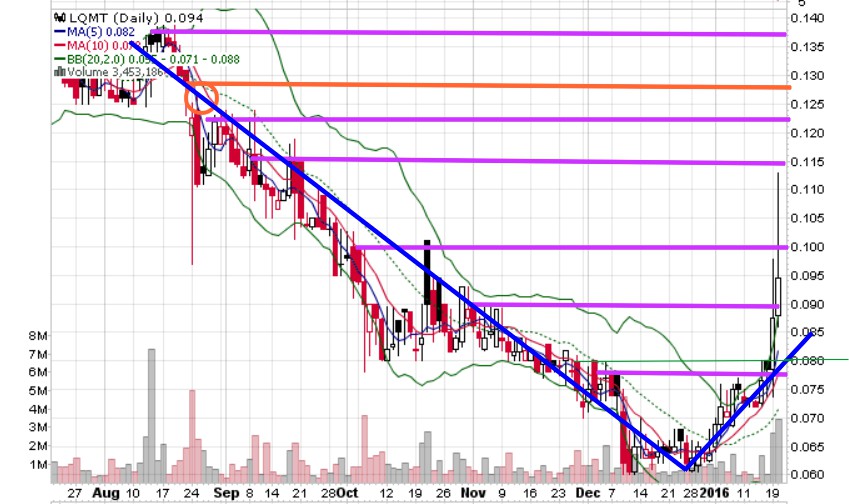
LQMT in pennyland breaking out on flag. Strong watch for .085 resistance break entry. (link back for chart) New target .11, could take a month.
Plan the trade and trade the plan.
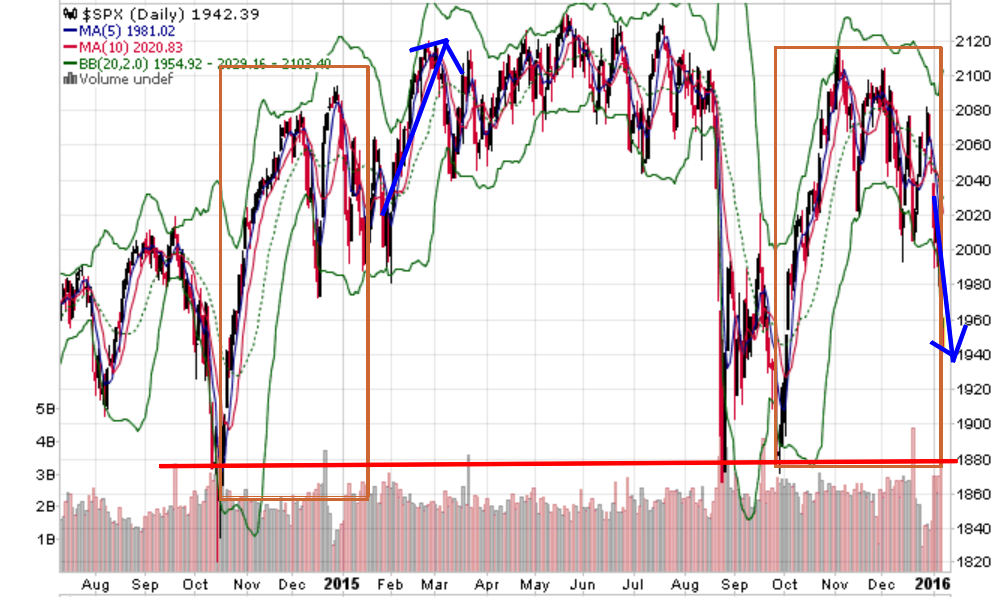
S&P now has 3 gaps below and FAZ has 4 gaps above.
Keep an eye on trading the FAZ gap play for a possible 25% reversal, as the S&P cleans up it's recent emotion run.
http://stockcharts.com/h-sc/ui?s=%24SPX&p=D&yr=0&mn=3&dy=0&id=p16104411080
http://stockcharts.com/h-sc/ui?s=FAZ&p=D&yr=0&mn=3&dy=0&id=p75979553022
Keep an eye on MNZO pink
Oh by the way FANG did not participate IMO because it's a loser Independent Oil & Gas company.
It's had drastic ups & downs for the past 7 months and with a Zero institutional interest it's obvious the management sucks. Seen in the +72% Gross Margin with a -54% Profit Margin.
http://www.finviz.com/quote.ashx?t=FANG
WOW now that's one hell of a call. 1700.
Actually there are some positiveness to the last 2 weeks of S&P action.
1st it has reached the 10% correction status and the retrace has stalled. 2nd, emotion is happening, high volume interest and several emotion gaps. These 2 things are saying bottom.
Add all my TA indicators have either gone positive or are headed that way. Plus the S&P always does well filling gaps and that's what it's doing right now. So looking at gaps there is one sitting up @ 2045 needing fill.
My call is S&P will hit 2045 before 1700.
NEGATIVE interest rates are great for banks. If one is naïve enough to think banks will pass on their windfall to help the economy. Remember they haven't once done so in the past 8 years. LOL

1 for 60 reverse stock split in the works. Will take stock out of naz delisting status and expect that is bringing some who left back into the stock. FREE will remain a Naz stock!
In general dry shipping is a weak sector and not expected to improve in he near term.
LQMT chart

FAS stopped out yesterday -12.5%, looking for 25% gain. LQMT off watch, retrace broke 68% FIBs line, on possible flag play.
Thanks. hit the magic. number. 69.
I haven't heard of that rule. But I have heard of only holding 2 to 3% of your portfolio cash in each investment stock at the big boards. That's called a diversification rule.
As far as The size of a position in either the national exchanges or the OTC. My Rule of Thumb is: don't hold more the 10% of the average daily volume traded. This will do 2 things. 1st allow the size of retail interest large enough so you can sell out quickly without having any problem. 2nd keep the amount your trying to move in or out from driving the price in any direction.
FAS chart;
Slight concern area; bought $22 and it just hit EOD. Didn't really break resistance strongly.
TA: 1 early entry and 1 support indicator positive. 1 each entry & support neutral, leaning positive. But happening on todays +2.5% gain, with strong increasing volume.

Here's a heads up in pennyland. LQMT back on strong watch.
Link back for last post. It didn't continue so took off strong watch. But now a new chart pattern has formed and Monday should be the decision day. TA entry/exit indicators still positive, but support indicators aren't. Also downside volume is increasing, with a very small descending triangle.
So not expecting; but just possible continuation may happen on the flag and the overall single bottom bounce play.
If it does, there may be another 20% gain from 9 to 11 cents. 9 cents will be 1st resistance break and my entry point.
As always; play at your own risk! And remember; runs normally last 3 to 5 days. So don't forget to sell before day 5 or a red day after any high candle spike.. LOL
Latest chart;
Last chart;
Entered FAS today.
I've thought sovereign wealth funds have had a lot to do with OIL price lately. Now after todays 9%, talking heads decide to bring up this subject.
http://video.cnbc.com/gallery/?video=3000486873
The market, LOL what can one say.
They can say; is it time to swing FAS with a core position?
My plan;
S&P 1940 and I'm in. Watch out for todays gap open. But; Many reversals leave the first gap open behind. So if the gap does fill, this may not be the reversal I want. If it doesn't, 1940 first resistance broken will call for a left behind gap and wanted reversal. We'll see.
OIL up 9% in 1 day. LOL, the most speculative of speculation trades. IMO So much relies on sovereign fund games. Talking heads are asking is oil the dog or the tail today. Who's wagging who Market/Oil.
Here's a late heads up in pennyland. I like this company and use to play it back in 2014. Not a scam and it has a good reasons for a come back start now.
Sorry I didn't mention it last week, when I put it on strong watch. I've already planned the trade and am trading the single bottom bounce play plan. Up 25% +/- in 2 trades. 1st to 2nd & 2nd to 3rd resistances. There is still a possibility for 2 or 3 more.
The strange think is it has had large volume support the past 2 days, but have high spike candles. A conflict indicating a savvy retail; day trading and taking profits. This is IMO a plus for more to come. Also runs usually run 3 to 5 days. But with todays real high candle spike if tomorrow shows red, exhaustion was reached already and walk away. We don't like high candle spikes, but we do like large support volumes.
This should be day traded, so play at your own risk! I have my next buy in @ .105 3rd resistance break/ out @ 11.5. If it does continue I'd expect the 5th line passed to fill the gap target @ 13 not 12.25. On the leg up after the one coming up.
In case you don't understand the bottom bounce play :
Your picking the oldest IMO rarely use index with the worst performance in the market, to make a sky is falling point. Not really fair. Since the DJT is made up of only 20 companies, which many had real money problems when gas was over $100 for 3 years. They are still trying to dig themselves out of that hole. Oil didn't start falling until mid 2014.
But the real indexes like the NAZ, S&P, & DOW industrials all are around 10 to 12% down. Correction mode.
Definitely not arguing that prolonged low oil and low fed rates shouldn't play havoc on stock prices, if they don't unwind just right. But todays market is run on computers with high freq trading now. Thus supply & demand often becomes artificially distorted by computer programs & international money management monopolies.
I mean the 2008 crash came from banks manipulating money. And oil was $100 to $130 from 2011 to mid 2014. That's 3 1/2 years. So what drastic change in supply demand occurred in the world the last 1 1/2 years to cause $30 a barrel? Everyone stop driving or switched to green energy. Did the Arab's, Russian's, US, & South Americans stop drilling? Supply & Demand, the basis for all the economic theory of the 1930's and 40's, & 50's has gone down the tube. Along with the old logic of a supply/demand market operation. Logic and standard economic realities don't seem to matter squat.
It's been my theory that now days (actually since the 1980's computer revolution) markets crash because people want them to. Not because supply vs demand is too imbalanced.
The word "market bubble" or economic bubble wasn't used until after the 1980's. Before then, bubbles were individually relative. Relating to a product or physical area. The Roaring Twenties stock-market bubble was the last 19th century all inclusive bubble until the Dotcom bubble in the 1990"s. Since computers took volume from null to billions along with unsustainable price climbs.
Check out these charts. http://stockcharts.com/freecharts/historical/marketindexes.html
IMO the proof computers and their operators now have complete control over market price. Not supply demand or excess monetary expansion which happened in the late 60's, early 70's. But going off the gold standard had something to do with that one.
You just can't expect the 3 groups of economics to actually move markets like before as much as follow the market now. Be it positive/normative, applied/rational, behavioral /mainstream economic camp. There has always been a battle between What should be and What really is. I'm in the what really is camp.
At any rate everyone that reads this should check out the chart link above and see how modern advances it technology has effected market operation. How bubbles and corrections have taken over the masses to produce a newly coined "greater fool theory" touted by behavioral economist.
Ps; NOTE: those charts are in LOG SCALE. If there was room on 1 chart for correct NO LOG; the graph would look 10 times more troubling.
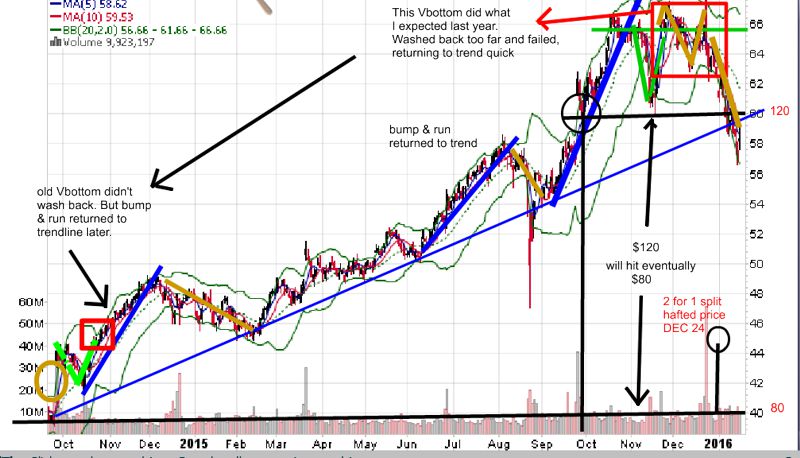
I was checking some of my old videos and found one very involved which covers a lot of stuff. Never got posted to my youtube site, so here it is. Was done Nov 2014 so I checked todays chart to see what happened. A new up to date chart is at the bottom of this page.
For some reason I can't correct, it starts about 3 minutes in and may be low res. So if this happens you'll need to start at the beginning and up the resolution. Takes about 1/2 an hour, but LOTS of short, mid, long, and investment info there! Oh yea FORD did nothing and NKE did everything I didn't think it would. Short term kept running, mid term never filled the gap and no one thought it was to expensive and bailed out. That's a great example of predicting. The turning point reached projection, but not how I predicted. Projection are always best. prediction no so much. LOL
The rubber band effect says it all, when it comes to a S&P corrections. See chart links in last post.
That Rule of thumb is golden when it comes to expecting market reversals after parabolic moves up or down.
Using that charts SMA envelope settings should be in every traders book of must check.
Actually I decided to take my 25% profit @ FAZ today. While the getting is good. I'm that confident that I feel 1880 will not be broken in a strong way. Broke my trade plan to hold till 1st resistance was broken @ 1850 on a reversal.
NOT THE BEST WAY FOR A RULES BASED TRADER TO START A NEW YEAE. (Break a rule) BUT HEY, IT'S MONEY IN THE BANK AND THAT'S GOOD. So I guess it balances.
Today's gap open should get filled. Probably quickly before any real S%P reversal. But it's going to reverse this week sometime. The volume has been relatively steady since the 5 day dive, the first of the new year, to the 8th, and my short term TA indicators are closing on positive from negative. If the market was going to continue south, the down side volumes would reflect large increases. Another thing that adds to my confidence is the price cross of the 6% & 8% SMA lines.
I call this the rubber band effect. Which I've posted about many times. The Rule of thumb is; when the S&P reaches a 6% deviation from the 50 day SMA; a reversal back to at least the 50 day again should occur. If it reaches the 8% line a reversal well occur. You can see this holding true in the charts below.
5yr
http://stockcharts.com/h-sc/ui?s=%24SPX&p=D&yr=5&mn=0&dy=0&id=p46974766894
1yr
http://stockcharts.com/h-sc/ui?s=%24SPX&p=D&yr=1&mn=0&dy=0&id=p75995198849
At any rate closing my FAZ hold from $42 has been berry berry good to me. LOL A great start at reaching my 2016 trading business plan. Had 50% of my portfolio in FAZ.
The news is all smoke & mirrors. The facts are the company has $23k in total assets. And that's cash. All it does is sell stock for funding. And spends it on salaries, travel, advertising, and expenses. Per the Q report.
Rule of thumb for any OTC company news releases is; if they PR about multi million funding being available, just STOP believing any thing you read!
Actually one should ALWAYS read the Q reports financials and see if they have more cash then you do. Or at least as much as a wealthy friend. $23k cash and no physical assets won't get a multi million dollar loan/ funding from anywhere in the world I live In.
My thought's on DNRG; not worth the time it took to post this.
SORRY
My old friend; here we are again; the market has a correction and the world is ending. I'll hold my switch from bull to bear until I see it happen. Meaning S&P 1880 breaking down completely.
10% market corrections are normal. The last time the market really became a bear market was 2002 & 2008. That's since it became a freely traded computer market and retail unsustainable climbs started . Who knows, maybe 6 years will happen for the third time in 2016 and a new market pattern will begin. But the catalyst your posting about the past year or so doesn't seem to have effected the market more then just corrections so far and the interest rate has been null since the 2008 crash. One would think if that would cause the sky to fall, it would have by now.
Once again I say we'll see. But I'll hold off on switching from the bull to bear camp till it happens, as always.
One thing I'd like to comment on, in your post is your long hold portfolio. May I suggest including some REITs, if you don't have any. It seemed your attitude is hold blue chips and eventually they will come back and give you a good retirement. Well a few 10 to 15% REIT's will produce income while waiting. The lower a divvy stock price goes, the higher your ROI is. And those funds are realized while the market falls, and your waiting.
Example: I hold NYMT and my basis is producing well over 15% now. The price loss is about 15% before this resent correction, but I get 15% each year and won't sell until the market price climbs to a profit area. (if ever) REITs will feed me, while I wait. With out large divvy stocks in my long portfolio I'd just be waiting. See the point!
Some say REIT companies will lower their divvy during bad business return days. And that's normally correct. But lowering a return from 15% to say 10% After 3Q's of lowering dividends in steps will always be better then what .5% CD's give or long stocks portfolios in dive status provide, in bad markets. My price gain paper loss may event get larger then my divvy return. But if it's a hold what matters is what I get, not what the size of a paper loss. Especially when you hold long, you hold long.
When one thinks long, think REITs IMO.
As for this correction to 1880 as I expected. My swing position in FAZ is a great play right now. Today's stall candle was a very strong candle with nice volume. If a bounce follows and this is a correction, not crash. I'll be selling @ 1850 after 1st resistance is broken. If there is NO bounce, my gain will continue to increase.
FAS/FAZ is a great way to play bad markets or fluxing markets. And no need to short using a margin account. I love FAS/FAZ.
WOW
My free membership ran out, when I came back. And some old friend (?) Just gifted me a free member gift again.
It's been over 10 years on IHUB and I refuse to pay to help readers. And I've not once had to suffer not being a member for every one of the 10 years. Thanks to all who have subsidized my babble and bull chit over the years !
Thanks to my present gifter. I can now answer private questions and use search, which I use often when posting.
When I last posted, I posted less and less about Pennyland, because the old wild west change so much. I focused on big board processes and TA & charting, more then the darkside of penny trading.
While I stopped posting, I just settled back in my personal groove and traded my trading business plan. If a lot of OTC questions start coming again. I will spend some time researching what's been happening in pennyland again. If not, expect most of the subjects covered to be about the bug boards ^ TA & charting again.
I do promote any and all traders to leave pennyland and move to the national exchanges as soon as finances allow. Also will mention I don't plan on being as active as I have been in the past, this time. But as always, will respond to ALL questions asked !!
For those new to the board, my mantra is and will NEVER change:
Keep things basic, simple, & clean.
It's all in the numbers.
And plan each and every trade before entry and trade that plan !
I'm open for business and will try to check the LOWTRADE board every so often.
papaphilip
Just took the time to check out your stock and my comment would be SELL ASAP.
What is causing the unbelievable price spike doesn't really matter. We trade to make money and if you can unload what ever you have at these prices you did that. Looking at a 2 yr chart, you can't hold it for over 1 cent.
The only problem may be the low daily volumes. So you should dump in stages (offering below bid sells will cause your stock to sell first in the queue line).
Try to keep your sell size within reasonable proportion to the total daily volumes or you may drive the price lower. The rule of thumb for this effect is one should not trade more the 10% of the daily volume. But in your case, with the volumes around 300k and you holding a few thousand you may try 50% first to 25% or 150k to 75k a day and see if the price comes down. If not raise the amount offered each day and see how it holds.
Now a little about reasons this may be happening. You think it's because of a possible reverse merger. As I said it really doesn't matter, but IMO this is happening because someone wants to hold a controlling interest in the company stock. So they are buying up (SLOWLY) in the hope to keep the run from continuing.
EXAMPLE: They are buying all the daily volume. In the beginning. You can see the million share days stopped quick, when they notice how many old bag holders started dumping out. So they started only buying a few hundred k a day.
Their problem is the word got out and everyone was trying to sell causing the buy price to continue to raise.
Your problem is you have to dump without causing the reverse. This may be a battle of patience. They want to own controlling interest and you want to sell to them, but they want it as cheap as possible and you want it as expensive as possible.
At Any rate; this process could take some time, as long as they don't have a time deadline to worry about. If they do, say own control by next month, you should do OK. If there is no dead line you may be selling drips and drabs for months.
Good luck.
From what's happening at the market; Q4 2014 to Q2 2015 Matching Q4 2015 to Q2 2016 until the last week, it seems S&P 1880 will be tested. Instead of a market break up like last year.
Personally only been in Divvy plays & FAS/FAZ since mid NOV. Presently hold a core position there (FAZ) and swing the FAS/FAZ swings with 50% of portfolio. As I do feel 1880 will be tested in the 1st Q.
I have no plans on stock picking till after Q1 and I see if S&P 1880 holds. If it doesn't hold my FAZ core position will be more valuable the today. But plan on dumping as soon as I see a 1880 bounce break first resistance.
Does everyone have their 2016 trading business plan?
Happy 2016
JAMEYSTOCK my last gifted IHUB membership has run out. I can not longer answer PM's
Your 3 are hopeless IMO, as most all lightning strike pops on the OTC now days. I have not event looked at a pennyland stock for month & months. The OTC is not what it use to be and I see no logical reason anyone would bother unless they are day traders.
It seems now days pennyland is not the wild west, but the land of lightning strikes. Price surges which last from 1 day to 3 max. Then back to oblivion. No volume interest before and NO volume interest after. So one thing remains the same. Big money moves the price and emotion buys the move! Because the only way to move a stock is spending money to make money. And little guys don't have the money or skill to start a move out of the blue.
I checked 8 or 10 stocks on the hot board to see what I could and the only pattern I noticed was day trading is about the only way to make money at the OTC now. You don't buy the flashes you day trade the daily price swings on stocks which have steady volume interest.
In order to day trade pennyland, you need at least 100 mil average daily volume (not just 1 days volume) for a triple zero stock, 10 mil for a double and 1 mil for a single. I noticed stocks with this do have nice daily price swings which can produce trades for 10 to 50% worth trading during the day. You need an audience to be able to get both in & OUT in the same day. And normally your days trading will be done before lunch.
There are exceptions, but most action is between open and lunch with a smaller half the morning swing in the afternoon. Catch a stock that falls at open, expect a reversal some time between 10 & 11 am, buy it and sell before lunch.
Examples:
http://ih.advfn.com/stock-market/USOTC/hybrid-coating-tech-HCTI/stock-price
http://ih.advfn.com/stock-market/OTCBB/intelligent-highway-solutions-IHSI/stock-price
http://ih.advfn.com/stock-market/USOTC/medbox-inc-qb-MDBX/stock-price
http://ih.advfn.com/stock-market/USOTC/voip-pal-com-inc-pc-VPLM/stock-price
http://ih.advfn.com/stock-market/USOTC/eco-depot-inc-pl-ECDP/stock-price
Now how to pick a REIT. Or any long term investment stock for that matter.
Since the concern for long term investing in a divvy stock or REIT in particular, is maintaining the same or increasing payout. Performance is important!
Is the company growing and increasing EPS, Earnings per Share? If they fail to do this, they will need to reduce dividend payouts. Ps; to become a REIT the company must return 90% of earning to investors. So EPS can be the #1 factor to payout levels the board determine to give out. Others can be cash flow requirements, or new business investment directions. If the company has a large LT Debit/EQ or has recently had a public offering which increase the float. Cash flow needs maybe cause them to lower payout also.
Lets discuss some fundamentals to look at in choosing REIT.
LT Debit/Eq; this is the ratio of long term debt to the basic company value. How much is management borrowing to invest in growing the business.
The higher this number the higher the risk the company is taking.
REIT Examples: New York Investment Trust NYMT LT Debit/Eq is 10.8 and ARMOUR Residential REIT, Inc. AEE is 0. Obviously NYMT borrows much more then ARR to grow it's business. So NYMT's business risk level is very high. Many investment firms will consider this to high and not recommend it to clients or invest them selves. But is management putting the money to good use? Wants the ROE.
ROE is return on equity. Return on equity measures a corporation's profitability. Is management using it's money well. And one of the most important consideration to a successful company is managements ability.
REIT Example: NYMT ROE is 16.9 and ARR -1.9. Obviously NYMT has a much better record of producing profits then ARR.
Evaluation for the 2 extremes I choose is ARR takes little risk but management doesn't preform well. On the other hand NYMT take large risk but produces strong results.
Thus my choice would be bet on a strong management team which take higher risk. While many investment firms just hate risk. And would choose neither. And look for something in the middle of risk & performance.
Say CIM with a low LT Debit/Eq number and high ROE number (1.43 & 16) would look better to them.
Now we have NYMT & CIM lets look deeper. NYMT is a risk taker but both managements about the same. So lets see how their dividend return history is. We'll use the Growth Rate 5yr Avg since that's our timing. CIM's Dividend Growth Rate 5yr Avg: = -1.83% while NYMT's is +3.33%.
NYMT has increase payout, while CIM has reduced it. And 1 of the main thing we want is the dividend payout to remain the same and price to reduce as this increases our ROI.
NYMT is winning over CIM to this point.
Now on to expected future. I say do what the big guys do. They have teams of annalists evaluating companies much deeper then we could. And there are two fundaments which I gauge for this.
Instructional investment amount, short interest increase/decrease. Who has the most big money interest and who is loosing the most future interest. Looking for trend.
NYMT Instructional investment 29% CIM 59%; NYMT short interest increase/decrease NYMT -16% CIM +1%. This says big money likes CIM best, but they seem to be changing their minds. NYMT has reduced it's short interest, while CIM's has increase slightly.
Actual short interest is NYMT 10.9% (very negative) CIM 1.2% (positive). With NYMT having a 15% YTD price fall and CIM 7%. It seems big money feels safe with CIM and NYMT is reaching it's price direction decline bottom. Buying op's fading!
Eval: the future is unchanged for CIM with more big money there. And NYMT had problems which are ending.
CIM won the future area. Keeping in mind this area only help with expectations of profitability, seen in price direction and ownership levels. Not history of maintaining payout levels.
Wrap up; Both NYMT & CIM are good candidates for long term dividend investment. NYMT with a 16.5% divvy @ today price and CIM with 13.9. NYMT has a higher risk but better preforming management and a better over all history of maintaining the payout level. Big money likes CIM and expected a price decline at NYMT which has happened.
As I said NYMT just gave a huge buying op, $7.50 to $6.50, 14 to 17% payout. But CIM is still the long term favorite with big money and a good investment. Probably because money managers don't like risk! CIM was my favorite REIT several years ago. When some things ( late Q reports) changed, shifting me to NYMT.
Hope the info in the last 2 post helps present & future investors to understand long term investment techniques & reasoning.
Not a recommendation to buy either, educational only.
Traders, are there any Investor? Or those thinking about planning for the long term future.
I want to post about long term investing.
As my favorite divvy stock NYMT (a REIT) just gave a huge buying op. Actually most any REIT offering over 10% probably did. ARR, RSO, NYMT, CIM or PMT. These are the 5 top REIT's right now. This is not a recommendation to buy, it's an attempt to help understand long term investment opportunities of the REIT market.
So here the skinny. If one holds a 15% divvy stock for 5 years it doubles their money. $10k becomes $20k, $20k becomes $40k; ETC. as long as you re-invest dividends.
Not all dividend stock offer or are dividend re-investment stocks. Or DRIP's "dividend re investment program". So depending on the stock you choose, you may need to use your divvy return to manually buy more stock. But if the stock is a DRIP sign up and it's automatic.
Automatic can be cool if lazy but, you may increase your ROI by buying when you see a price fall on your own. This is personal. Either way you need to buy more before the next Ex-Dividend Date.
This may seem counter productive to a trader. Adding to a falling price or "averaging down" is one of the dumbest things a trader can do. It's like toughing good money after bad. If your looking for short term gain. As price decline in a traders stock means the company isn't doing well. But with a long term hold investment stock it lowers you basis and thus increases you ROI over the long haul. So with a divvy investment one likes price declines as long as the company continues to pay the same dividend.
Basis is the price you own the stock at. Say you own 1000 shares @ $7.50 and the yearly dividend is $1.00. You ROI is 13.3 percent. Now you buy 1000 shares @ a dip for $6.50. Now you own 2000 @ $7.00 basis. OR 14.3 percent. You just increase your ROI from 13.3 to 14.3. And because we don't care about price, we care about dividend return. This was a good move. You don't need to worry about price direction as much as keeping the divvy payout the same.
If you see the divvy start to reduce, this doesn't mean panic sell. But it does mean watch it! as loosing .5% or 1% isn't really that bad, when all other investments offer under 5%. Remember we're talking REIT's with over a 10% divvy.
One more thing about signing up for a DRIP dividend paying stock plan. They re-invest your dividend the day after the dividend payout usually. And with divvy stocks, the open price falls the same percentage as the payout, at the open of the next days market. SO, with a DRIP, you do get a small decrease in basis every payout re-investment. Be it quarterly or monthly payouts.
The over all theme to remember about long term investing, in REIT's is. 15% doubles you money in 5 years and re-investing dividends compounds gain. If you keep dividends in the account or live off them, the second 5 years will equal the first. But quad the second, if re-invested. Because you would hold twice the stock at the end of 5 years. So the original $10k which became $20k, can become $40k account balance the second 5, not another $10k gain, but a $20k gain.
So if your goal is income, don't reinvest, spend dividends yearly, but if it's retirement, re-invest and gain the synergy of compounding. In 15 years $10k can become $80k maintaining a 15% divvy basis.
Buy the way my divvy stock NYMT has also just given an outstanding buying op! now 17%
http://dividendinvestor.com/historical.php?no=25222
http://stockcharts.com/h-sc/ui?s=NYMT&p=D&yr=0&mn=9&dy=0&id=p75878257290
Now I'll get on my Crazy Tin Foil Hat mode and mention how I feel a "new world order" is working hard to cause a world wide central banking center.
The talk is the FED is about to raise interest levels, because all US indicators are positive.
If your one of us big guys cause market panic people. Guess what; This kind of put a big wrench in the FED moving soon!!!!
They just got what they wanted. World wide fear of financial markets falling apart again. I can't see any central bank loosening up now. Big money will continue to get money for nothing and their checks for free.
Bold shock & awe, IMO the New World Order just acted when the correct global news arrived to take advantage. China is slowing, Europe stalled, US weakly recovering. Is not worth this correction. Plus the 10yr crashed and decreasing mortgage rates will also keep the FED from moving.
The initial selling was not from money manager, institutions, or retail. Those people have hedges to help them from the need to act so fast. This was shock & awe, with high freq algo's driving behind.
An 11% 3 day correction. wow
I've got to continue about today's market action.
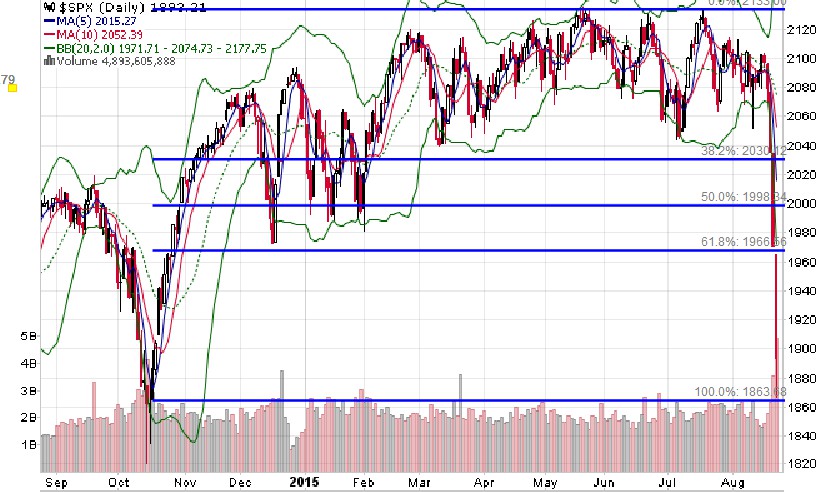
First remember ALL my posts about using the FIBS to judge support. Well there is only 1 thing which can cause a sell off like this! It's algo's from high freq trading COMPUTERS. What happens is once retail starts selling, the computers lock on and start selling in front of direction. This is why the indexes had an open flash crash. And the FIBs support levels failed to hold logic as they should, both Friday & today.
The US economy did NOT deserve the last 2 day market action. Is this over, Not as long as we still allow High freq trading. Which causes all this bull chit.
Circuit breakers tripped all over the market today. Both on the down side and up side. The big boards has become the wild west the OTC use to be. Only things happen much faster with todays computer trading houses.
Look at this chart. Over 10 years trading and other then the flash crash day, support levels have never been broken so far so fast before.
Yea I haven't been teaching lately, because no OTC addicts asking questions with the down fall of the manipulation that was.
If anyone is interested in learning TA & Charting for grownups, I'd still be happy to answer questions.
It's rare if a out of the blue non traded lightning strike stock run will last more then 3 days. Recommend keeping your finger on the take profit trigger tomorrow.
Looks like you got what you were waiting for. Market down; VIX up.
Luckily I exited My last 2 stocks last Wednesday. Rite Aid (RAD) @ 8.80 & Cott Corporation (COT) @ 10.05. Both for nice gains.
Panic selling always presents opportunities. Stay away from (celeb) stocks and research mid cap divers with dividends.
Matter of fact, watching 1 I just sold, isn't a bad idea. COT

