 News
News  Market Data
  Discover
Support: 888-992-3836
Copyright © 2023 InvestorsHub Inc.


rayrohn
![]()
Register for free to join our community of investors and share your ideas. You will also get access to streaming quotes, interactive charts, trades, portfolio, live options flow and more tools.
Register for free to join our community of investors and share your ideas. You will also get access to streaming quotes, interactive charts, trades, portfolio, live options flow and more tools.
W@G2 09/05/12 for a 09/07/12 close
66.50 rayrohn
W@G1 09/04/12 for a 09/05/12 close
68.31 Kookiekook
67.50 rayrohn
Remarks by Governor Ben S. Bernanke
At the H. Parker Willis Lecture in Economic Policy, Washington and Lee University, Lexington, Virginia
March 2, 2004
Money, Gold, and the Great Depression
I am pleased to be able to present the H. Parker Willis Lecture in Economic Policy here at Washington and Lee University. As you may know, Willis was an important figure in the early history of my current employer, the Federal Reserve System. While he was a professor at Washington and Lee, Willis advised Senator Carter Glass of Virginia, one of the key legislators involved in the founding of the Federal Reserve. Willis also served on the National Monetary Commission, which recommended the creation of the Federal Reserve, and he went on to become the research director at the Federal Reserve from 1918 to 1922. At the Federal Reserve, Willis pushed for the development of new and better economic statistics, facing the resistance of those who took the view that too many facts only confuse the issue. Willis was also the first editor of the Federal Reserve Bulletin, the official publication of the Fed, which in Willis's time as well as today provides a wealth of economic statistics. As an illustration of the intellectual atmosphere in Washington at the time he served, Willis reported that when the first copy of the Bulletin was presented to the Secretary of the Treasury, the esteemed Secretary replied, "This Government ain't going into the newspaper business."
Like Parker Willis, I was a professor myself before coming to the Federal Reserve Board. One topic of particular interest to me as a researcher was the performance of the Federal Reserve in its early days, particularly the part played by the young U.S. central bank in the Great Depression of the 1930s.1 In honor of Willis's important contribution to the design and creation of the Federal Reserve, I will speak today about the role of the Federal Reserve and of monetary factors more generally in the origin and propagation of the Great Depression. Let me offer two caveats before I begin: First, as I mentioned, H. Parker Willis resigned from the Fed in 1922, to take a post at Columbia University; thus, he is not implicated in any of the mistakes that the Federal Reserve made in the late 1920s and early 1930s. Second, the views I will express today are my own and are not necessarily those of my colleagues in the Federal Reserve System.
The number of people with personal memory of the Great Depression is fast shrinking with the years, and to most of us the Depression is conveyed by grainy, black-and-white images of men in hats and long coats standing in bread lines. However, although the Depression was long ago--October this year will mark the seventy-fifth anniversary of the famous 1929 stock market crash--its influence is still very much with us. In particular, the experience of the Depression helped forge a consensus that the government bears the important responsibility of trying to stabilize the economy and the financial system, as well as of assisting people affected by economic downturns. Dozens of our most important government agencies and programs, ranging from social security (to assist the elderly and disabled) to federal deposit insurance (to eliminate banking panics) to the Securities and Exchange Commission (to regulate financial activities) were created in the 1930s, each a legacy of the Depression.
The impact that the experience of the Depression has had on views about the role of the government in the economy is easily understood when we recall the sheer magnitude of that economic downturn. During the major contraction phase of the Depression, between 1929 and 1933, real output in the United States fell nearly 30 percent. During the same period, according to retrospective studies, the unemployment rate rose from about 3 percent to nearly 25 percent, and many of those lucky enough to have a job were able to work only part-time. For comparison, between 1973 and 1975, in what was perhaps the most severe U.S. recession of the World War II era, real output fell 3.4 percent and the unemployment rate rose from about 4 percent to about 9 percent. Other features of the 1929-33 decline included a sharp deflation--prices fell at a rate of nearly 10 percent per year during the early 1930s--as well as a plummeting stock market, widespread bank failures, and a rash of defaults and bankruptcies by businesses and households. The economy improved after Franklin D. Roosevelt's inauguration in March 1933, but unemployment remained in the double digits for the rest of the decade, full recovery arriving only with the advent of World War II. Moreover, as I will discuss later, the Depression was international in scope, affecting most countries around the world not only the United States.
What caused the Depression? This question is a difficult one, but answering it is important if we are to draw the right lessons from the experience for economic policy. Solving the puzzle of the Depression is also crucial to the field of economics itself because of the light the solution would shed on our basic understanding of how the economy works.
During the Depression years and for many decades afterward, economists disagreed sharply on the sources of the economic and financial collapse of the 1930s. In contrast, during the past twenty years or so economic historians have come to a broad consensus about the causes of the Depression. A widening of the geographic focus of Depression research deserves much of the credit for this breakthrough. Before the 1980s, research on the causes of the Depression had considered primarily the experience of the United States. This attention to the U.S. case was appropriate to some degree, as the U.S. economy was then, as it is today, the world's largest; the decline in output and employment in the United States during the 1930s was especially severe; and many economists have argued that, to an important extent, the worldwide Depression began in the United States, spreading from here to other countries (Romer, 1993). However, in much the same way that a medical researcher cannot reliably infer the causes of an illness by studying one patient, diagnosing the causes of the Depression is easier when we have more patients (in this case, more national economies) to study. To explain the current consensus on the causes of the Depression, I will first describe the debate as it existed before 1980, and then discuss how the recent focus on international aspects of the Depression and the comparative analysis of the experiences of different countries have helped to resolve that debate.
I have already mentioned the sharp deflation of the price level that occurred during the contraction phase of the Depression, by far the most severe episode of deflation experienced in the United States before or since. Deflation, like inflation, tends to be closely linked to changes in the national money supply, defined as the sum of currency and bank deposits outstanding, and such was the case in the Depression. Like real output and prices, the U.S. money supply fell about one-third between 1929 and 1933, rising in subsequent years as output and prices rose.
While the fact that money, prices, and output all declined rapidly in the early years of the Depression is undeniable, the interpretation of that fact has been the subject of much controversy. Indeed, historically, much of the debate on the causes of the Great Depression has centered on the role of monetary factors, including both monetary policy and other influences on the national money supply, such as the condition of the banking system. Views have changed over time. During the Depression itself, and in several decades following, most economists argued that monetary factors were not an important cause of the Depression. For example, many observers pointed to the fact that nominal interest rates were close to zero during much of the Depression, concluding that monetary policy had been about as easy as possible yet had produced no tangible benefits to the economy. The attempt to use monetary policy to extricate an economy from a deep depression was often compared to "pushing on a string."
During the first decades after the Depression, most economists looked to developments on the real side of the economy for explanations, rather than to monetary factors. Some argued, for example, that overinvestment and overbuilding had taken place during the ebullient 1920s, leading to a crash when the returns on those investments proved to be less than expected. Another once-popular theory was that a chronic problem of "under-consumption"--the inability of households to purchase enough goods and services to utilize the economy's productive capacity--had precipitated the slump.
However, in 1963, Milton Friedman and Anna J. Schwartz transformed the debate about the Great Depression. That year saw the publication of their now-classic book, A Monetary History of the United States, 1867-1960. The Monetary History, the name by which the book is instantly recognized by any macroeconomist, examined in great detail the relationship between changes in the national money stock--whether determined by conscious policy or by more impersonal forces such as changes in the banking system--and changes in national income and prices. The broader objective of the book was to understand how monetary forces had influenced the U.S. economy over a nearly a century. In the process of pursuing this general objective, however, Friedman and Schwartz offered important new evidence and arguments about the role of monetary factors in the Great Depression. In contradiction to the prevalent view of the time, that money and monetary policy played at most a purely passive role in the Depression, Friedman and Schwartz argued that "the [economic] contraction is in fact a tragic testimonial to the importance of monetary forces" (Friedman and Schwartz, 1963, p. 300).
To support their view that monetary forces caused the Great Depression, Friedman and Schwartz revisited the historical record and identified a series of errors--errors of both commission and omission--made by the Federal Reserve in the late 1920s and early 1930s. According to Friedman and Schwartz, each of these policy mistakes led to an undesirable tightening of monetary policy, as reflected in sharp declines in the money supply. Drawing on their historical evidence about the effects of money on the economy, Friedman and Schwartz argued that the declines in the money stock generated by Fed actions--or inactions--could account for the drops in prices and output that subsequently occurred.2
Friedman and Schwartz emphasized at least four major errors by U.S. monetary policymakers. The Fed's first grave mistake, in their view, was the tightening of monetary policy that began in the spring of 1928 and continued until the stock market crash of October 1929 (see Hamilton, 1987, or Bernanke, 2002a, for further discussion). This tightening of monetary policy in 1928 did not seem particularly justified by the macroeconomic environment: The economy was only just emerging from a recession, commodity prices were declining sharply, and there was little hint of inflation. Why then did the Federal Reserve raise interest rates in 1928? The principal reason was the Fed's ongoing concern about speculation on Wall Street. Fed policymakers drew a sharp distinction between "productive" (that is, good) and "speculative" (bad) uses of credit, and they were concerned that bank lending to brokers and investors was fueling a speculative wave in the stock market. When the Fed's attempts to persuade banks not to lend for speculative purposes proved ineffective, Fed officials decided to dissuade lending directly by raising the policy interest rate.
The market crash of October 1929 showed, if anyone doubted it, that a concerted effort by the Fed can bring down stock prices. But the cost of this "victory" was very high. According to Friedman and Schwartz, the Fed's tight-money policies led to the onset of a recession in August 1929, according to the official dating by the National Bureau of Economic Research. The slowdown in economic activity, together with high interest rates, was in all likelihood the most important source of the stock market crash that followed in October. In other words, the market crash, rather than being the cause of the Depression, as popular legend has it, was in fact largely the result of an economic slowdown and the inappropriate monetary policies that preceded it. Of course, the stock market crash only worsened the economic situation, hurting consumer and business confidence and contributing to a still deeper downturn in 1930.
The second monetary policy action identified by Friedman and Schwartz occurred in September and October of 1931. At the time, as I will discuss in more detail later, the United States and the great majority of other nations were on the gold standard, a system in which the value of each currency is expressed in terms of ounces of gold. Under the gold standard, central banks stood ready to maintain the fixed values of their currencies by offering to trade gold for money at the legally determined rate of exchange.
The fact that, under the gold standard, the value of each currency was fixed in terms of gold implied that the rate of exchange between any two currencies within the gold standard system was likewise fixed. As with any system of fixed exchange rates, the gold standard was subject to speculative attack if investors doubted the ability of a country to maintain the value of its currency at the legally specified parity. In September 1931, following a period of financial upheaval in Europe that created concerns about British investments on the Continent, speculators attacked the British pound, presenting pounds to the Bank of England and demanding gold in return. Faced with the heavy demands of speculators for gold and a widespread loss of confidence in the pound, the Bank of England quickly depleted its gold reserves. Unable to continue supporting the pound at its official value, Great Britain was forced to leave the gold standard, allowing the pound to float freely, its value determined by market forces.
With the collapse of the pound, speculators turned their attention to the U.S. dollar, which (given the economic difficulties the United States was experiencing in the fall of 1931) looked to many to be the next currency in line for devaluation. Central banks as well as private investors converted a substantial quantity of dollar assets to gold in September and October of 1931, reducing the Federal Reserve's gold reserves. The speculative attack on the dollar also helped to create a panic in the U.S. banking system. Fearing imminent devaluation of the dollar, many foreign and domestic depositors withdrew their funds from U.S. banks in order to convert them into gold or other assets. The worsening economic situation also made depositors increasingly distrustful of banks as a place to keep their savings. During this period, deposit insurance was virtually nonexistent, so that the failure of a bank might cause depositors to lose all or most of their savings. Thus, depositors who feared that a bank might fail rushed to withdraw their funds. Banking panics, if severe enough, could become self-confirming prophecies. During the 1930s, thousands of U.S. banks experienced runs by depositors and subsequently failed.
Long-established central banking practice required that the Fed respond both to the speculative attack on the dollar and to the domestic banking panics. However, the Fed decided to ignore the plight of the banking system and to focus only on stopping the loss of gold reserves to protect the dollar. To stabilize the dollar, the Fed once again raised interest rates sharply, on the view that currency speculators would be less willing to liquidate dollar assets if they could earn a higher rate of return on them. The Fed's strategy worked, in that the attack on the dollar subsided and the U.S. commitment to the gold standard was successfully defended, at least for the moment. However, once again the Fed had chosen to tighten monetary policy despite the fact that macroeconomic conditions--including an accelerating decline in output, prices, and the money supply--seemed to demand policy ease.
The third policy action highlighted by Friedman and Schwartz occurred in 1932. By the spring of that year, the Depression was well advanced, and Congress began to place considerable pressure on the Federal Reserve to ease monetary policy. The Board was quite reluctant to comply, but in response to the ongoing pressure the Board conducted open-market operations between April and June of 1932 designed to increase the national money supply and thus ease policy. These policy actions reduced interest rates on government bonds and corporate debt and appeared to arrest the decline in prices and economic activity. However, Fed officials remained ambivalent about their policy of monetary expansion. Some viewed the Depression as the necessary purging of financial excesses built up during the 1920s; in this view, slowing the economic collapse by easing monetary policy only delayed the inevitable adjustment. Other officials, noting among other indicators the very low level of nominal interest rates, concluded that monetary policy was in fact already quite easy and that no more should be done. These policymakers did not appear to appreciate that, even though nominal interest rates were very low, the ongoing deflation meant that the real cost of borrowing was very high because any loans would have to be repaid in dollars of much greater value (Meltzer, 2003). Thus monetary policy was not in fact easy at all, despite the very low level of nominal interest rates. In any event, Fed officials convinced themselves that the policy ease advocated by the Congress was not appropriate, and so when the Congress adjourned in July 1932, the Fed reversed the policy. By the latter part of the year, the economy had relapsed dramatically.
The fourth and final policy mistake emphasized by Friedman and Schwartz was the Fed's ongoing neglect of problems in the U.S. banking sector. As I have already described, the banking sector faced enormous pressure during the early 1930s. As depositor fears about the health of banks grew, runs on banks became increasingly common. A series of banking panics spread across the country, often affecting all the banks in a major city or even an entire region of the country. Between December 1930 and March 1933, when President Roosevelt declared a "banking holiday" that shut down the entire U.S. banking system, about half of U.S. banks either closed or merged with other banks. Surviving banks, rather than expanding their deposits and loans to replace those of the banks lost to panics, retrenched sharply.
The banking crisis had highly detrimental effects on the broader economy. Friedman and Schwartz emphasized the effects of bank failures on the money supply. Because bank deposits are a form of money, the closing of many banks greatly exacerbated the decline in the money supply. Moreover, afraid to leave their funds in banks, people hoarded cash, for example by burying their savings in coffee cans in the back yard. Hoarding effectively removed money from circulation, adding further to the deflationary pressures. Moreover, as I emphasized in early research of my own (Bernanke, 1983), the virtual shutting down of the U.S. banking system also deprived the economy of an important source of credit and other services normally provided by banks.
The Federal Reserve had the power at least to ameliorate the problems of the banks. For example, the Fed could have been more aggressive in lending cash to banks (taking their loans and other investments as collateral), or it could have simply put more cash in circulation. Either action would have made it easier for banks to obtain the cash necessary to pay off depositors, which might have stopped bank runs before they resulted in bank closings and failures. Indeed, a central element of the Federal Reserve's original mission had been to provide just this type of assistance to the banking system. The Fed's failure to fulfill its mission was, again, largely the result of the economic theories held by the Federal Reserve leadership. Many Fed officials appeared to subscribe to the infamous "liquidationist" thesis of Treasury Secretary Andrew Mellon, who argued that weeding out "weak" banks was a harsh but necessary prerequisite to the recovery of the banking system. Moreover, most of the failing banks were relatively small and not members of the Federal Reserve System, making their fate of less interest to the policymakers. In the end, Fed officials decided not to intervene in the banking crisis, contributing once again to the precipitous fall in the money supply.
Friedman and Schwartz discuss other episodes and policy actions as well, such as the Federal Reserve's misguided tightening of policy in 1937-38 which contributed to a new recession in those years. However, the four episodes I have described capture the gist of the Friedman and Schwartz argument that, for a variety of reasons, monetary policy was unnecessarily tight, both before the Depression began and during its most dramatic downward phase. As I have mentioned, Friedman and Schwartz had produced evidence from other historical periods that suggested that contractionary monetary policies can lead to declining prices and output. Friedman and Schwartz concluded therefore that they had found the smoking gun, evidence that much of the severity of the Great Depression could be attributed to monetary forces.
Friedman and Schwartz's arguments were highly influential but not universally accepted. For several decades after the Monetary History was published, a debate raged about the importance of monetary factors in the Depression. Opponents made several objections to the Friedman and Schwartz thesis that are worth highlighting here.
First, critics wondered whether the tightening of monetary policy during 1928 and 1929, though perhaps ill advised, was large enough to have led to such calamitous consequences.3 If the tightening of monetary policy before the stock market crash was not sufficient to account for the violence of the economic downturn, then other, possibly nonmonetary, factors may need to be considered as well.
A second question is whether the large decline in the money supply seen during the 1930s was primarily a cause or an effect of falling output and prices. As we have seen, Friedman and Schwartz argued that the decline in the money supply was causal. Suppose, though, for the sake of argument, that the Depression was the result primarily of nonmonetary factors, such as overspending and overinvestment during the 1920s. As incomes and spending decline, people need less money to carry out daily transactions. In this scenario, critics pointed out, the Fed would be justified in allowing the money supply to fall, because it would only be accommodating a decline in the amount of money that people want to hold. The decline in the money supply in this case would be a response to, not a cause of, the decline in output and prices. To put the question simply, we know that both the economy and the money stock contracted rapidly during the early 1930s, but was the monetary dog wagging the economic tail, or vice versa?
The focus of Friedman and Schwartz on the U.S. experience (by design, of course) raised other questions about their monetary explanation of the Depression. As I have mentioned, the Great Depression was a worldwide phenomenon, not confined to the United States. Indeed, some economies, such as that of Germany, began to decline before 1929. Although few countries escaped the Depression entirely, the severity of the episode varied widely across countries. The timing of recovery also varied considerably, with some countries beginning their recovery as early as 1931 or 1932, whereas others remained in the depths of depression as late as 1935 or 1936. How does Friedman and Schwartz's monetary thesis explain the worldwide nature of the onset of the Depression, and the differences in severity and timing observed in different countries?
That is where the debate stood around 1980. About that time, however, economic historians began to broaden their focus, shifting from a heavy emphasis on events in the United States during the 1930s to an increased attention to developments around the world. Moreover, rather than studying countries individually, this new scholarship took a comparative approach, asking specifically why some countries fared better than others in the 1930s. As I will explain, this research uncovered an important role for international monetary forces, as well as domestic monetary policies, in explaining the Depression. Specifically, the new research found that a complete understanding of the Depression requires attention to the operation of the international gold standard, the international monetary system of the time.4
As I have already mentioned, the gold standard is a monetary system in which each participating country defines its monetary unit in terms of a certain amount of gold. The setting of each currency's value in terms of gold defines a system of fixed exchange rates, in which the relative value of (say) the U.S. dollar and the British pound are fixed at a rate determined by the relative gold content of each currency. To maintain the gold standard, central banks had to promise to exchange actual gold for their paper currencies at the legal rate.
The gold standard appeared to be highly successful from about 1870 to the beginning of World War I in 1914. During the so-called "classical" gold standard period, international trade and capital flows expanded markedly, and central banks experienced relatively few problems ensuring that their currencies retained their legal value. The gold standard was suspended during World War I, however, because of disruptions to trade and international capital flows and because countries needed more financial flexibility to finance their war efforts. (The United States remained technically on the gold standard throughout the war, but with many restrictions.)
After 1918, when the war ended, nations around the world made extensive efforts to reconstitute the gold standard, believing that it would be a key element in the return to normal functioning of the international economic system. Great Britain was among the first of the major countries to return to the gold standard, in 1925, and by 1929 the great majority of the world's nations had done so.
Unlike the gold standard before World War I, however, the gold standard as reconstituted in the 1920s proved to be both unstable and destabilizing. Economic historians have identified a number of reasons why the reconstituted gold standard was so much less successful than its prewar counterpart. First, the war had left behind enormous economic destruction and dislocation. Major financial problems also remained, including both large government debts from the war and banking systems whose solvency had been deeply compromised by the war and by the periods of hyperinflation that followed in a number of countries. These underlying problems created stresses for the gold standard that had not existed to the same degree before the war.
Second, the new system lacked effective international leadership. During the classical period, the Bank of England, in operation since 1694, provided sophisticated management of the international system, with the cooperation of other major central banks. This leadership helped the system adjust to imbalances and strains; for example, a consortium of central banks might lend gold to one of their number that was experiencing a shortage of reserves. After the war, with Great Britain economically and financially depleted and the United States in ascendance, leadership of the international system shifted by default to the Federal Reserve. Unfortunately, the fledgling Federal Reserve, with its decentralized structure and its inexperienced and domestically focused leadership, did not prove up to the task of managing the international gold standard, a task that lingering hatreds and disputes from the war would have made difficult for even the most-sophisticated institution. With the lack of effective international leadership, most central banks of the 1920s and 1930s devoted little effort to supporting the overall stability of the international system and focused instead on conditions within their own countries.
Finally, the reconstituted gold standard lacked the credibility of its prewar counterpart. Before the war, the ideology of the gold standard was dominant, to the point that financial investors had no doubt that central banks would find a way to maintain the gold values of their currencies no matter what the circumstances. Because this conviction was so firm, speculators had little incentive to attack a major currency. After the war, in contrast, both economic views and the political balance of power had shifted in ways that reduced the influence of the gold standard ideology. For example, new labor-dominated political parties were skeptical about the utility of maintaining the gold standard if doing so increased unemployment. Ironically, reduced political and ideological support for the gold standard made it more difficult for central banks to maintain the gold values of their currencies, as speculators understood that the underlying commitment to adhere to the gold standard at all costs had been weakened significantly. Thus, speculative attacks became much more likely to succeed and hence more likely to occur.
With an international focus, and with particular attention to the role of the gold standard in the world economy, scholars have now been able to answer the questions regarding the monetary interpretation of the Depression that I raised earlier.
First, the existence of the gold standard helps to explain why the world economic decline was both deep and broadly international. Under the gold standard, the need to maintain a fixed exchange rate among currencies forces countries to adopt similar monetary policies. In particular, a central bank with limited gold reserves has no option but to raise its own interest rates when interest rates are being raised abroad; if it did not do so, it would quickly lose gold reserves as financial investors transferred their funds to countries where returns were higher. Hence, when the Federal Reserve raised interest rates in 1928 to fight stock market speculation, it inadvertently forced tightening of monetary policy in many other countries as well. This tightening abroad weakened the global economy, with effects that fed back to the U.S. economy and financial system.
Other countries' policies also contributed to a global monetary tightening during 1928 and 1929. For example, after France returned to the gold standard in 1928, it built up its gold reserves significantly, at the expense of other countries. The outflows of gold to France forced other countries to reduce their money supplies and to raise interest rates. Speculative attacks on currencies also became frequent as the Depression worsened, leading central banks to raise interest rates, much like the Federal Reserve did in 1931. Leadership from the Federal Reserve might possibly have produced better international cooperation and a more appropriate set of monetary policies. However, in the absence of that leadership, the worldwide monetary contraction proceeded apace. The result was a global economic decline that reinforced the effects of tight monetary policies in individual countries.
The transmission of monetary tightening through the gold standard also addresses the question of whether changes in the money supply helped cause the Depression or were simply a passive response to the declines in income and prices. Countries on the gold standard were often forced to contract their money supplies because of policy developments in other countries, not because of domestic events. The fact that these contractions in money supplies were invariably followed by declines in output and prices suggests that money was more a cause than an effect of the economic collapse in those countries.
Perhaps the most fascinating discovery arising from researchers' broader international focus is that the extent to which a country adhered to the gold standard and the severity of its depression were closely linked. In particular, the longer that a country remained committed to gold, the deeper its depression and the later its recovery (Choudhri and Kochin, 1980; Eichengreen and Sachs, 1985).
The willingness or ability of countries to remain on the gold standard despite the adverse developments of the 1930s varied quite a bit. A few countries did not join the gold standard system at all; these included Spain (which was embroiled in domestic political upheaval, eventually leading to civil war) and China (which used a silver monetary standard rather than a gold standard). A number of countries adopted the gold standard in the 1920s but left or were forced off gold relatively early, typically in 1931. Countries in this category included Great Britain, Japan, and several Scandinavian countries. Some countries, such as Italy and the United States, remained on the gold standard into 1932 or 1933. And a few diehards, notably the so-called gold bloc, led by France and including Poland, Belgium, and Switzerland, remained on gold into 1935 or 1936.
If declines in the money supply induced by adherence to the gold standard were a principal reason for economic depression, then countries leaving gold earlier should have been able to avoid the worst of the Depression and begin an earlier process of recovery. The evidence strongly supports this implication. For example, Great Britain and Scandinavia, which left the gold standard in 1931, recovered much earlier than France and Belgium, which stubbornly remained on gold. As Friedman and Schwartz noted in their book, countries such as China--which used a silver standard rather than a gold standard--avoided the Depression almost entirely. The finding that the time at which a country left the gold standard is the key determinant of the severity of its depression and the timing of its recovery has been shown to hold for literally dozens of countries, including developing countries. This intriguing result not only provides additional evidence for the importance of monetary factors in the Depression, it also explains why the timing of recovery from the Depression differed across countries.
The finding that leaving the gold standard was the key to recovery from the Great Depression was certainly confirmed by the U.S. experience. One of the first actions of President Roosevelt was to eliminate the constraint on U.S. monetary policy created by the gold standard, first by allowing the dollar to float and then by resetting its value at a significantly lower level. The new President also addressed another major source of monetary contraction, the ongoing banking crisis. Within days of his inauguration, Roosevelt declared a "bank holiday," shutting down all the banks in the country. Banks were allowed to reopen only when certified to be in sound financial condition. Roosevelt pursued other measures to stabilize the banking system as well, such as the creation of a deposit insurance program. With the gold standard constraint removed and the banking system stabilized, the money supply and the price level began to rise. Between Roosevelt's coming to power in 1933 and the recession of 1937-38, the economy grew strongly.
I have only scratched the surface of the fascinating literature on the causes of the Great Depression, but it is time that I conclude. Economists have made a great deal of progress in understanding the Great Depression. Milton Friedman and Anna Schwartz deserve enormous credit for bringing the role of monetary factors to the fore in their Monetary History. However, expanding the research focus to include the experiences of a wide range of countries has both provided additional support for the role of monetary factors (including the international gold standard) and enriched our understanding of the causes of the Depression.
Some important lessons emerge from the story. One lesson is that ideas are critical. The gold standard orthodoxy, the adherence of some Federal Reserve policymakers to the liquidationist thesis, and the incorrect view that low nominal interest rates necessarily signaled monetary ease, all led policymakers astray, with disastrous consequences. We should not underestimate the need for careful research and analysis in guiding policy. Another lesson is that central banks and other governmental agencies have an important responsibility to maintain financial stability. The banking crises of the 1930s, both in the United States and abroad, were a significant source of output declines, both through their effects on money supplies and on credit supplies. Finally, perhaps the most important lesson of all is that price stability should be a key objective of monetary policy. By allowing persistent declines in the money supply and in the price level, the Federal Reserve of the late 1920s and 1930s greatly destabilized the U.S. economy and, through the workings of the gold standard, the economies of many other nations as well.
REFERENCES
Bernanke, Ben (1983). "Nonmonetary Effects of the Financial Crisis in the Propagation of the Great Depression," American Economic Review, 73, (June) pp. 257-76.
Bernanke, Ben (2000). Essays on the Great Depression. Princeton, N. J.: Princeton University Press.
Bernanke, Ben (2002a). "Asset-Price 'Bubbles' and Monetary Policy," before the New York chapter of the National Association for Business Economics, New York, New York, October 15. Available at www.federalreserve.gov.
Bernanke, Ben (2002b). "On Milton Friedman's Ninetieth Birthday," at the Conference to Honor Milton Friedman, University of Chicago, Chicago, Illinois, November 8. Available at www.federalreserve.gov.
Choudhri, Ehsan, and Levis Kochin (1980). "The Exchange Rate and the International Transmission of Business Cycle Disturbances: Some Evidence from the Great Depression," Journal of Money, Credit, and Banking, 12, pp. 565-74.
Eichengreen, Barry (1992). Golden Fetters: The Gold Standard and the Great Depression, 1919-1939. Oxford: Oxford University Press.
Eichengreen, Barry (2002). "Still Fettered after All These Years," National Bureau of Economic Research working paper no. 9276 (October).
Eichengreen, Barry, and Jeffrey Sachs (1985). "Exchange Rates and Economic Recovery in the 1930s," Journal of Economic History, 45, pp. 925-46.
Friedman, Milton, and Anna J. Schwartz (1963). A Monetary History of the United States, 1867-1960. Princeton, N.J.: Princeton University Press for NBER.
Hamilton, James (1987). "Monetary Factors in the Great Depression," Journal of Monetary Economics, 34, pp. 145-69.
Meltzer, Allan (2003). A History of the Federal Reserve, Volume I: 1913-1951. Chicago: The University of Chicago Press.
Romer, Christina (1993). "The Nation in Depression," Journal of Economic Perspectives, 7 (Spring), pp. 19-40.
Temin, Peter (1989). Lessons from the Great Depression. Cambridge, Mass.: MIT Press.
Footnotes
1. My professional articles on the Depression are collected in Bernanke (2000). Return to text
2. Bernanke (2002b) gives a more detailed discussion of the evidence presented by Friedman and Schwartz. Return to text
3. There was less debate about the period 1931-33, the most precipitous downward phase of the Depression, for which most economists were inclined to ascribe an important role to monetary factors. Return to text
4. Critical early research included Choudhri and Kochin (1980) and Eichengreen and Sachs (1985). Eichengreen (1992, 2002) provides the most extensive analysis of the role of the gold standard in causing and propagating the Great Depression. Temin (1989) provides a readable account with a slightly different perspective. Return to text
Return to topReturn to top
2004 Speeches
W@G1 09/04/12 for a 09/05/12 close
2012 Running W@G results
W@G1 01/02/12 for a 01/04/12 close Last Trade 57.14 ~ 57.53 Farooq off by .39 #msg-70530511
W@G2 01/04/12 for a 01/06/12 close Last Trade 57.81 ~ 57.75 Farooq off by .06 #msg-70633458
W@G1 01/09/12 for a 01/11/12 close Last Trade 58.16 ~ 58.23 paulgmx1 off by .07 #msg-70789693
W@G2 01/11/12 for a 01/13/12 close Last Trade 58.18 ~ 58.67 Kookiekook off by .49 #msg-70889167
W@G1 01/17/12 for a 01/18/12 close Last Trade 59.49 ~ 58.98 paulgmx1 off by .51 #msg-71040468
W@G2 01/18/12 for a 01/20/12 close Last Trade 59.77 ~ 59.02 paulgmx1 off by .75 #msg-71163129
W@G1 01/23/12 for a 01/25/12 close Last Trade 60.43 ~ 60.79 rayrohn off by .36 #msg-71323918
W@G2 01/25/12 for a 01/27/12 close Last Trade 60.40 ~ 60.50 rayrohn off by .10 #msg-71426361
W@G1 01/30/12 for a 02/01/12 close Last Trade 61.02 ~ 60.03 Kookiekook off by .99 #msg-71612463
W@G2 02/01/12 for a 02/03/12 close Last Trade 62.05 ~ 60.16 Kookiekook off by 1.89 #msg-71736968
W@G1 02/06/12 for a 02/08/12 close Last Trade 62.46 ~ 62.13 Kookiekook off by .33 #msg-71887330
W@G2 02/08/12 for a 02/10/12 close Last Trade 62.47 ~ 62.11 Kookiekook off by .36 #msg-72007051
W@G1 02/13/12 for a 02/15/12 close Last Trade 62.77 ~ 62.55 Farooq off by .22 #msg-72180003
W@G2 02/15/12 for a 02/17/12 close Last Trade 63.43 ~ 62.90 Farooq off by .53 #msg-72275851
W@G1 02/21/12 for a 02/22/12 close Last Trade 63.32 ~ 63.80 Never96 off by .42 #msg-72422926
W@G2 02/22/12 for a 02/24/12 close Close not enough entries
W@G1 02/27/12 for a 02/29/12 close Last Trade 64.41 ~ 64.36 Kookiekook off by .05 #msg-72704661
W@G2 02/29/12 for a 03/02/12 close Last Trade 64.87 ~ 64.50 Farooq off by .37 #msg-72841567
W@G1 03/05/12 for a 03/07/12 close Last Trade 64.06 ~ 64.00 rayrohn off by .06 #msg-73006374
W@G2 03/07/12 for a 03/09/12 close Last Trade 65.02 ~ 62.50 Farooq off by 2.52 #msg-73112187
W@G1 03/12/12 for a 03/14/12 close Last Trade 66.49 ~ 64.89 Kookiekook off by 2.40 #msg-73285243
W@G2 03/14/12 for a 03/16/12 close Close not enough entries
W@G1 03/19/12 for a 03/21/12 close Last Trade 67.12 ~ 67.13 Kookiekook of by .01 #msg-73546484
W@G2 03/21/12 for a 03/23/12 close Last Trade 66.94 ~ 66.75 Farooq off by .19 #msg-73636834
W@G1 03/26/12 for a 03/28/12 close Last Trade 67.94 ~ 67.50 Farooq off by .44 #msg-73797485
W@G2 03/28/12 for a 03/30/12 close Close not enough entries
W@G1 04/02/12 for a 04/04/12 close Last Trade 67.30 ~ 67.20 Farooq off by .10 #msg-74073310
W@G2 04/04/12 for a 04/06/12 close Close not enough entries
W@G1 04/09/12 for a 04/11/12 close Last Trade 66.45 ~ 66.50 Farooq off by .05 #msg-74292295
W@G2 04/11/12 for a 04/13/12 close Last Trade 66.19 ~ 67.13 Farooq off by .94 #msg-74401471
W@G1 04/16/12 for a 04/18/12 close Last Trade 66.61 ~ 66.56 Farooq off by .05 #msg-74561847
W@G2 04/18/12 for a 04/20/12 close Last Trade 65.68 ~ 66.11 Kookiekook off by .43 #msg-74669192
W@G1 04/23/12 for a 04/25/12 close Last Trade 66.45 ~ 66.11 Kookiekook off by .34 #msg-74852573
W@G2 04/25/12 for a 04/27/12 close Last Trade 67.24 ~ 65.50 Farooq off by 1.74 #msg-74977166
W@G1 04/30/12 for a 05/02/12 close Last Trade 67.06 ~ 67.23 Kookiekook off by .17 #msg-75145387
W@G2 05/02/12 for a 05/04/12 close Last Trade 64.70 ~ 65.56 rayrohn off by .86 #msg-75237580
W@G1 05/07/12 for a 05/09/12 close Last Trade 64.32 64.90 paulgmx1 off by .58~63.74 Kookiekook off by .58 #msg-75417777
W@G2 05/09/12 for a 05/11/12 close Last Trade 64.18 ~ 64.00 paulgmx1 off by .18 #msg-75530701
W@G1 05/14/12 for a 05/16/12 close Last Trade 62.94 ~ 63.01 rayrohn off by .07 #msg-75666813
W@G2 05/16/12 for a 05/18/12 close Last Trade 60.81 ~ 62.76 Kookiekook off by 1.95 #msg-75779075
W@G1 05/21/12 for a 05/23/12 close Last Trade 62.56 ~ 61.78 paulgmx1 off by .78 #msg-75917325
W@G2 05/23/12 for a 05/25/12 close Last Trade 62.07 ~ 62.00 rayrohn off by .07 #msg-76000894
W@G1 05/29/12 for a 05/30/12 close Last Trade 62.33 ~ 62.55 Farooq off by .22 #msg-76114141
W@G2 05/30/12 for a 06/01/12 close Last Trade 60.41 ~ 61.26 Kookiekok off by .85 #msg-76195150
W@G1 06/04/12 for a 06/06/12 close Last Trade 62.52 ~ 60.66 paulgmx1 off by 1.86 #msg-76349052
W@G2 06/06/12 for a 06/08/12 close Last Trade 62.87 ~ 61.66 paulgmx1 off by 1.21 #msg-76440468
W@G1 06/11/12 for a 06/13/12 close Last Trade 62.13 ~ 62.48 Kookiekook off by .35 #msg-76592144
W@G2 06/13/12 for a 06/15/12 close Last Trade 62.99 ~ 63.00 Farooq of by .01 #msg-76681263
W@G1 06/18/12 for a 06/20/12 close Last Trade 64.29 ~ 63.07 paulgmx1 off by 1.22 #msg-76821510
W@G2 06/20/12 for a 06/22/12 close Last Trade 63.35 ~ 64.00 Farooq off by .65 #msg-76913855
W@G1 06/25/12 for a 06/27/12 close Last Trade 62.90 ~ 63.07 paulgmx1 of by .17 #msg-77040855
W@G2 06/27/12 for a 06/29/12 close Last Trade 64.16 ~ 63.96 paulgmx1 off by .20 #msg-77122829
W@G1 07/02/12 for a 07/03/12 close Last Trade 64.89 ~ 64.72 rayrohn off b y .17 #msg-77203209
W@G2 07/05/12 for a 07/06/12 close Last Trade 64.12 ~ 64.00 Farooq off by .12 #msg-77278840
W@G1 07/09/12 for a 07/11/12 close Last Trade 63.02 ~ 63.00 Farooq off by .02 #msg-77424549
W@G2 07/11/12 for a 07/13/12 close Last Trade 63.38 ~ 63.83 paulgmx1 off by .45 #msg-77504877
W@G1 07/16/12 for a 07/18/12 close Last Trade 64.39 ~ 63.89 Kookiekook off by .50 #msg-77641584
W@G2 07/18/12 for a 07/20/12 close Last Trade 64.24 ~ 64.13 Kookiekook off by .11 #msg-77741635
W@G1 07/23/12 for a 07/25/12 close Last Trade 62.54 ~ 62.50 rayrohn off by .04 #msg-77873863
W@G2 07/23/12 for a 07/27/12 close Last Trade 64.87 ~ 64.12 Kookiekook off by .75 #msg-77960243
W@G1 07/30/12 for a 08/01/12 close Last Trade 64.61 ~ 64.31 Kookiekook off by .30 #msg-78112825
W@G2 08/01/12 for a 08/03/12 close Last Trade 65.60 ~ 65.00 Farooq off by .60 #msg-78195500
W@G1 08/06/12 for a 08/08/12 close Last Trade 66.62 ~ 66.91 Kookiekook off by .29 #msg-78426213
W@G2 08/08/12 for a 08/10/12 close Last Trade 66.86 ~ 67.23 Kookiekook off by .99 #msg-78426272
W@G1 08/13/12 for a 08/15/12 close Last Trade 67.22 ~ 67.50 rayrohn off by .28 #msg-78586464
W@G2 08/15/12 for a 08/17/12 close Last Trade 68.32 ~ 66.86 Kookiekook off by 1.46 #msg-78686229
W@G1 08/20/12 for a 08/22/12 close Last Trade 68.43 ~ 67.89 Kookiekook off by .54 #msg-78831353
W@G2 08/22/12 for a 08/24/12 close Last Trade 68.29 ~67.75 Farooq off by .54 #msg-78919770
W@G1 08/27/12 for a 08/29/12 close Last Trade 68.40 ~ 68.87 Kookiekook off by .47 #msg-79066563
W@G2 08/29/12 for a 08/31/12 close Last Trade 68.16 ~ 67.72 Kookiekook off by .44 #msg-79183398
Results W@G2 08/29/12 for a 08/31/12 close
Last Trade 68.16
67.72 Kookiekook off by .44
Nice W@G ED !!!!
PM Update

FWIW IMO oil has top at least Short Term


Is Cashin Cashin' In On Obama?
Tyler Durden's picture
Submitted by Tyler Durden on 08/30/2012 11:54 -0400
Art Cashin
Dennis Gartman
New York Stock Exchange
The Chairman of the fermentation committee, Art Cashin, usually keeps a very apolitical, sober (metaphorically speaking at least) and cool head on, as all veteran traders should. Which is why we were quite stunned to notice that even the NYSE floor veteran may have finally crossed the Rubicon in his political observations. And if Art feels this way, one wonders just how the other Wall Street players, whose voices have far less need to be moderate, really feel...
From UBS Financial Markets:
A Perfect Image – We don't usually comment on political speeches but having written and delivered several hundred business and retirement speeches over five decades, we think we know a good image or phrase when we hear one.
Here, thanks to our good friend, Dennis Gartman, is a home run from Paul Ryan's speech:
College graduates should not have to live out their 20’s in their childhood bedrooms, staring up at the fading Obama posters and wondering when they can move out and get on with their life.
lol 1 day to early but u r only off 1 cent ...
W@G2 08/29/12 for a 08/31/12 close {Chart Added}
67.72 Kookiekook
66.50 rayrohn
66.27 paulgmx1
2012 Running W@G results
W@G1 01/02/12 for a 01/04/12 close Last Trade 57.14 ~ 57.53 Farooq off by .39 #msg-70530511
W@G2 01/04/12 for a 01/06/12 close Last Trade 57.81 ~ 57.75 Farooq off by .06 #msg-70633458
W@G1 01/09/12 for a 01/11/12 close Last Trade 58.16 ~ 58.23 paulgmx1 off by .07 #msg-70789693
W@G2 01/11/12 for a 01/13/12 close Last Trade 58.18 ~ 58.67 Kookiekook off by .49 #msg-70889167
W@G1 01/17/12 for a 01/18/12 close Last Trade 59.49 ~ 58.98 paulgmx1 off by .51 #msg-71040468
W@G2 01/18/12 for a 01/20/12 close Last Trade 59.77 ~ 59.02 paulgmx1 off by .75 #msg-71163129
W@G1 01/23/12 for a 01/25/12 close Last Trade 60.43 ~ 60.79 rayrohn off by .36 #msg-71323918
W@G2 01/25/12 for a 01/27/12 close Last Trade 60.40 ~ 60.50 rayrohn off by .10 #msg-71426361
W@G1 01/30/12 for a 02/01/12 close Last Trade 61.02 ~ 60.03 Kookiekook off by .99 #msg-71612463
W@G2 02/01/12 for a 02/03/12 close Last Trade 62.05 ~ 60.16 Kookiekook off by 1.89 #msg-71736968
W@G1 02/06/12 for a 02/08/12 close Last Trade 62.46 ~ 62.13 Kookiekook off by .33 #msg-71887330
W@G2 02/08/12 for a 02/10/12 close Last Trade 62.47 ~ 62.11 Kookiekook off by .36 #msg-72007051
W@G1 02/13/12 for a 02/15/12 close Last Trade 62.77 ~ 62.55 Farooq off by .22 #msg-72180003
W@G2 02/15/12 for a 02/17/12 close Last Trade 63.43 ~ 62.90 Farooq off by .53 #msg-72275851
W@G1 02/21/12 for a 02/22/12 close Last Trade 63.32 ~ 63.80 Never96 off by .42 #msg-72422926
W@G2 02/22/12 for a 02/24/12 close Close not enough entries
W@G1 02/27/12 for a 02/29/12 close Last Trade 64.41 ~ 64.36 Kookiekook off by .05 #msg-72704661
W@G2 02/29/12 for a 03/02/12 close Last Trade 64.87 ~ 64.50 Farooq off by .37 #msg-72841567
W@G1 03/05/12 for a 03/07/12 close Last Trade 64.06 ~ 64.00 rayrohn off by .06 #msg-73006374
W@G2 03/07/12 for a 03/09/12 close Last Trade 65.02 ~ 62.50 Farooq off by 2.52 #msg-73112187
W@G1 03/12/12 for a 03/14/12 close Last Trade 66.49 ~ 64.89 Kookiekook off by 2.40 #msg-73285243
W@G2 03/14/12 for a 03/16/12 close Close not enough entries
W@G1 03/19/12 for a 03/21/12 close Last Trade 67.12 ~ 67.13 Kookiekook of by .01 #msg-73546484
W@G2 03/21/12 for a 03/23/12 close Last Trade 66.94 ~ 66.75 Farooq off by .19 #msg-73636834
W@G1 03/26/12 for a 03/28/12 close Last Trade 67.94 ~ 67.50 Farooq off by .44 #msg-73797485
W@G2 03/28/12 for a 03/30/12 close Close not enough entries
W@G1 04/02/12 for a 04/04/12 close Last Trade 67.30 ~ 67.20 Farooq off by .10 #msg-74073310
W@G2 04/04/12 for a 04/06/12 close Close not enough entries
W@G1 04/09/12 for a 04/11/12 close Last Trade 66.45 ~ 66.50 Farooq off by .05 #msg-74292295
W@G2 04/11/12 for a 04/13/12 close Last Trade 66.19 ~ 67.13 Farooq off by .94 #msg-74401471
W@G1 04/16/12 for a 04/18/12 close Last Trade 66.61 ~ 66.56 Farooq off by .05 #msg-74561847
W@G2 04/18/12 for a 04/20/12 close Last Trade 65.68 ~ 66.11 Kookiekook off by .43 #msg-74669192
W@G1 04/23/12 for a 04/25/12 close Last Trade 66.45 ~ 66.11 Kookiekook off by .34 #msg-74852573
W@G2 04/25/12 for a 04/27/12 close Last Trade 67.24 ~ 65.50 Farooq off by 1.74 #msg-74977166
W@G1 04/30/12 for a 05/02/12 close Last Trade 67.06 ~ 67.23 Kookiekook off by .17 #msg-75145387
W@G2 05/02/12 for a 05/04/12 close Last Trade 64.70 ~ 65.56 rayrohn off by .86 #msg-75237580
W@G1 05/07/12 for a 05/09/12 close Last Trade 64.32 64.90 paulgmx1 off by .58~63.74 Kookiekook off by .58 #msg-75417777
W@G2 05/09/12 for a 05/11/12 close Last Trade 64.18 ~ 64.00 paulgmx1 off by .18 #msg-75530701
W@G1 05/14/12 for a 05/16/12 close Last Trade 62.94 ~ 63.01 rayrohn off by .07 #msg-75666813
W@G2 05/16/12 for a 05/18/12 close Last Trade 60.81 ~ 62.76 Kookiekook off by 1.95 #msg-75779075
W@G1 05/21/12 for a 05/23/12 close Last Trade 62.56 ~ 61.78 paulgmx1 off by .78 #msg-75917325
W@G2 05/23/12 for a 05/25/12 close Last Trade 62.07 ~ 62.00 rayrohn off by .07 #msg-76000894
W@G1 05/29/12 for a 05/30/12 close Last Trade 62.33 ~ 62.55 Farooq off by .22 #msg-76114141
W@G2 05/30/12 for a 06/01/12 close Last Trade 60.41 ~ 61.26 Kookiekok off by .85 #msg-76195150
W@G1 06/04/12 for a 06/06/12 close Last Trade 62.52 ~ 60.66 paulgmx1 off by 1.86 #msg-76349052
W@G2 06/06/12 for a 06/08/12 close Last Trade 62.87 ~ 61.66 paulgmx1 off by 1.21 #msg-76440468
W@G1 06/11/12 for a 06/13/12 close Last Trade 62.13 ~ 62.48 Kookiekook off by .35 #msg-76592144
W@G2 06/13/12 for a 06/15/12 close Last Trade 62.99 ~ 63.00 Farooq of by .01 #msg-76681263
W@G1 06/18/12 for a 06/20/12 close Last Trade 64.29 ~ 63.07 paulgmx1 off by 1.22 #msg-76821510
W@G2 06/20/12 for a 06/22/12 close Last Trade 63.35 ~ 64.00 Farooq off by .65 #msg-76913855
W@G1 06/25/12 for a 06/27/12 close Last Trade 62.90 ~ 63.07 paulgmx1 of by .17 #msg-77040855
W@G2 06/27/12 for a 06/29/12 close Last Trade 64.16 ~ 63.96 paulgmx1 off by .20 #msg-77122829
W@G1 07/02/12 for a 07/03/12 close Last Trade 64.89 ~ 64.72 rayrohn off b y .17 #msg-77203209
W@G2 07/05/12 for a 07/06/12 close Last Trade 64.12 ~ 64.00 Farooq off by .12 #msg-77278840
W@G1 07/09/12 for a 07/11/12 close Last Trade 63.02 ~ 63.00 Farooq off by .02 #msg-77424549
W@G2 07/11/12 for a 07/13/12 close Last Trade 63.38 ~ 63.83 paulgmx1 off by .45 #msg-77504877
W@G1 07/16/12 for a 07/18/12 close Last Trade 64.39 ~ 63.89 Kookiekook off by .50 #msg-77641584
W@G2 07/18/12 for a 07/20/12 close Last Trade 64.24 ~ 64.13 Kookiekook off by .11 #msg-77741635
W@G1 07/23/12 for a 07/25/12 close Last Trade 62.54 ~ 62.50 rayrohn off by .04 #msg-77873863
W@G2 07/23/12 for a 07/27/12 close Last Trade 64.87 ~ 64.12 Kookiekook off by .75 #msg-77960243
W@G1 07/30/12 for a 08/01/12 close Last Trade 64.61 ~ 64.31 Kookiekook off by .30 #msg-78112825
W@G2 08/01/12 for a 08/03/12 close Last Trade 65.60 ~ 65.00 Farooq off by .60 #msg-78195500
W@G1 08/06/12 for a 08/08/12 close Last Trade 66.62 ~ 66.91 Kookiekook off by .29 #msg-78426213
W@G2 08/08/12 for a 08/10/12 close Last Trade 66.86 ~ 67.23 Kookiekook off by .99 #msg-78426272
W@G1 08/13/12 for a 08/15/12 close Last Trade 67.22 ~ 67.50 rayrohn off by .28 #msg-78586464
W@G2 08/15/12 for a 08/17/12 close Last Trade 68.32 ~ 66.86 Kookiekook off by 1.46 #msg-78686229
W@G1 08/20/12 for a 08/22/12 close Last Trade 68.43 ~ 67.89 Kookiekook off by .54 #msg-78831353
W@G2 08/22/12 for a 08/24/12 close Last Trade 68.29 ~ 67.75 Farooq off by .54 #msg-78919770
W@G1 08/27/12 for a 08/29/12 close Last Trade 68.40 ~ 68.87 Kookiekook off by .47 #msg-79066563
Results W@G1 08/27/12 for a 08/29/12 close
Last Trade 68.40
68.87 Kookiekook off by .47
lol back in February he did four in a row
Nice WAG Ed !!!
W@G2 08/29/12 for a 08/31/12 close
67.72 Kookiekook
66.50 rayrohn
Fed's Fisher commissions paper to bolster easy money opposition
ReutersReuters – 7 hours ago
(Reuters) - Dallas Federal Reserve Bank President Richard Fisher on Monday sought to add heft to his opposition to further monetary stimulus with the release of a paper by a well-known economist critical of ultra-easy policy.
Fisher, who does not have a vote this year on the Fed's policy-setting panel, said he commissioned the paper "to inform me in my capacity as a member of the Federal Open Market Committee."
Calling the 45-page paper's findings "most illuminating," Fisher called particular attention to its contention that easy money is ineffective at boosting growth and in fact hurts the economy by encouraging governments to pursue "imprudent behavior" like excessive borrowing.
When central banks use easy monetary policy to buy time for policies like debt reduction that are better placed to foster strong and sustained growth, "The danger remains, of course, that ultra easy monetary policy will be wrongly judged as being sufficient to achieve these ends," former Bank for International Settlements head economist William White wrote in the paper.
"The arguments presented in this paper then logically imply that monetary policy should be tightened, regardless of the current state of the economy, because the near term expected benefits of ultra easy monetary policies are outweighed by the longer term expected costs."
Raising interest rates would be painful, but may be where central banks of developed economies "are now headed, absent the vigorous pursuit by governments" of non-monetary policies to boost growth, White wrote.
Fisher, who has often spoken against further monetary easing, said in May that the time had not yet come for policy tightening. A spokesman on Monday said that view had not changed.
Many policymakers at the U.S. central bank's most recent meeting thought that a new round of easing would likely be needed "fairly soon" unless economic conditions improved, minutes from the July 31-August 1 meeting showed.
Investors are looking to a speech by Fed Chairman Ben Bernanke on Friday for clues about how close fresh monetary easing might be.
(Reporting by Ann Saphir; Editing by Dan Grebler)
W@G1 08/27/12 for a 08/29/12 close
68.87 Kookiekook
67.50 rayrohn
W@G1 08/27/12 for a 08/29/12 close
Dow Theory remains on a sell

The FOMC Minutes & QE3
Email this post Print this post
By James Bianco - August 25th, 2012, 8:30AM
The Wall Street Journal – Hilsenrath: Fed Moving Closer to Action
The Federal Reserve sent its strongest signal yet that it is preparing new steps to bolster the economic recovery, saying measures would be needed fairly soon unless growth substantially and convincingly picks up. Minutes released Wednesday from the Fed’s July 31-Aug. 1 policy meeting suggested that a new round of bond buying, known as quantitative easing, was high on its list of options…”Many members judged that additional monetary accommodation would likely be warranted fairly soon unless incoming information pointed to a substantial and sustainable strengthening in the pace of the economic recovery,” the minutes said. That language suggested the Fed has set a high bar for holding off. Few economists have described the economic improvements recorded since the meeting as substantial, and doubts remain about whether they are lasting. The Fed next meets on Sept. 12-13. The Fed’s worries about growth were echoed Wednesday by the nonpartisan Congressional Budget Office. It warned the economy likely would slide into “significant recession” next year if Congress doesn’t avert tax increases and spending cuts set to begin in January. Even if this “fiscal cliff” is averted, it added, the economy would probably grow less than 2% in 2013 with unemployment staying near 8%.
Reuters – Counterparties: The CBO as Hilsenrath-like Fed whisperer
This line, somewhat buried in the CBO’s latest report on economic and fiscal outlook, seems to think QE3 is a damn near certain:
CBO anticipates that the economic slowdown brought about by fiscal tightening, coupled with a lack of inflationary pressure, will prompt the Federal Reserve to embark on another round of large-scale asset purchases by early 2013, thus helping to hold down the rate on 10-year Treasury notes.
This little nugget beat the FOMC minutes, which set the stage for QE3, by a few hours. And was hours ahead of the WSJ Jon Hilsenrath’s story on same. Which brings up some questions: It makes sense that the CBO would take possible — or even likely — Fed action into account, but how was the CBO so certain the Fed would act? Is this the first time the CBO has baked in a large-scale Fed action into its projections? How would a lack of Fed action affect the CBO’s outlook? And what should we make of the CBO footnote on this passage?
Because of the severity of the financial crisis and subsequent economic downturn, the Federal Reserve has used asset purchases and other nontraditional means to supplement its use of the federal funds rate to support economic activity. Between late 2008 and early 2010, for example, the Federal Reserve purchased about $1.25 trillion in mortgage-backed securities guaranteed by Fannie Mae, Freddie Mac, and Ginnie Mae; $175 billion in debt securities issued by those agencies; and $300 billion in Treasury securities with maturities of more than one year. For a discussion of the nontraditional means and their effects on the economy, see Congressional Budget Office, The Budgetary Impact and Subsidy Costs of the Federal Reserve’s Actions During the Financial Crisis (May 2010); and Joseph Gagnon and others, Large-Scale Asset Purchases by the Federal Reserve: Did They Work? Staff Report 441 (Federal Reserve Bank of New York, March 2010),
Comment
The September 12/13 meeting is shaping up as the make-or-break moment for QE3. At this meeting the FOMC members update their forecasts and Bernanke holds a press conference. These events lend themselves well to policy changes (adding QE3), which is another reason many expect action at this meeting. Additionally, the next meeting is not until late October and that is perceived to be too close to the election.
MarketBeat (WSJ Blog) – QE3's Coming in September, No Doubt; Unless it Isn’t
This tea-leaves stuff is hard! The markets have arranged the latest grouping of tea leaves, and concluded that September is it, definitely, without a doubt for more stimulus. Unless it isn’t. The latest FOMC minutes, relating what happened at the Fed’s July 31-Aug. 1 meeting, seem to point toward a new Fed bond-buying program coming in September, given that now “many” members are agitating for the Fed to “do something,” as opposed to “a few” at the previous meeting. Given the constrictions of the November election, and the current Fed’s desire to avoid any appearances of being politically motivated, the Sept. 12-13 meeting seems to be “it” if anything’s going to happen. “I stick to my belief that more QE is coming on Sept. 13 as the October meeting is too close to the election and Bernanke won’t act in December if Romney wins,” writes Peter Boockvar, managing director at Miller Tabak & Co. “This could be his last chance for a while and Ben still seems to believe in the pixie dust of QE.” But the Fed’s been hinting and hinting about a new stimulus program since QE2 ended last year; jawboning has become a real tool for the Fed. So, more hints don’t necessarily mean anything. Besides, the Fed’s hawks and doves are a pretty well-defined group. What matters is what Chairman Ben Bernanke thinks, and he’s been holding his cards very close to the vest.
Zero Hedge (Blog) – Bullard Says FOMC Minutes Are Stale
Following yesterday’s FOMC minutes we suggested that the minutes are, all facts considered, extremely stale, especially when one actually observes the surge in all economic indicators (or should we say seasonal adjustments) since the last FOMC meeting. Moments ago, on CNBC, non-voting St Louis Fed president confirmed just that.
St. Louis Fed President Bullard says FOMC minutes “are a bit stale”.
Says some data stronger since FOMC minutes
Doesn’t know where FOMC will come out on easing
Says “different constellation” of data vs 2011
Says “not sure” data warrant big FOMC action
Says U.S. unemployment “very high”
Says “we’re not going to react” directly to stock market
Comment
Remember that this is arguably the most divided FOMC in the 100-year history of the Federal Reserve. Simply put, the hawks (i.e., Richard Fisher and Charles Plosser) and the doves (Charlie Evans and Eric Rosengren) have radically different views of the economy and what the Federal Reserve should do. The Federal Reserve has a median view with a very wide variance.
To be sure, Bernanke has the votes for QE3. He has always had the votes. But there is also a strong vocal minority against it. He fears the hawks may hit the airwaves to tell the world the Federal Reserve made a mistake and undermine his policy.
Given this, view Bullard’s comments as personal opinion.
~~~~
For more information on this institutional research, please contact:
Max Konzelman
max.konzelman@arborresearch.com
800-606-1872
Fiscal Cliff? Why Markets Haven't Priced In Disaster—Yet
http://www.cnbc.com/id/48768406
Nice W@G farooq !!!
The Five-Year Pattern For The CBOE Volatility Index (VIX)
By Guest Author - August 23rd, 2012, 8:30AM
VIX five-year pattern suggests a complacent equity market
Source: BofA / Merrill Lynch Market Analysis
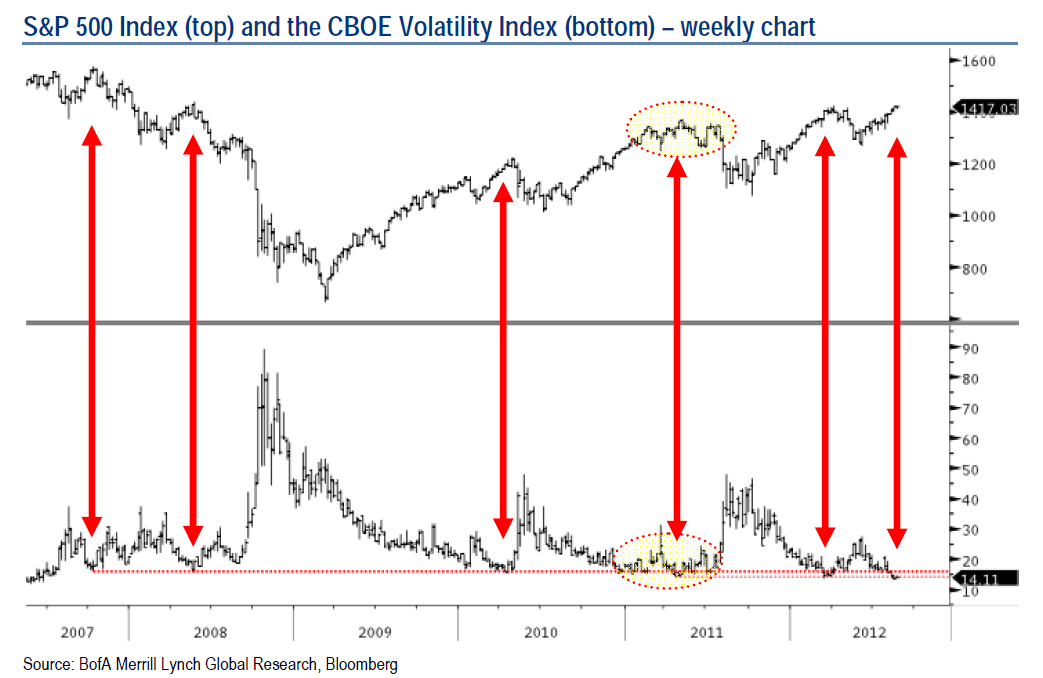
Over the last five years, readings of 16 to 14 for the CBOE Volatility Index (VIX) have indicated complacency in the US equity market. Based on the chart below, prior declines to 16-14 in the VIX coincided with peaks in the equity market in October 2007, May 2008, April 2010, during the December 2010 to July 2011 period, and April 2012. Moving into late August, the VIX has already dropped to as low as 13.32 on 17 August, which was the lowest level since June 2007. In our view, a low VIX is increasing the risk of a meaningful pullback during the seasonally weak month of September – see the side bar for seasonal stats on the S&P 500.
AAII Investor Sentiment Survey
bulls  42%                     +5.1

 Neutral 32.2                  -2.9

 Bearish 25.9%                 -2.2
6:25 PM The middle class suffered its "worst decade in modern history" in the 10 years ending in 2010, falling backward in income for the first time since World War II, a new Pew Research study says. In 1970, the share of U.S. income going to the middle class was 62%, while the wealthy received 29%; by 2010, the middle class took 45% of total income, vs. 46% for upper-income Americans. [U.S.
W@G2 08/22/12 for a 08/24/12 close {Chart Added}
67.75 Farooq
67.16 Kookiekook
66.50 rayrohn
66.27 paulgmx1
2012 Running W@G results
W@G1 01/02/12 for a 01/04/12 close Last Trade 57.14 ~ 57.53 Farooq off by .39 #msg-70530511
W@G2 01/04/12 for a 01/06/12 close Last Trade 57.81 ~ 57.75 Farooq off by .06 #msg-70633458
W@G1 01/09/12 for a 01/11/12 close Last Trade 58.16 ~ 58.23 paulgmx1 off by .07 #msg-70789693
W@G2 01/11/12 for a 01/13/12 close Last Trade 58.18 ~ 58.67 Kookiekook off by .49 #msg-70889167
W@G1 01/17/12 for a 01/18/12 close Last Trade 59.49 ~ 58.98 paulgmx1 off by .51 #msg-71040468
W@G2 01/18/12 for a 01/20/12 close Last Trade 59.77 ~ 59.02 paulgmx1 off by .75 #msg-71163129
W@G1 01/23/12 for a 01/25/12 close Last Trade 60.43 ~ 60.79 rayrohn off by .36 #msg-71323918
W@G2 01/25/12 for a 01/27/12 close Last Trade 60.40 ~ 60.50 rayrohn off by .10 #msg-71426361
W@G1 01/30/12 for a 02/01/12 close Last Trade 61.02 ~ 60.03 Kookiekook off by .99 #msg-71612463
W@G2 02/01/12 for a 02/03/12 close Last Trade 62.05 ~ 60.16 Kookiekook off by 1.89 #msg-71736968
W@G1 02/06/12 for a 02/08/12 close Last Trade 62.46 ~ 62.13 Kookiekook off by .33 #msg-71887330
W@G2 02/08/12 for a 02/10/12 close Last Trade 62.47 ~ 62.11 Kookiekook off by .36 #msg-72007051
W@G1 02/13/12 for a 02/15/12 close Last Trade 62.77 ~ 62.55 Farooq off by .22 #msg-72180003
W@G2 02/15/12 for a 02/17/12 close Last Trade 63.43 ~ 62.90 Farooq off by .53 #msg-72275851
W@G1 02/21/12 for a 02/22/12 close Last Trade 63.32 ~ 63.80 Never96 off by .42 #msg-72422926
W@G2 02/22/12 for a 02/24/12 close Close not enough entries
W@G1 02/27/12 for a 02/29/12 close Last Trade 64.41 ~ 64.36 Kookiekook off by .05 #msg-72704661
W@G2 02/29/12 for a 03/02/12 close Last Trade 64.87 ~ 64.50 Farooq off by .37 #msg-72841567
W@G1 03/05/12 for a 03/07/12 close Last Trade 64.06 ~ 64.00 rayrohn off by .06 #msg-73006374
W@G2 03/07/12 for a 03/09/12 close Last Trade 65.02 ~ 62.50 Farooq off by 2.52 #msg-73112187
W@G1 03/12/12 for a 03/14/12 close Last Trade 66.49 ~ 64.89 Kookiekook off by 2.40 #msg-73285243
W@G2 03/14/12 for a 03/16/12 close Close not enough entries
W@G1 03/19/12 for a 03/21/12 close Last Trade 67.12 ~ 67.13 Kookiekook of by .01 #msg-73546484
W@G2 03/21/12 for a 03/23/12 close Last Trade 66.94 ~ 66.75 Farooq off by .19 #msg-73636834
W@G1 03/26/12 for a 03/28/12 close Last Trade 67.94 ~ 67.50 Farooq off by .44 #msg-73797485
W@G2 03/28/12 for a 03/30/12 close Close not enough entries
W@G1 04/02/12 for a 04/04/12 close Last Trade 67.30 ~ 67.20 Farooq off by .10 #msg-74073310
W@G2 04/04/12 for a 04/06/12 close Close not enough entries
W@G1 04/09/12 for a 04/11/12 close Last Trade 66.45 ~ 66.50 Farooq off by .05 #msg-74292295
W@G2 04/11/12 for a 04/13/12 close Last Trade 66.19 ~ 67.13 Farooq off by .94 #msg-74401471
W@G1 04/16/12 for a 04/18/12 close Last Trade 66.61 ~ 66.56 Farooq off by .05 #msg-74561847
W@G2 04/18/12 for a 04/20/12 close Last Trade 65.68 ~ 66.11 Kookiekook off by .43 #msg-74669192
W@G1 04/23/12 for a 04/25/12 close Last Trade 66.45 ~ 66.11 Kookiekook off by .34 #msg-74852573
W@G2 04/25/12 for a 04/27/12 close Last Trade 67.24 ~ 65.50 Farooq off by 1.74 #msg-74977166
W@G1 04/30/12 for a 05/02/12 close Last Trade 67.06 ~ 67.23 Kookiekook off by .17 #msg-75145387
W@G2 05/02/12 for a 05/04/12 close Last Trade 64.70 ~ 65.56 rayrohn off by .86 #msg-75237580
W@G1 05/07/12 for a 05/09/12 close Last Trade 64.32 64.90 paulgmx1 off by .58~63.74 Kookiekook off by .58 #msg-75417777
W@G2 05/09/12 for a 05/11/12 close Last Trade 64.18 ~ 64.00 paulgmx1 off by .18 #msg-75530701
W@G1 05/14/12 for a 05/16/12 close Last Trade 62.94 ~ 63.01 rayrohn off by .07 #msg-75666813
W@G2 05/16/12 for a 05/18/12 close Last Trade 60.81 ~ 62.76 Kookiekook off by 1.95 #msg-75779075
W@G1 05/21/12 for a 05/23/12 close Last Trade 62.56 ~ 61.78 paulgmx1 off by .78 #msg-75917325
W@G2 05/23/12 for a 05/25/12 close Last Trade 62.07 ~ 62.00 rayrohn off by .07 #msg-76000894
W@G1 05/29/12 for a 05/30/12 close Last Trade 62.33 ~ 62.55 Farooq off by .22 #msg-76114141
W@G2 05/30/12 for a 06/01/12 close Last Trade 60.41 ~ 61.26 Kookiekok off by .85 #msg-76195150
W@G1 06/04/12 for a 06/06/12 close Last Trade 62.52 ~ 60.66 paulgmx1 off by 1.86 #msg-76349052
W@G2 06/06/12 for a 06/08/12 close Last Trade 62.87 ~ 61.66 paulgmx1 off by 1.21 #msg-76440468
W@G1 06/11/12 for a 06/13/12 close Last Trade 62.13 ~ 62.48 Kookiekook off by .35 #msg-76592144
W@G2 06/13/12 for a 06/15/12 close Last Trade 62.99 ~ 63.00 Farooq of by .01 #msg-76681263
W@G1 06/18/12 for a 06/20/12 close Last Trade 64.29 ~ 63.07 paulgmx1 off by 1.22 #msg-76821510
W@G2 06/20/12 for a 06/22/12 close Last Trade 63.35 ~ 64.00 Farooq off by .65 #msg-76913855
W@G1 06/25/12 for a 06/27/12 close Last Trade 62.90 ~ 63.07 paulgmx1 of by .17 #msg-77040855
W@G2 06/27/12 for a 06/29/12 close Last Trade 64.16 ~ 63.96 paulgmx1 off by .20 #msg-77122829
W@G1 07/02/12 for a 07/03/12 close Last Trade 64.89 ~ 64.72 rayrohn off b y .17 #msg-77203209
W@G2 07/05/12 for a 07/06/12 close Last Trade 64.12 ~ 64.00 Farooq off by .12 #msg-77278840
W@G1 07/09/12 for a 07/11/12 close Last Trade 63.02 ~ 63.00 Farooq off by .02 #msg-77424549
W@G2 07/11/12 for a 07/13/12 close Last Trade 63.38 ~ 63.83 paulgmx1 off by .45 #msg-77504877
W@G1 07/16/12 for a 07/18/12 close Last Trade 64.39 ~ 63.89 Kookiekook off by .50 #msg-77641584
W@G2 07/18/12 for a 07/20/12 close Last Trade 64.24 ~ 64.13 Kookiekook off by .11 #msg-77741635
W@G1 07/23/12 for a 07/25/12 close Last Trade 62.54 ~ 62.50 rayrohn off by .04 #msg-77873863
W@G2 07/23/12 for a 07/27/12 close Last Trade 64.87 ~ 64.12 Kookiekook off by .75 #msg-77960243
W@G1 07/30/12 for a 08/01/12 close Last Trade 64.61 ~ 64.31 Kookiekook off by .30 #msg-78112825
W@G2 08/01/12 for a 08/03/12 close Last Trade 65.60 ~ 65.00 Farooq off by .60 #msg-78195500
W@G1 08/06/12 for a 08/08/12 close Last Trade 66.62 ~ 66.91 Kookiekook off by .29 #msg-78426213
W@G2 08/08/12 for a 08/10/12 close Last Trade 66.86 ~ 67.23 Kookiekook off by .99 #msg-78426272
W@G1 08/13/12 for a 08/15/12 close Last Trade 67.22 ~ 67.50 rayrohn off by .28 #msg-78586464
W@G2 08/15/12 for a 08/17/12 close Last Trade 68.32 ~ 66.86 Kookiekook off by 1.46 #msg-78686229
W@G1 08/20/12 for a 08/22/12 close Last Trade 68.43 ~ 67.89 Kookiekook off by .54 #msg-78831353
Results W@G1 08/20/12 for a 08/22/12 close
Last Trade 68.43
67.89 Kookiekook off by .54
Beef Herd Tumbles to 40-Year Low on Feed Cost Surge: Commodities
By Whitney McFerron, Tony C. Dreibus and Elizabeth Campbell - Aug 22, 2012 6:00 PM CT
The worst U.S. drought in a half century and record feed prices are spurring farmers to shrink cattle herds to the smallest in two generations, driving beef prices higher.
Beef output will slump to a nine-year low in 2013 after drought damaged pastures from Missouri to Montana, the U.S. Department of Agriculture estimates. The domestic herd is now the smallest since at least 1973, and retail prices reached a record last month, USDA data show. Cattle futures may rise 8.5 percent to an all-time high of $1.35 a pound in Chicago in the next 12 months, said Rich Nelson, the chief strategist at Allendale Inc. who has tracked the market for 15 years.
Feedlots are losing $300 a head this month fattening cattle for slaughter, after corn surged 65 percent since June 15, University of Missouri data show. JBS (JBSS3) SA, the largest beef producer, fast-food chain Wendy’s Co. (WEN) and Red Robin Gourmet Burgers Inc. are among those planning price increases. The USDA expects food inflation of as much as 4 percent in 2013, compared with an average of 3 percent since 2004. A United Nations gauge of global food costs jumped 6.2 percent in July.
“We’ve had a huge liquidation off of pastures,” said Walt Hackney, 74, who buys and sells 250,000 cattle a year in Omaha, Nebraska, and has worked in the livestock business for about a half century. “It’s all due to the drought. There’s no grass for them to graze on.”
Eight Commodities
After rising 11 percent since late April, cattle are now 2.5 percent higher for the year at $1.24475. The Standard & Poor’s GSCI Agriculture Index of eight commodities advanced 20 percent since the start of January, and the MSCI All-Country World Index of equities added 8.5 percent. Treasuries returned 1.3 percent, a Bank of America Corp. Index shows.
Beef output in the U.S., the world’s largest producer, will drop 3.9 percent to 24.575 billion pounds (11.147 million metric tons) next year, the lowest since 2004, the USDA estimates. The domestic herd across ranches, feedlots and dairies dropped to 97.8 million head on July 1, the smallest for the date in at least 39 years, the latest data show.
The domestic price of beef will rise as much as 5 percent next year, more than any other food group including fruits, cereals and dairy products, the USDA estimated on July 25. Pork may increase by 3.5 percent and poultry 4 percent, the agency said. Retail ground-beef averaged $3.085 a pound in July, the highest since at least 1984, and whole chickens were $1.454 a pound last month, the highest in at least 32 years, according to the Bureau of Labor Statistics.
Eating Corn
Cattle spend 12 to 18 months eating grass before they are sent to feedlots, where they consume mostly corn for five months until they are fat enough for slaughter. The drought has left pastures in the worst condition since at least 1995, with 59 percent rated poor or very poor on Aug. 19, the government estimates. The corn harvest will drop 13 percent this year to 10.779 billion bushels, the USDA said Aug. 10. The grain reached a record $8.49 a bushel in Chicago that day.
Prices for hay, the third-biggest domestic crop by value, have also surged. This year’s alfalfa harvest will probably be the smallest since 1953, and the price of meal made from the crop was $334 a ton yesterday in Kansas City, Missouri, up from as low as $239 a year earlier, the USDA estimates.
Slaughter Increases
A faster slaughter may initially drive prices lower. Almost 3.09 million cows were culled in the first half of the year, compared with a 10-year average of 2.8 million, USDA data show. The figures have “increased dramatically” since early June because of the drought, the department said in an Aug. 16 report.
Demand for exports may slow as a strengthening dollar makes shipments from Australia and Brazil more attractive, David Nelson, an analyst at Rabobank International in Chicago, said in an Aug. 13 report. U.S. exports in the first half were 11 percent smaller than a year earlier, government data show.
U.S. consumption of red meat and poultry will fall below 200 pounds per person next year for the first time since 1990, the USDA predicts. Retail beef reached an all-time high of $4.715 a pound in July, according to the USDA’s composite price, which includes choice beef, other beef and hamburger values. The Iowa Corn Growers Association estimates one bushel of the grain converts to 5.6 pounds of retail beef.
Fewer Calves
The expansion in supply probably won’t last long because it will “curtail the already limited availability of calves this fall,” Goldman Sachs Group Inc. analysts said in a report last month. The bank anticipates a futures price of $1.15 in three months and $1.30 in 12 months. Prices next year may exceed the Feb. 22 record of $1.315, Rabobank estimates.
“Our U.S. cow-herd population is low, and there’s not going to be much adding to the herd with the drought going on,” said Henry Beel, 40, who co-owns a 1,200-head cattle business with his brothers near Johnstown, Nebraska. Beel Brothers LLC has reduced its breeding herd by selling heifers to feedlots, which means “there’s going to be a smaller amount of cattle available to the packing plants” next year, he said.
The slide in output may not stop until 2016 or 2017, Rachel J. Johnson, a USDA livestock economist, wrote in an Aug. 16 report. Once the herd starts to expand, it takes more than two years to boost supplies, according to Ron Plain, a livestock economist at the University of Missouri. Calves have a nine- month gestation period and take about 20 months to reach slaughter weight, he said.
Raising Prices
“We expect higher beef cost will be the largest driver” of commodity spending at Dublin, Ohio-based Wendy’s, Stephen E. Hare, the chief financial officer, told analysts in an Aug. 9 earnings conference call. The company, which operates more than 6,500 fast-food restaurants, will “implement selective price increases” and cut other expenditures, Hare said.
Wesley Batista, the chief executive officer of Sao Paulo- based JBS, said on a conference call Aug. 15 that the company will raise beef prices because of the grain rally, without saying by how much.
Red Robin (RRGB), the Greenwood Village, Colorado-based restaurant operator, said on an earnings conference call on Aug. 9 that the chain will be making “modest” price increases partly because of the outlook for rising commodities and the impact of the drought.
Steakhouses
Arne Haak, chief financial officer of Ruth’s Hospitality Group Inc., the owner of upscale steakhouses, said on an earnings conference call on July 27 that higher beef costs are hurting the Heathrow, Florida-based company’s bottom line. The company is evaluating “additional menu engineering and pricing opportunities,” he said.
Federal Reserve policy makers “acknowledged that the drought would likely result in a temporary run-up in consumer food prices later this year,” according to minutes of the Federal Open Market Committee’s July 31-Aug. 1 gathering released yesterday.
Expensive grain also is hurting livestock producers from Asia to Europe. The Korea Feed Association, South Korea’s biggest grain importer, urged the U.S. in July to consider cutting the use of corn and soybeans in biofuel production. The Asian country gets about 80 percent of its feed corn from American growers.
In Germany, Europe’s biggest pig producer, farmers lost about 30 euro-cents (37 cents) on every kilogram (2.2 pounds) of pork sold in the first half, said Matthias Quaing, a consultant at farm group Interessengemeinschaft der Schweinehalter Deutschlands. The U.K.’s National Pork Association estimates farmers accounting for 10 percent of the country’s output may leave the business by late December.
‘Losing Money’
“We’re losing money on every pig we sell,” said James Hart, a second-generation producer in Cirencester, England, who will sell the last of his pigs in November. “The problem in the Midwest states and the critical drought is driving our corn prices and our wheat prices around the world to levels we’ve never seen before.”
In the U.S., hog farmers may lose $25 a pig in the fourth quarter, said Scott Brown, an agricultural economist at the University of Missouri in Columbia. Higher feed costs are detrimental to the credit ratings of producers including Tyson Foods Inc. (TSN), Pilgrim’s Pride Corp. (PPC) and Smithfield Foods Inc. (SFD), Moody’s Investors Service said in a report Aug. 16.
Dan Harris, the owner of the Holton Livestock Exchange in Holton, Kansas, said he is selling twice as many cattle as usual for this time of year. Less than half the normal amount of rain fell in parts of the state during the past 30 days, according to the National Weather Service. Without more moisture, producers will keep shrinking herds, Harris said by phone Aug. 15.
“People are selling their calves 60 to 90 days early to preserve their cow herds,” he said. “Conditions will not improve until we get some rain.”
To contact the reporters on this story: Whitney McFerron in London at wmcferron1@bloomberg.net; Tony C. Dreibus in Chicago at tdreibus@bloomberg.net; Elizabeth Campbell in Chicago at ecampbell14@bloomberg.net
To contact the editors responsible for this story: Steve Stroth at sstroth@bloomberg.net; Claudia Carpenter at ccarpenter2@bloomberg.net
Nice W@G Kookiekook !!!!
Fed Report: No More Monetary Gas Needed
Email this post Print this post
By Guest Author - August 22nd, 2012, 7:00AM
The Federal Reserve Bank of NY put out a research paper that must have pissed off Bernanke and the other Fed doves. Here is a Link to the Fed report, and another Link to a Bloomberg article with a good discussion.

The report looks at the consequences of structural issues that have impeded the return to “full employment” in the economy. The analysis identifies structural impediments as “misalignments”:
“idle workers are seeking employment in sectors (occupations, industries, locations) different from those where the available jobs are. Such misalignment between the distribution of vacancies and unemployment across sectors of the economy would lower the aggregate job-finding rate.”
About one-third, or 1.5 percentage points, of the jump in unemployment from 5 percent as the economic slump began to its 10 percent peak in October 2009 can be traced to a mismatch between the supply of labor and job openings.
The natural rate of unemployment is around 7 percent, a level to which joblessness could fall over time were businesses to create new jobs through innovation.

W@G2 08/22/12 for a 08/24/12 close
66.50 rayrohn
interesting chart ....
Why oil bulls may get burned
August 21, 2012: 7:00 AM ET
Bullish fund managers are outnumbering bearish ones by five to one, but it's not clear why -- there are more signs that oil prices will retreat than continue to advance.
By Cyrus Sanati
FORTUNE -- Wall Street money managers betting on a pop in oil prices could be in for a rude awakening.
This summer, the 22% spike in WTI and 30% spike in Brent, the two most actively traded crude price benchmarks, seem to be based more on fear and speculation than logic and fact. Indeed, it is not unusual to see such rallies in a volatile commodity like crude. The elasticity of the product means that if you don't have it when you need it prices will instantly go through the roof. Anxiety over supply tends to push prices way beyond where they should be, and then the pendulum always swings back, crushing bulls in spectacular fashion.
But current worries over a possible war with Iran are overblown, as neither the West nor Iran seem truly interested in elevating the conflict beyond harsh words and soft demonstrations of power. At the same time, crude oil is backing up in commercial storage facilities worldwide on the back of increased drilling and weak demand growth. With the economies in the West and the East showing little signs of a quick recovery, demand for oil should remain weak -- sending prices down, not up.
Taking a bath in the oil markets is one of the quickest ways of seeing a fund implode. But despite the countless disasters that have singed traders over the years, many hedge funds and asset managers have taken risky directional bets on the price of crude this summer. One can see this by taking a look at the CFTC's commitment of traders report on crude oil, which tracks the buying and selling activities of money managers and other interested parties in the futures markets.
MORE: In Tiger's demise, a small break for investors
The most recent report released on Friday shows that the number of money managers betting that oil prices will go up in the near future outnumber bearish money managers by a factor of five to one. The overall volume of trading is low given the summer, so the impact of the bullish bets have had a bigger impact on the oil price than they normally would if the market was fully staffed.
Traders cite a variety of reasons for the bet on higher oil prices. There are the geopolitical (a possible supply disruption emanating from an Israeli attack on Iran), the economic (a positive resolution of the euro crisis and a hope for more monetary stimulus in the U.S.), the fundamental (decrease in North Sea oil exports) and the social (everyone else is going long oil so I will too – at least for a while). Each one of these reasons is based on fear (geopolitical and social), false hope (economic) and ignorance of the markets (fundamental).
The markets are concerned about an imminent Israeli attack on Iran's nuclear facilities and the subsequent fallout that would result. The fear is that Iran would retaliate against U.S., Israeli and Arab targets throughout the region, leading to a massive disruption in the supply of oil for months or even years.

The Iran question has lingered over the oil markets for some time now. Every few months there is a new report or a speech from a politician (Israeli, Iranian or American) that spooks the market into thinking war is at hand. What got the market moving recently were bellicose statements from Israeli Prime Minister Benjamin Netanyahu and Defense Minister Ehud Barak. Both said at the beginning of the summer, quite publicly, that they see the window for attacking Iran closing and that they would strike with or without clearance from the U.S.
MORE: Three ugly economic predictions no one wants to hear
The Iran concerns were brought to an apex on August 10th when Haaretz, an Israeli newspaper, reported that Israeli leaders were considering a strike on Iran before the U.S. presidential election in November. The hope was that the "October surprise," would force President Obama into supporting Israel so as to not look "weak" in front of the U.S. electorate.
But this fear of imminent attack has been alive for ten years now. It was August 14, 2002 that the world first learned that Iran had a clandestine nuclear program. The Iranian regime claimed that the program was for developing nuclear power, not weapons, but the markets never really believed that then, and doesn't believe it today.
Like the boy who cried wolf, this whole issue has become stale and clichéd. Nevertheless, the fear of a Mideast war is just too great to dismiss, no matter how ridiculous it may seem. This has kept a premium, like insurance, on the price of oil for a while, which analysts speculate to be worth somewhere in the range of 10% to 20% of the price of a barrel. The premium fluctuates based on the headline risk as no one wants to be caught short if an attack comes. This explains why the oil markets have had a long bias for some time now.
But at a five-to-one margin, the proverbial pendulum seems to have swung too far over to the bullish side of the market. The latest boost in the oil price would suggest that war is just around the corner, yet that is hardly a certainty. For one, there are conflicting statements coming out of the Israeli government on this topic (as always). Just last week Shimon Peres, the President of Israel and the former Prime Minister, told reporters that he has great confidence in President Obama and that Israel would not attack Iran without U.S. help. The U.S. has maintained that an attack on Iran would only be considered after all diplomatic avenues have been pursued.
MORE: Forget Washington: Here's how we'd fix the economy
In the meantime, the U.S. will hit Iran softly, as it has through the release of computer viruses into Iran's nuclear facilities or through enforcing economic sanctions. Iran's economy has taken a hit this year after the U.S. got serious about cracking down on banks that help Iran sell oil to its neighbors. This has led to the near collapse of Iran's currency, creating internal dissent. Brigadier General Massoud Jazayeri, Iran's Deputy Chief of Staff, told reporters last week that Iran and the U.S. had entered a stage of "total economic war." That is probably as far as things will go here. If the conflict turns from cold to hot, and Iran strikes back hard against an Israeli attack, its economy would almost certainly collapse as the U.S. would shut down Tehran's ability to export any of its oil (80% of its GDP). While some might consider Iran's ruling clerics and generals to be irrational, they aren't that irrational as to make the nation's economic problems go from bad to terminal.
In any case, President Obama and UK Prime Minister David Cameron have signaled that they are not going to let oil prices rise indefinitely on this issue. Both have said that if oil prices rise high enough that they will authorize a release of oil from their strategic reserves. This has Saudi Arabia and the International Energy Agency up in arms. Both say that the market is well supplied and that it would be a mistake to dump product on the market to put an end to financial speculation. While that may be true, the U.S. election this November changes the equation.
Such a release, even a small release, would act as a toppling counterforce to the oil bulls, swinging the market pendulum hard and fast from long to short. That's because, believe it or not, the world has a lot of oil in storage already and demand is weak. The IEA reported that inventories in the developed world have built above normal in the first half of the year, with commercial crude stockpiles at 82.4 million barrels. That is more than double the five-year average of 37 million barrels.
MORE: Why AIG is still the market's scariest stock
Meanwhile, growth in demand has come nearly to a halt -- the usual increase in oil demand from developed nations is now being offset by an almost equal decrease in demand from developed nations. For example, in the U.S., petroleum consumption was down 2.7% in July compared with the same time last year. Gasoline demand was down 3.8% during that same time period. That has to do in part to the sluggish economy, but it also has to do with how Americans live their lives today. Sustained high prices have caused people to permanently change the way they use oil, like shifting to more fuel efficient cars. This means the U.S. needs less oil to maintain the same level of productivity – a clearly bearish signal for oil prices.
There are dozens of moving parts to consider when betting on where the oil price will go next. Any number of triggers can cause the market to wake up and reverse all of its gains and then some. With war with Iran highly unlikely, it is difficult to argue that prices will climb higher than they already have. That leaves the market vulnerable to a fast and furious downslide. Money managers may be looking for an "October Surprise," but it is more likely to come from a bull-crushing release of oil from strategic reserves than from a long-shot bombing raid by Israeli F-16s.
W@G2 08/22/12 for a 08/24/12 close
W@G1 08/20/12 for a 08/22/12 close {Chart Added}
67.89 Kookiekook
67.25 rayrohn
67.22 Farooq
67.07 paulgmx1


