 News
News  Market Data
  Discover
Support: 888-992-3836
Copyright © 2023 InvestorsHub Inc.


learningboutinv
![]()
Register for free to join our community of investors and share your ideas. You will also get access to streaming quotes, interactive charts, trades, portfolio, live options flow and more tools.
Register for free to join our community of investors and share your ideas. You will also get access to streaming quotes, interactive charts, trades, portfolio, live options flow and more tools.
John is that intraday P/C @ 3.5?
Gleno, I have 40.80 as a sell signal for QQQQs on the Renko system.
OT - LOL, is that why everyone seems to have a ton of tattoos because they can't get a tan from lack of sun?
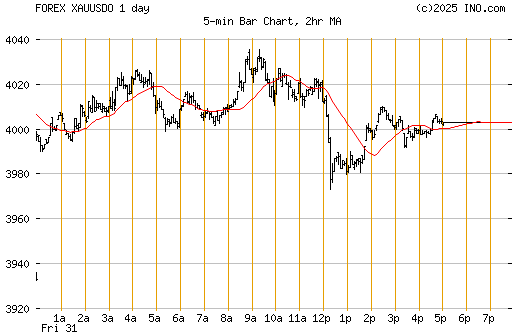
Gleno $GOLD is the symbol. But it's End of Day. I tend to look at the Gold Futures contract which is currently at 897 since I look at the DGP and DZZ 2X ETN Gold contracts.:
http://quotes.ino.com/chart/?s=FOREX_XAUUSDO&t=f
Gleno, looks like fill the gap back down? But the IT has turned back to up? Per renko... QQQQ
http://stockcharts.com/h-sc/ui?s=QQQQ&p=D&yr=3&mn=0&dy=0&id=p34570960094
BTW - just got back from my climbing trip over at Smith Rocks and am catching up. What the hell it's suppose to be sunny in the desert over at East Oregon, Sunshine 350 days/year. Well it rained and dumped hard on us. You could see a ton of smoke from the fires out there, it was really hazy and the clouds were pretty dark.
April2000 - Sep2001 market correlation to present time.

Foot, $NDXHILO is about to hit "0" again. That was the bottom the last couple times.
Do or die for the nasties... I hope this line holds or else...

Gleno, the inv. h+s failed when we crossed back down below the 41.25 neckline. Looks like they really want -100 $COMP.
Definitely worth a look for Gold. Especially with the $USD weakening after hitting rez @ ~80.
I think it may be possible to see the USD hit 76 again.
>
Gleno, I see an inverted H+S on the 5min QQQQ which could target 42. I wonder... could it be possible to do the impossible?
Gleno, so far two new highs on the Nasdaq. The VIX:VXV chart that mvpsignalsystem posted is also close to a bottom @ 1.254 yesterday. Same with the NYHL:NYTOT ratio that someone else posted here a while back.
http://stockcharts.com/h-sc/ui?s=$NAHGH&p=D&yr=0&mn=6&dy=0&id=p59328716596
http://stockcharts.com/h-sc/ui?s=$NYHL:$NYTOT&p=D&yr=7&mn=0&dy=0&id=p81248029963&a=145621086
http://stockcharts.com/h-sc/ui?s=$VIX:$VXV&p=D&yr=1&mn=0&dy=0&id=p98778759717
Yeah... I think today or tomorrow should be it for this downside burn. Look at the fear. (But that doesn't mean we can't get to 40 on the QQV and the VXN, and if I remember correctly during the tech bust we saw 50 on the $VIX). Hopefully it doesn't come to that as this is an election year, may be after the election is over. LOL...
Foot,
I wonder if the AB=CD is it for this sell off. (Although $NDX has overshot on the downside by ~25 points @ 1650.)
For $NDX A started at the top in Early June, @ 2055.82. B - at the July bottom - 1761.08 = 294.74. Doing a measured move, which is approximate 295 taking 6 weeks to the bottom, we have C at the August top 1973.56 - 294.74 (the measured move) = D 1678.82 for the down target of this burn.
So AB=CD, D being 1678.82 and BTW that took 6 weeks also from the August top, so could this be it for the downside burn?
Yup I remember. Those were some painful times, at least for me. I lost a lot of dough during that carnage. They won't be getting me twice though. BTW- Goldilocks is up big! ~11% +$84. Wish I was watching earlier before the break!

Gleno, getting closer to -100. Currently @ -93 on the Comp.
Wow just checking back in. At this rate we could see a -100 $comp day.
Gleno, did you open some more shorts at the end of yesterday? (per scamman's rules). He's one smart dude and I miss his posts. I wonder if he ever started up his own blog.
Gleno, I think I am going to sit this one out. I just don't have time to watch it ST at the moment. Plus I will be leaving Thursday morning to go climbing over at Smith Rock in Terrabonne.
BTW - I looked at the last FOMC announcement and Fed after day pattern in Aug. It appears that 8/5 we closed up, but the next day we were down in the morning but ended the day up. That could also be a possible scenario.
RCKS, thanks for the clarification, and sorry about the mis-information. I only read the headline/title cause I didn't have time to read the entire story.
Gleno, personally I'd prefer that we "El Crasho" today because I'm rooting for a bounce after OP-Ex. I would hate to see the market crash before elections. You know how that will affect the public. (Did you see the HP news on cutting 1/2 its workforce? 25K jobs gone over 3 years.) They (joe q public) will all want handouts and then you'll know who will definitely win.
Jake, if we look like we are going to close green I'll buy back some of the shorts I closed yesterday. I'll just have to see what happens between the infamous 15:30-15:45 time frame.
Oh crap... Wasn't paying attention in the office working right now. Just logged on and am looking at the 1min chart.
Taking $COMP as an example with the 1 min chart:
At 14:15, we went down after the announcement. (Remember the Fed announcement pattern move lasts 15-20mins and then the market does whatever it wants)
So we went down at 14:15 and at 14:26 bar we went up. Followed by down at the 14:32 bar. At 14:38 the FOMC announcement pattern finished/completed (down-up-down). Now the market moves whichever way it wants and where it closes (right now it looks up) you take the opposite trade, hold over night for tomorrow.
Great... everyone is watching, I'll have trading nerves now. May be I should sit this one out.
Scamman says there's a high probability on the fed next day pattern to trade opposite of the FOMC announcement end of day close. But at the same time I am torn between trying a small speculative trade and waiting and watching for the next turn. I'll decide if I'll trade the Fed next day pattern 15-20 mins after the announcement since that is when the market stabilizes from the volatility swing and begins carving out a ST trend.
Foot, interesting article on ETN vs ETF.
Since the first exchange-traded note launched in 2006, we've been reminding investors that ETNs are debt notes. And as debt notes, if the underwriting bank goes bankrupt, you lose out. That may happen with Lehman and its trio of Opta-branded ETNs, unless another firm steps in to make good on the promises, or the notes are otherwise excluded from the bankruptcy filing.
BTW - Most commodities are traded via an ETN vehicle such as Gold (DZZ, DGP), Oil (DTO), Agriculture, livestock, etc.
http://investorshub.advfn.com/boards/read_msg.aspx?message_id=32195949
A list of some commonly traded ETNs:
http://seekingalpha.com/article/30369-commodity-etfs-and-etns
Gleno, $VXO is out of BB and is almost at Jan 08 highs.
Gleno, ideally I would prefer the down/up/down pattern for today and then up or tomorrow, followed by up during the Bradley turn date/time of month or end of month. But, if instead the reverse occurs per Neutralman's forecast, then we could be down all the way to the election. BTW - the next bradley turn isn't til December. (12/14 to be exact). Talk about "There will be blood".
(Edit - I think I will try to play a small position for fed day after pattern tomorrow. Meaning if after the FOMC announcement is up/down/up and we close up; then I'll short into the close for a drop tomorrow. Alternatively if after the announcement we are down/up/down, and we close red; then I will buy a small QLD position for a bounce tomorrow.)
Foot, LOL... I learned my lesson trading against the trend. It's almost a 50/50 coin toss most of the time as bounces off the downtrend were typically a 1/3 or 1/2 of what I'd expect. So, it's only brought me pain and anxiety especially overnight. I'm not gonna touch the buy "long" button until after I see an Interim-term turn around. At this juncture, my system says no longs until we hit or cross above 44 on the QQQQs if the low of day is in.
So I will just watch but I won't touch. Meanwhile I'll have to see if I can gauge how much downside we have left so I can exit the rest of my shorts.
Foot, at least we closed that gap from 7/17. Wouldn't be surprise to see a retest of the bottom/double bottom effect.
Yup... NAMO getting close to a bottom, along with $VXN/$QQV
http://stockcharts.com/charts/indices/McSumNASD.html
Close to 35 Bottom on VXN? and 33 for QQV? Also coincides with March08 double bottom on $NDX? and Bradley turn date on 9/20 +/- 3 days, and time of month/end of quarter ramp? (At least that is what I am going to look for.)
Wow... this may be a -80 $comp day. Maybe I should've waited. Geez... BTW, FOMC announcement is 14:15EST
http://money.cnn.com/data/irc/index.html?view=1&focusdate=9/16/2008&miniCalFocus=9/16/2008&cal=50&
I am going to sit tight and wait for the next IT turn. This is just plain "nutz" as crammer would say. Wild swings til close today and tomorrow with the Fed day and after day pattern.
Tomorrow at 14:15.
Just got rid of 50% of my shorts. I feel a bit better now.
Gleno, I think we re-test the lows this morning. But what do I know. I posted the symmetrical triangle as a reminder to myself to trade the signals. (Didn't add more to my shorts cause I am really short from Thursday and Friday and I want to be able to sleep at night.)
I think if we retest the lows of the morning I will unload some shorts.
Symmetric triangles are continuation patterns. Note the breakdown on the QQQQs.

http://stockcharts.com/school/doku.php?id=chart_school:chart_analysis:chart_patterns:symmetrical_triangle
5 min symmetric triangle formation on the QQQQs. Watch for the break.

No didn't add to my shorts. Trying to figure out if they will try to close the gap today.
Gleno, looks like they are trying hard to close that morning gap.
Hmm Lehman brothers on sale on Ebay?
http://investorshub.advfn.com/boards/read_msg.aspx?message_id=32165320
Still 5 1/2 days to get your bids in.

