News
News  Market Data
  Discover
Support: 888-992-3836
Copyright © 2023 InvestorsHub Inc.


gitonwithit
![]()
Register for free to join our community of investors and share your ideas. You will also get access to streaming quotes, interactive charts, trades, portfolio, live options flow and more tools.
Register for free to join our community of investors and share your ideas. You will also get access to streaming quotes, interactive charts, trades, portfolio, live options flow and more tools.
I think double top definitely in the works for rut. All those previous inflection points lining up tho spells trouble ahead and end of cycle. I'll play around with the weekly and see what week it is due
Someone is gonna stand up and yell fire in the RUT chart movie this month. This is RUT monthly and not EURAUD.

Check out the second chart in this article
http://www.zerohedge.com/contributed/2013-06-08/day-big-fat-junk-bond-bubble-blew
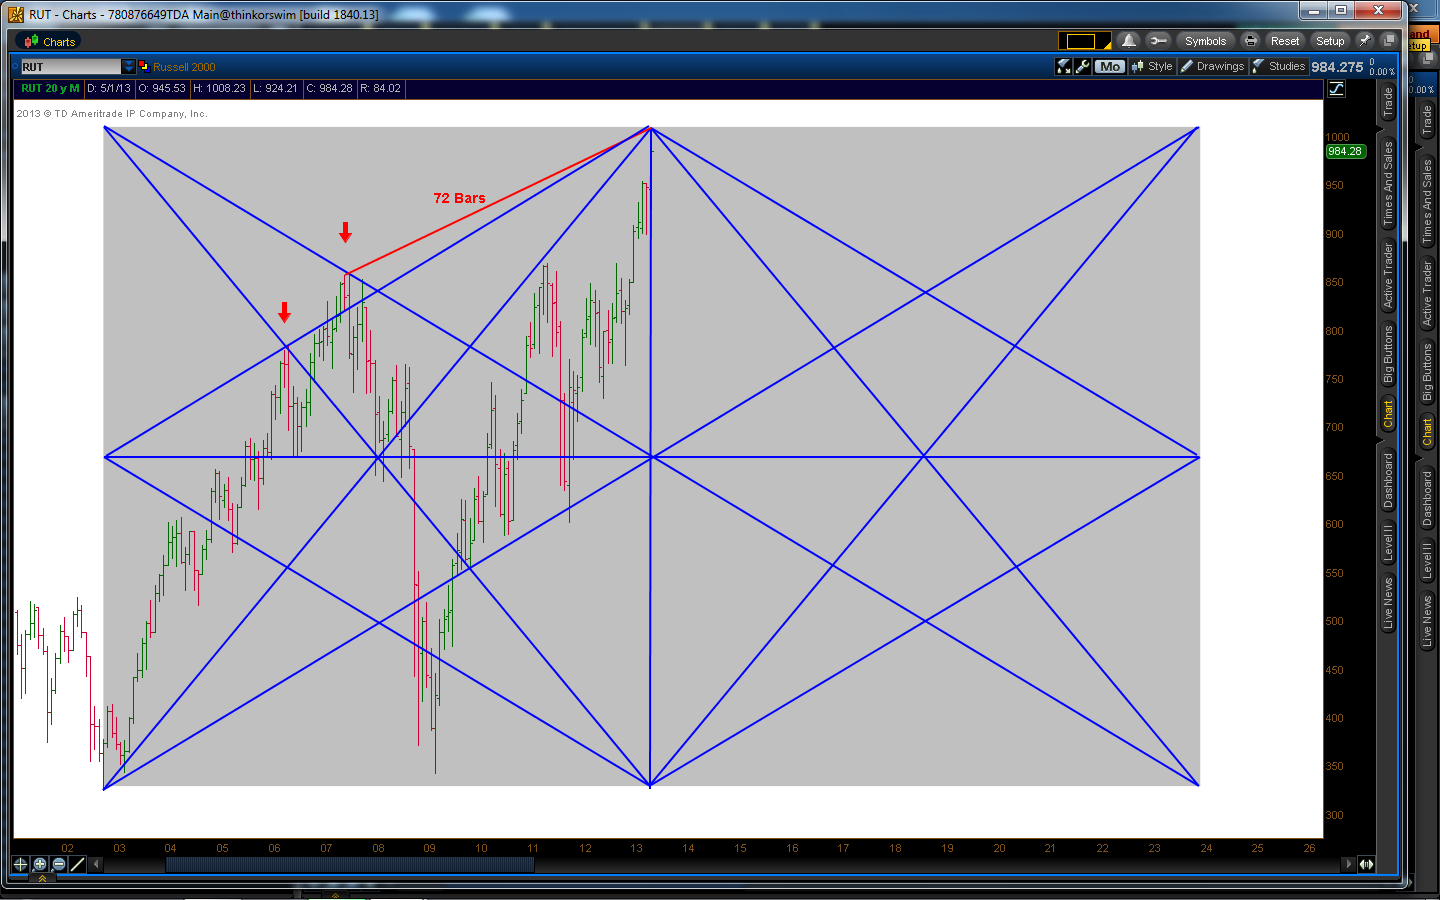
I really think that was a little short covering rally on Friday too. Bunch of jacked up stuff, metals down big and equities up and /DX down some I think too. Looking at the chart of /DX it look like a descending triangle on the monthly but I think gonna be more like 3 pokes and fly. Believe us to be 72 bars on the RUT monthly from the previous top too.
I refinanced too about 3 months ago to a 20 year from 30 year. Saved about $150 a month and 60 or so payments. Right close I was to doing a 15 year but with the way things are I thought safer to do the 20 and just keep paying the same amount as I was before. Higher rates sure to put a damper on any thought of a recovery though whatever the reason. I usually read www.mortagenewsdaily.com about once a week just to stay informed and they were expecting them to go down on Friday but they went up instead. Would think something based in fact would cause it but I'd just be speculating on what it might be. Hell that's a 25 percent change in a very short amount of time! Lots of inflows and outflows around the world that change things under the surface without being readily identifiable so guess we will find out in time.
Hey SG, yeah they don't know either I see. They say "concerns" about Fed taper caused it but I'm not sure that's anything more conjecture. I'd figure it to be a fairly solid mathematical relationship between bond prices and rates but I really don't know enough about it.
Anyone have thoughts on what is the root cause of the spike in interest rates? Yesterday 30 year rate was 4.125! It takes a pretty big SOMETHING to cause a move like that in a market that big and I really haven't read anything significant outside of the normal websites devoted to financing a house.
I'm sure there are all sorts of possible reasons but the biggest thing that I can think of is that QE stopped. If we've had very high demand from the Fed in bonds then that makes the price go up and keeps the yield down. If the demand were to suddenly diminish then the price would go down and the yield up. Hard to see a correlation with Japan markets in terms of repatriation or money moving out of Japan and into US bonds either since that should cause bond prices to go up and rates down too I would think.
Anyone have other thoughts about the reasons?
Shanky has some good charts up today. RUT less than 500 Ill certainly take
http://shankystechblog.blogspot.com/
I've been thinking about the take on nfp on both sides and given good news I can see the taper thought and given bad news I can see the taper thought too. Given what we've seen in Japan I think either one will be negative for stocks. More qe would almost certainly IMO impact corp profits and especially the consumer. They've "supposedly" kept the lid on inflation so far but it depends on which statistics you look at.
With Japan it's hard to pin down the cause but look back at 2008 and look what happened
http://www.reuters.com/article/2008/10/10/markets-japan-jgb-idUST17770820081010
Maybe it's a loss of faith, maybe it's safety, preserving assets, liquidation, margin calls, who knows. So assets coming out of Japan cause a bid where? Bonds, equities, treasuries, metals? Who knows
/DX down 1.5 points and equities down too. Wheels are coming off the bus fast so I would be very careful here guys if this unravels anymore. With this type of un correlation I can see NFP be a catalyst for more dysfunctional behavior no matter what the print tomorrow.
I think not to be long until first of October and probably half this box to be had on the short side although I'll probably be out before then. Started by drawing line from one corner to the opposite corner to see if the previous cycles matched up. 175 is a very important Gann cycle in the dark rectangle but regardless you can see the 1.5, 1, 1.5 cycle. Could probably draw some third or half cycles and see what and when comes next I think.

Nikkei good example of what could happen to us equities. Incredible rise in Interest rates above 4 percent on 30 year. All those billions in Pomo and it hasn't done one damn positive thing for the economy. Must be a crappy feeling to be the head of the federal reserve and find ones self schooled in economics like this
In the link below I read that there is a 77.2 percent chance of a decline of at least 5 percent after a Hindenburg omen. That's pretty good odds so we shall see. Always chance of double top too.
http://www.safehaven.com/article/3880/the-past-performance-of-the-hindenburg-omen-stock-market-crash-signals-1985-2005
I think so. Today also was Hindenburg Omen. Whether true or not its still an interesting read
http://en.wikipedia.org/wiki/Hindenburg_Omen
5 billion in Pomo funny money. No telling what the last two red weekly candles cost. Next week we get crimson red instead of just red. Great article on zerohedge if you get a chance to read it. Can't remember the name exactly but it's the one about the broke carnival and wc fields
Yeah this is what neutral looks like. Gotta go there before switching gears.
Believe so too. Daneric seems to think that yesterday high was a mini wave 2 and I wholeheartedly agree. The full 5 waves should take us down to the bottom trend line on the weekly and a bigger wave 1. I'm short and sticking with it for a while. 1008 is an important number for rut.
Here's a daily RUT.

RUT Weekly. Time for a healthy retrace I think. Not convinced we've seen the top yet based on this however there are 72 monthly bars from the old high.

Hey thanks Pennies! I must need a different broker I guess to get that or have more money in the account. I did figure out a way through the history import and although I can't change the name of the pair I replaced it's history with RUT csv from Yahoo and opened it offline. Amazing how high EURAUD got over the weekend lol!

Pennies how are you getting s&p data into mt4? I haven't opened mt4 in a while but it would be my favorite platform if I could look at virtually anything with it and use my custom stuff. Does your broker provide the feed?
I found this method of creating history files but haven't tried it yet. Wondering if this is what you are doing
http://forum.mql4.com/8618/page2
For the sake of a lot of things more important than my little account the shit need to hit the fan. We haven't seen things get out of hand yet but no stop to this ridiculous market could cause it fast. Idiots playing with stuff they don't understand because they got no popular answers to the problem at hand.
I say it too P!! Crunch n munch baby. From my phone it look like it took 5 min to go from +100 to + 60
Yes indeed jav. A version of that came through here last week and looks like round 2 may be on the way
I'll take it! Been holding short the last week or so I'd say about time for some red to go with the green candles. Lotta red I think
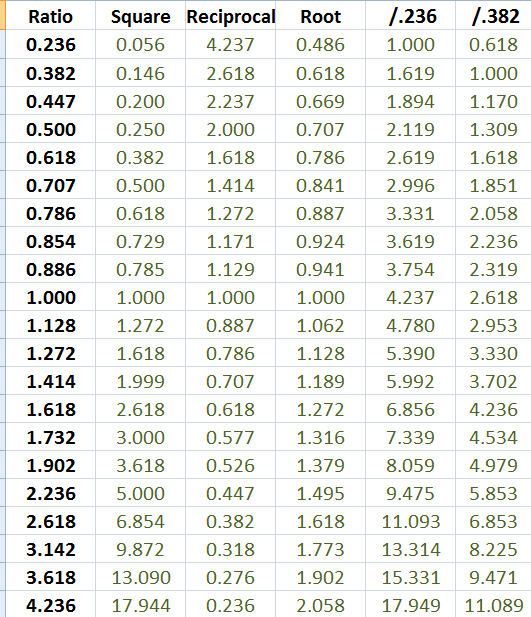
Here's a RUT SQ9 time chart by fourths and halves. Contrary to where I personally think this ought to be it looks to be a good possibility that this run lasts until the first or second week of July. The low on 10-3-11 at 601 matches so perfectly it even covers up the bar.
It stopped almost exactly at the 1.272 so I'm GUESSING maybe stop here and piddle for a while before it really sink the first of July or maybe go on to the 1.414. I'd suspect RUT at 1000 would have some serious mental resistance implications although nothing is sane IMO right now anyway!
Another possibility is that the cycle gets interrupted with a larger cycle like on the monthly or even something calculated in years and the sucker drop 100 points on Monday lol. I'd like that option. A lot.

I think expanded here is the only explanation. Wanted to play with some circles today but had tornadoes last night so lots of cleanup with work today. Everyone I know is ok but I've been up since I posted that so ill catch u later.
Here's a great post from daneric that makes a whole lot of sense both in terms of gann and Elliot wave theory. Love that circle he's drawn there and if you took the left side/center down to the low at 1074.77 you would have the 90 degrees price and time I believe. Don't need any fancy tools just circles and lines!
http://danericselliottwaves.blogspot.com/2013/05/elliott-wave-update-15-may-2013.html
I think stick a fork in it!

Yup big move baby. Up she goes along with the consequences. $2 billion Pomo today couldn't even buy a doji.
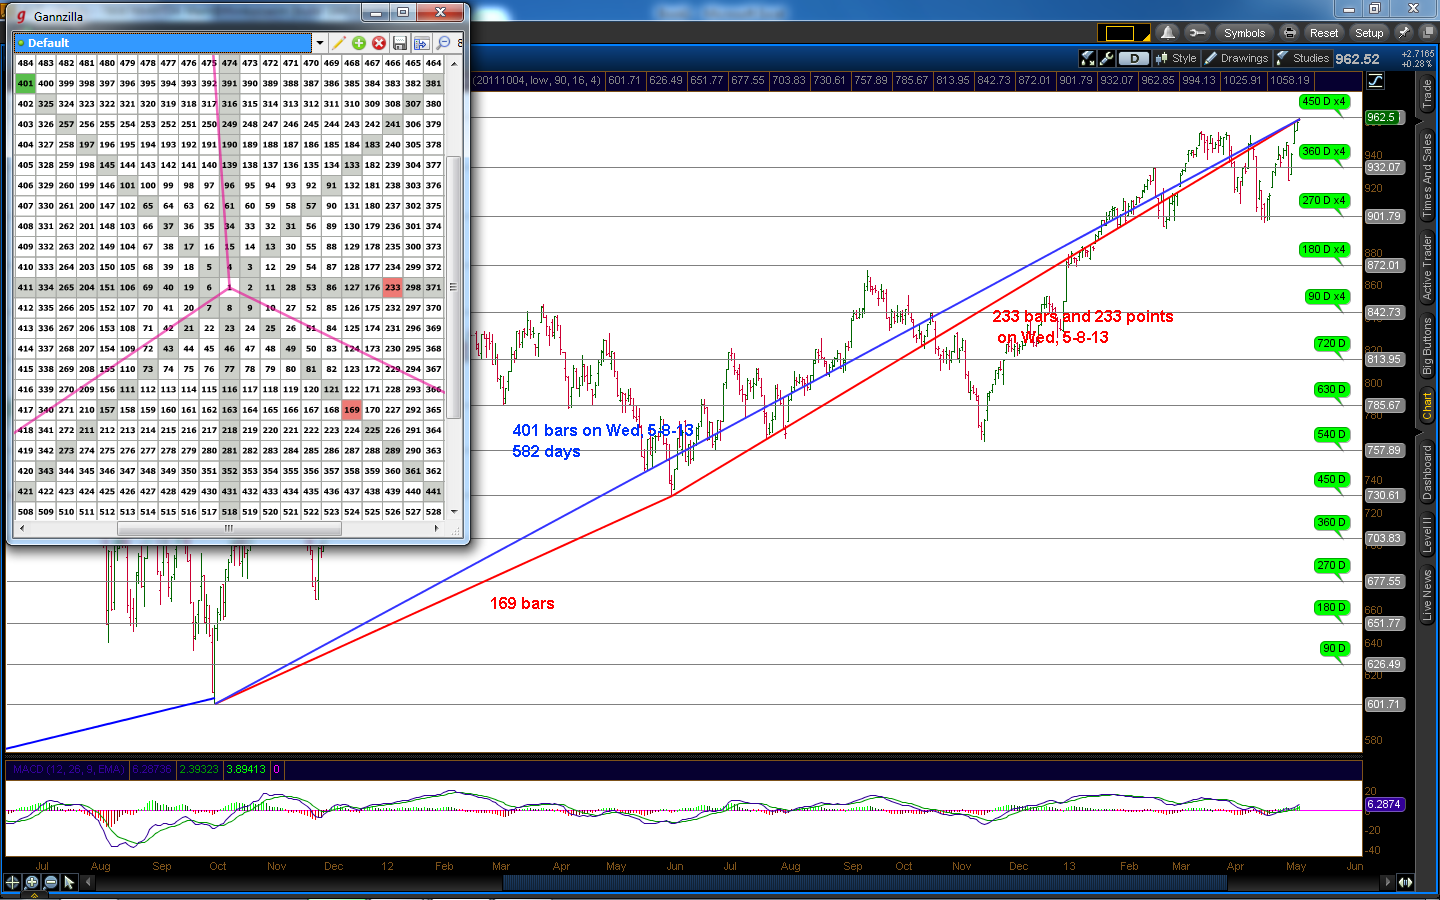
This is my RUT chart, would think DOW fairly similar. One of the ways to square price and time is price=time and you can see in the red line we have 122 bars and then the blue line 122 points so 122 bars = 122 points. The black line is 102 days and the green line is 101.91 (102) points. Plus the two previous tops are 60 degrees apart and here we have 360 degrees from the red top. Gann mostly preferred calendar vs trading as the rule but I see them both work from time to time. For them both to be here at the same time is enough for me. I'm staying short for quite a while I think, have some ideas about how long this will last but I think it's going to last well long enough for SRTY to double or maybe triple from here.
Edit: also forgot to mention today's last minute move to 970 made that upper trendline in blue is a perfect hit.

Went triple short RUT today. Tomorrow equity bulls bail water with both hands and 5 gal bucket. You guys take it easy!
Hi all, hope someone can help me with this. To shorten a long story I am looking for Gann squares of price and time and I had this "sorta" working a few days ago with an if statement after the plot and I have been tinkering with the scan but am still missing something. I thought it should have turned up something like this INTC chart at the bottom (109 bars and the low being 90 degrees from today's high). Any ideas on what I keep missing?
 input Deg = 90;
 input Rotations=0;
 input SQ9=109;
 def RHigh=High[SQ9];
 def RLow=Low[SQ9];
 def HSQ9=Sqr(Sqrt(RHigh) -((Deg/180)+(Rotations*2)));
 def LSQ9=Sqr(Sqrt(RLow) +((Deg/180)+(Rotations*2)));

 plot a = RLow==Lowest(low,SQ9) and High==Highest(high,SQ9) and AbsValue(RLow-HSQ9)<0.5;