 News
News  Market Data
  Discover
Support: 888-992-3836
Copyright © 2023 InvestorsHub Inc.


zsvq1p
![]()
Register for free to join our community of investors and share your ideas. You will also get access to streaming quotes, interactive charts, trades, portfolio, live options flow and more tools.
Register for free to join our community of investors and share your ideas. You will also get access to streaming quotes, interactive charts, trades, portfolio, live options flow and more tools.
Gap to fill?

I agree, don't look at USO to achieve a return equal to WTIC. This is a daily follow. In fact, no ETF can follow spot WTIC price for all I know.
Funds like XLE and ERX follow energy company stock indexes, not WTIC. These do trend with oil price and I do believe are the best ETF if you beleive oil prices will increase.
Why does this ETF not follow WTIC? because is about futures, not spot.... see the below...

Comparing YTD 2011 xle, uso and WTIC..

At some point, natural gas is going bull.
When?
Now might be a good time to plan to buy a set $ amount every month for a good average.
YTD Slippage is about 7%

Investorshub UNL
Pennsylvania launches natural gas drilling fee Mon Oct 3, 2011 2:51pm EDT
(Reuters) - Pennsylvania on Monday announced plans for new levies and stricter rules for natural gas drilling, which has been blamed for contaminating local water supplies.
Governor Tom Corbett proposes to slap a potential $160,000 "impact fee" on each well drilled, which would be used to improve infrastructure and promote the use of natural gas vehicles in the state.
"Estimates show that this impact fee will bring in about $120 million in the first year, climbing to nearly $200 million within six years," Corbett said in a statement.
Each well will be subject to a fee of up to $40,000 in the first year, $30,000 in the second year, $20,000 in the third year and $10,000 in the fourth through tenth years, the statement said.
Pennsylvania is at the center of a U.S. natural gas drilling boom, thanks to a drilling technique called hydraulic fracturing, or fracking, which releases gas in shale rock by blasting deposits with chemical-laced water and sand.
Pennsylvania is home to a large portion of the Marcellus shale, the country's largest deposit of shale gas.
But the contamination of local water supplies by drilling fluids in Pennsylvania has led to calls for stricter regulations. In neighboring New York state, fracking has been banned while its effects are considered.
The proposals were put forward by the Marcellus Shale Advisory Commission, which was formed by Corbett in March. Under the recommendations, the distance of drilling sites from private water wells will increase from 200 feet to 500 feet and to 1000 feet from public water systems.
The required distance from streams, rivers and ponds will increase to 300 feet from a current 100 feet.
The penalty for civil violations, such as spills or contaminating water supplies, will double to $50,000.
Revenues from greater fines and well fees will be used in part to fund a construction of natural gas refueling stations and natural gas vehicle fleets for mass transit systems.
Venezuela's Chavez eyes new oil cartel
(AFP) – 1 day ago
CARACAS — Venezuelan President Hugo Chavez proposed creating a new oil exporters group parallel to OPEC that would include only the "giants" of global petroleum producers.
Chavez made the comments on Thursday, while hosting Russia's Deputy Prime Minister Igor Sechin and Energy Minister Sergei Smatko, saying the two countries could be part of such a super-cartel.
"I had an idea, create a new organization... of petroleum giants," Chavez said during a cabinet meeting broadcast on radio and television with the Russian officials present.
"We are not more than four or five" countries, he added.
He said that "Russia and Venezuela are two of the oil giants of this planet" and that such a super-cartel could co-exist with the Organization of Petroleum Exporting Counties.
The approach "would not at all mean that OPEC would suffer. OPEC is an organization with a history, with a profile, with a path, and Venezuela has played and will play a very important role," added Chavez.
A founding member of OPEC, Venezuela produces an average of three million barrels per day. It was the world's eighth biggest oil producer in 2009, according to the International Energy Agency.
Venezuela said in January it had dethroned fellow OPEC member Saudi Arabia to become the nation with the largest proven crude oil reserves in the world, at nearly 300 billion barrels.
Commentary: Where to next for oil — $50 or $100?
Commentary: Analysts see oil headed higher but the question is when
SAN FRANCISCO (MarketWatch) — The U.S. oil market has been struggling for the last five months to get itself back above the $100-a-barrel level, but it doesn’t have to look very far to find the fuel it needs to do it.
Demand growth in emerging markets, high global oil prices, smaller spare production capacity from the world’s big oil producers and further political tensions in the Middle East and North Africa are just a few good reasons why many analysts expect oil prices to head higher in the long term.
But just when they begin that turn higher is a much more difficult thing to predict.
A quick look at a chart of oil prices traded on the New York Mercantile Exchange paints a clear picture of crude’s inability to regain the heights it had during the height of the tensions in the Middle East and North Africa earlier this year.
Crude-oil futures /quotes/zigman/2075833 CL1X +0.34% ended last year at $91.38 a barrel on Nymex, then climbed 25% to a high near $114 by the end of April and sank 34% to trade back below $76 this past week.
“The market is seeing some deflation from aggressive expectations about the possibility for fourth-quarter [supply] tightening, which were predicated on a continued outage of Libyan crude supplies and somewhat robust demand growth,” said Michael Lynch, president of Strategic Energy & Economic Research.
And at the moment, “the reversal of those expectations, along with commodity deflation in general, is leading investors to move away from oil,” he said.
Oil’s settlement below $76 on Tuesday was its lowest closing level in more than a year.
“Oil has had a wild ride with the trend clearly down,” said James Williams, an energy economist at WTRG Economics, but for the rest of the year, a price near the current level is most likely.
Problems in Europe or with the U.S. economy could drive them lower, while they could rise if the Saudis cut too much production in anticipation of the return of Libyan output or if there are further uprisings in the Middle East and North Africa, he said.
Nymex crude’s out of touch
The $80 or so crude price seen on Nymex, however, doesn’t really reflect the true prices paid for oil so they’re not really as low as they seem, and prices for oil products haven’t dropped much either.
Brent crude on London’s ICE Futures exchange has traded above $100 for the bulk of the year.
“Nymex oil prices are somewhat unrepresentative of global oil prices,” said Dan Gundersen, vice president of energy finance for Sandstorm Metals & Energy /quotes/zigman/596895 CA:SND +2.44% /quotes/zigman/596897 STTYF -3.53%
The disparity between world oil prices — benchmarks such as Brent and Nymex oil prices has “increased dramatically over the past year or so with the current spread exceeding $20 per barrel, and an unprecedented spread of over $26 a couple [of] months ago,” he said.
That’s mainly due to regional supply and transportation issues at Cushing, Okla., the delivery hub for Nymex crude. “There is a glut of landlocked oil around Cushing that is commanding a lower price than worldwide prices,” said Gundersen
The PR for a Foward split 2 for 1
Share Splits of One ETF; Reverse Share Split of Three ETFs
Bethesda, MD, September 27, 2011—ProShares, a premier provider of alternative exchange traded funds (ETFs), announced today a share split on one of its ETFs and reverse share splits on three of its ETFs. The split and reverse splits will not change the value of a shareholder's investment.
Split
One fund will split shares 2-for-1.
Ticker Fund ProShares UltraSilver*AGQ
Split Ratio 2:1
The split will apply to shareholders of record as of the close of the markets on October 10, 2011, payable after the close of the markets on October 12, 2011. The fund will trade at its post-split price on October 13, 2011. The ticker symbol and CUSIP number for the fund will not change.
The split will decrease the price per share of the fund with a proportionate increase in the number of shares outstanding. For example, for a 2-for-1 split, every pre-split share held by a shareholder will result in the receipt of two post-split shares, which will be priced at half of the net asset value ("NAV") of a pre-split share.
http://www.proshares.com/resources/news/proshares_announces_etf_share_splits_09272011.html
haven to safety
What would be any causes for silver to go down?


Silver scares me too.
I think people will buy US treasuries in slowdown. It is the perception of safe. All those 401K have one place to go. That is Treasury funds that pay interest. Even if it is low %, people will get out of stocks. Foreign investors will buy the treasuries too. That means they buy a dollar to then purchase the treasury.... I think that is what we are seeing now. And people are fearing a down cycle.
These guys think demand for silver will drop in industry.
Silver Loses Safe Haven and Industrial Appeal
The Bedford Report Provides Equity Research on iShares Silver Trust & Great Panther Silver
Press Release Source: The Bedford Report On Monday October 3, 2011, 8:16 am
NEW YORK, NY--(Marketwire -10/03/11)- September was not a kind month to Silver stocks, as a stronger dollar took away much of the metal's allure. Additionally, a slowing global economy has crimped industrial silver demand. The Bedford Report examines the outlook for companies in the Silver Industry and provides equity research on iShares Silver Trust (NYSE: SLV - News) and Great Panther Silver Ltd. (AMEX: GPL - News) (TSX: GPR.TO - News). Access to the full company reports can be found at:
www.bedfordreport.com/SLV
www.bedfordreport.com/GPL
Silver's dramatic September free-fall has been attributed to a weakening trend in the Asian region on speculation that European governments will find it difficult to contain the region's debt crisis and reverse gains registered by the US dollar against the euro, eroding the demand for precious metals as an alternative investment. Precious metals prices tend to move inversely to price of the dollar, as they lose their "safe haven" appeal.
Compounding the problems for silver stocks are heightened fears of a double dip recession. According to the Silver Institute more than 50 percent of Silver's use is industrial. With the economy slowing -- last week Citigroup cut their global gross domestic product forecasts for 2011 and 2012 as growth prospects "continue to deteriorate quickly" -- manufacturing use for silver could drop.
The Bedford Report releases stock research on the Silver Industry so investors can stay ahead of the crowd and make the best investment decisions to maximize their returns. Take a few minutes to register with us free at www.bedfordreport.com and get exclusive access to our numerous analyst reports and industry newsletters.
Silver mining stocks -- which have underperformed silver prices all year -- are also struggling. "Concerns about a possible hard landing for the Chinese economy have weighed on mining stocks," David Jones, chief marketing strategist at IG Index, explains. "It is difficult to see a catalyst for further gains in the short term."
Great Panther Silver Limited engages in the acquisition, exploration, and development of precious and base metal properties in Mexico. Last month the company announced the discovery of additional high grade silver-gold mineralization in an extension of the Cata Mine in the core of the Guanajuato Mine Complex.
The Bedford Report provides Market Research focused on equities that offer growth opportunities, value, and strong potential return. We strive to provide the most up-to-date market activities. We constantly create research reports and newsletters for our members. The Bedford Report has not been compensated by any of the above mentioned publicly traded companies. The Bedford Report is compensated by other third party organizations for advertising services. We act as an independent research portal and are aware that all investment entails inherent risks.
Please view the full disclaimer at www.bedfordreport.com/disclaimer
This ETF just lack volume to take a risk.
Short both UCO and SCO for the past year you are up 17%
Date	Initial investment	Short PPS	Share sold short	cost	Date	Cover buy PPS	Cost	Earnings	%
 4/6/2011	$1,000	$41.64	24.01536984	 $1,000.00 	 9/31/11 	$27	$651	…………….	……………..
 4/6/2011	$1,000	$64.90	15.40832049	 $1,000.00 	 9/31/11 	$65	$1,005	…………….	……………..
 ………………..	…………………	………....……	net: 	 $2,000.00 	 ……………. 	net:	$1,656	 $344.03 	17.2%
I guess you don't have to use margin on that trade... This post may be hard to read... But shows your return had you shorted both for the following months.
This is 6 months! 38%
Date	Initial investment	Short PPS	Share sold short	cost	Date	Cover buy PPS	Cost	Earnings	%
 4/6/2011 $1,000	 $248.07	4	 $992.28 	 9/31/11 	$104	$415
 4/6/2011 $1,000	  $20.92	48	 $1,004.16 	 9/31/11 	$17	$821
 			    net: 	 $1,996.44 		net:	$1,236	                         $760.44 	38%
Date	Initial investment	Short PPS	Share sold short	cost	Date	Cover buy PPS	Cost	Earnings	%
 4/6/2011 $1,000	 $166.75	6	 $1,000.50 	 9/31/11 	$104	$622	.	.
 4/6/2011 $1,000	  $18.65	54	 $1,007.10 	 9/31/11 	$17	$924	.	.
 .	.	.	   net: 	 $2,007.60 	 . 	    net:	$1,546	  $461.58 	23%
 Date	Initial investment	Short PPS	Share sold short	cost	Date	Cover buy PPS	Cost	Earnings	%
 4/6/2011 $1,000	 $239.40	4	 $957.60 	 9/31/11 	$104	$415	.	.
 4/6/2011 $1,000	  $10.92	92	 $1,004.64 	 9/31/11 	$17	$1,574	.	.
 .	.	.	   net: 	 $1,962.24 	 . 	  net:	$1,989	 $(26.60)	-1%
A good stratagy is to SHORT both ETF's
AGQ and ZSL at the same exact time.
Let say you shorted $1000 in both on 1/3/11. Real prices history.
AGQ you sold 6 shares at $156.63 = $939.78
ZSL you sold 25 shares at $39.50 = $948.00
Total of $1887.87
You covered on Friday
AGQ you bought 6 shares at $103.68 = $622.08
ZSL you bought 25 shares at $17.11 = $410.64
Total of $1032.72
$1887.87 - $1032.72 = $855.06 you keep.
Less the margin base rate cost (TD rate is 7.75%) which in this case cost $121.92
A net earnings of $733 or 38.8% YTD return...
RISK? I really don't know. "Backwardation" hah!
Slippage

This Ultra ProShares ETF seeks a return that is 2x the return of an index or other benchmark (target) for a single day, as measured from one NAV calculation to the next. Due to the compounding of daily returns, ProShares' returns over periods other than one day will likely differ in amount and possibly direction from the target return for the same period.
IMO, This is the big question about this ETF....
Will Third Quarter Earnings Disappoint?
by: Carlos X. Alexandre September 15, 2011
It’s common knowledge that recent corporate earnings have benefited from cost cutting, although the time always comes when companies start to face the law of diminishing returns. The last time I checked, the complaint was that most analysts had not adjusted the upcoming earnings, especially considering the less than perfect economic data that we have been digesting, and the risk is alive and well that disappointments will surpass expectations.
But a reference to an article by MarkeWatch shows that analysts are busy adjusting their numbers.
Calendar year earnings estimates for the S&P 500 SPX have fallen below $100 for the first time since July 21, according to S&P Capital IQ. Estimates for every sector have been cut for both the third quarter and fourth quarter, researchers said. In addition, analysts have cut third-quarter earnings growth estimates to 14.7% from 16.94% on July 11.
The good news is that earnings expectations have been lowered and that will soften a potential blow. The question is whether they are low enough.
Dr. Ed Yardeni, the president and chief investment strategist of Yardeni Research, Inc., shared a piece of data in his blog - the tax revenues data series published in the Monthly Treasury Statements of Receipts and Outlays - and added that this information is not observed by the main stream financial community.
Although his observations point to a surprising increase in individual tax revenue while wages remain stagnant, the corporate side of the tax story is what stands out, as his graph below illustrates.
On the other hand, the growth in corporate profits tax receipts is slowing significantly. Over the past 12 months through August, these receipts totaled $191.2 billion, and are up 11.7% y/y. That’s down sharply from the most recent cyclical peak growth rate of 60.9% during January. The growth rate of the 3-month sum of these receipts was down 7.0% on a y/y basis.

Certainly the debate always centers on whether the market is priced correctly, and whether stocks already discount the future. And the answer will always sound appealing to whomever is making the case, but in one month’s time we’ll determine whether Dr. Yardeni’s observations are valid or if “the price is right.”
The Whisper Report ® Monday, September 19, 2011
1,215 is still our line in the sand and a move above 1,223 is required for us to be bullish, but weakness from here is indicative of a longer-term trend lower and the start of a recession. http://www.earningswhispers.com/

By Julian Murdoch
January 25, 2011. We often talk about the difference between Brent and WTI crude oil on this site. But never has the difference seemed so stark as now.
Brent crude, you may remember, is drilled from the North Sea oil fields and serves as the benchmark for European crude oil, while WTI (aka West Texas Intermediate crude) serves as the benchmark for U.S. oil.
WTI is a sweeter, lighter crude, and all things being equal, gasoline refiners prefer to work with WTI over Brent. Thus, in a vacuum, WTI should trade at a premium to Brent. But we don't live in a world of blind equality.
Looking back over the past five years (except for 2008, that is), WTI tended to obey common wisdom and run at a premium to Brent by roughly $2. But in 2008, the latter half of 2009 and now over the past few months, the two switched, with Brent trading at a premium—sometimes a substantial one—to WTI:
On Monday, that premium was $8.74—the largest spread seen over the past five years. So what gives?
Brent Trading Games, WTI Surpluses
Oil expert Chris Cook, former compliance director for the International Petroleum Exchange, points out that futures aren't what set the price of Brent crude. Physical cargoes coming out of the North Sea do.
"That amount coming out of the North Sea is gradually declining," he told Hard Assets Investor in a phone interview Monday. "It's been in secular decline for some time."
According to the Energy Information Administration, production in the North Sea in 2006 was 4.343 million barrels per day, but by the end of 2010, it had dropped 23 percent to just 3.348 million bpd. What's more, the EIA predicts this trend will continue to the tune of 185,000 barrels per day in 2011 and 156,000 bpd in 2012 (EIA's recent Short-Term Energy Outlook - Jan 2011).
New exploration licenses continue to be issued for the North Sea, and new discoveries continue to be made, but overall, says Cook, nothing can come close to slowing—never mind stopping—the production decline.
It hasn't helped that existing rigs in the area have had a few mishaps. Statoil briefly closed two of its fields in the North Sea earlier this month after a gas leak was discovered. (Combined, the two fields—Snorre and Vigdis—produce around 157,000 bpd.) Then just last week, Royal Dutch Shell closed four interconnected rigs in the original Brent field, when large hunks began falling off one. That took about 20,000 bpd off line, and the complex will stay closed for several weeks to come.
"The fewer and fewer cargos there are knocking about," says Cook, "the easier it is for people to actually influence [the price]. That is exactly what is going on—trading games. Hetco, the trading arm of Hess Co. in the U.S., has bought up roughly a third of this month's cargo and some of the next."
These "trading games among consenting adults," as Cook terms them, have gone on for years. But as Brent became a more widely adopted global benchmark in the 1990s, these trading plays began to affect the volatility of the global price of crude—and the Brent-WTI spread.
"I think we're seeing some games which have temporarily pumped up the arbitrage between the two contracts," he says. "Brent is financially pumped up, whereas WTI is more rooted in the underlying market because it is deliverable."
Physical delivery of WTI crude, which occurs in Cushing, Okla., has a real effect on crude prices due to the storage/delivery bottleneck that sometimes accumulates there. That means short-term inventory surpluses and deficits can have a significant impact on prices.
"Inventories in the U.S. have been coming down in the last few months, but there is still a healthy amount of oil in storage in the U.S., which tends to push the market more into contango,," says John Hyland, portfolio manager and chief investment officer of United States Commodity Funds LLC.
Indeed, according to the EIA's weekly petroleum inventory reports, inventories are still well above five-year averages, although they are lower today than in previous months.
So with tight supply and trading games pushing Brent prices up, and oil surpluses keeping WTI prices low, it only makes sense that the Brent-WTI spread should be as high as it is today.
But will the trend continue? No way to tell for sure. No matter—U.S. ETF investors can easily invest in either side of the spread.
Investing In The Brent-WTI Spread
Since USCF's introduction of the United States Brent Oil Fund (BNO), the fund is up 24 percent compared with the comparable WTI fund, the United States Oil Fund (USO):
The two funds are similar in that they both own a single, front-month contract and roll it two weeks prior to expiration. The only difference is USO owns WTI, while BNO owns Brent.
Although there's no guarantee that Brent will continue to outperform WTI, the future curves imply that maybe, it just might:
On the left, we've plotted the futures curve for both oil contracts over the next year. On the right, we show the historical cost of rolling that front-month contract over the last year.
Immediately obvious is that WTI is in fairly strong contango through the next year—a function of the aforementioned ample inventories. Brent's curve, on the other hand, remains comparatively flat, although technically in contango. If these conditions persist, then BNO will likely continue to outperform USO simply because of the roll cost—although all it takes is a drop in U.S. inventories to quickly flatten the WTI futures curve and change the picture completely.
So what's an investor to do?
One option would be to buy one and sell the other, depending on which way you think the spread is going to go, and take advantage of the arbitrage between the underlying crudes. With Brent at such a tremendous premium, it's a tempting play, although a flattening of the WTI curve could work against you.
Another option is to pick the crude that aligns with your investment strategy, whether it's something U.S.-centric or a more global approach. Hyland sees real opportunities in the latter.
"If you're bullish on oil because you're bullish on India and China, you're already halfway there to being non-U.S. centric. You've already concluded that the price of oil is no longer solely dictated by how many people are going to drive to Disneyland this summer," he says. "So take the next logical step and think about what kind of oil exposure you want to buy."
In the end, when it comes to crude, it pays to remember that more options exist than just plain old WTI.
Disclosure: No positions
I kinda agree with adeezl that it mostly sits around doing nothing but look pretty.
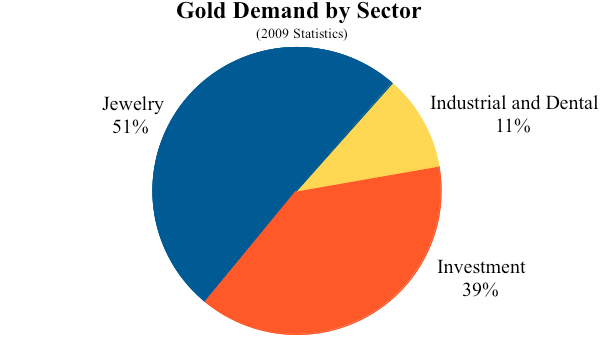
Jewelry is an important part of life. It show status or class, gets you sexual intercourse, and aesthetically pleasing to look at. SOmething in our brains love jewelry.
Bling!

I still hear the pumping of gold on the radio everyday. They say this is just a temp drop.
Direxion 3X Leveraged Bull Shares (ERX)
It worked the last time I recommended it, and I expect it to perform once again. The ETF is the absolutely best way to take advantage of a short term spike in oil prices. The fund holds companies like XOM, OXY, and even HAL, all of whom have gotten hit hard due to weakened oil prices.
Oil has some solid support at $80, and we may be seeing a replay of the price action seen back in August. Oil tested $80, shot up to $90, and stabilized for a couple weeks in the mid-high 80s. Energy stocks outperformed. The fund requires an ability to deal with huge swings, and its risks should be understood by those who decide to use it.
by Williams Equity Analysis »
Is the economy getting stronger?

Is the economy good? will energy stocks increase?

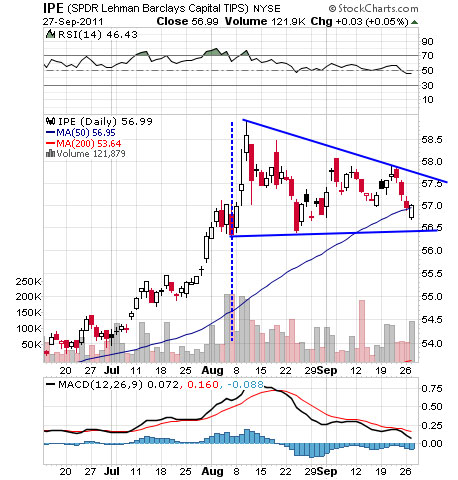
bull flag
Oil up 3 percent on euro zone moves, refinery concerns
Tue Sep 27, 2011 4:58pm EDT Print This Article[-] Text [+]
1 of 1Full SizeBy Matthew Robinson
NEW YORK (Reuters) - Oil jumped more than 3 percent on Tuesday, snapping a four-day losing streak on efforts to strengthen the euro zone rescue fund and concerns about U.S. fuel supplies.
European officials were seen considering plans to boost the size of the region's bailout fund and to recapitalize banks, sparking hopes of an easing in the debt crisis that has dragged stock markets and commodities this month.
Equities rose and commodities gained, with gold also shaking off four days of declines. End-of-quarter and technical buying also provided lift.
"What we might be seeing is some end-of-the-quarter bookmarking," Gene McGillian, analyst for Tradition Energy in Stamford, Connecticut.
"Right now, the (U.S. crude futures) market may have triggered some technical buying at the $80 level, I think this is a technically oriented rally with some end-of-the-quarter buying supporting it."
A strong, counter-seasonal jump in RBOB gasoline futures further fueled the rally, rising nearly 5 percent on supply concerns after news ConocoPhillips (COP.N: Quote) would sell or idle its Trainer, Pennsylvania plant and that Motiva Enterprise MOTIV.UL shut a cat cracker at its Louisiana refinery.
Brent futures rose $3.20 to settle at $107.14 a barrel, after touching a session high at $107.54. It marked the biggest percentage gain for Brent since August 10.
U.S. crude showed even bigger gains, rising $4.21 to settle at $84.45 a barrel in the biggest daily percentage gain since May 9.
Brent volumes, which have traditionally been lower those for U.S. futures, again outpaced those of the U.S. contract.
The rising activity in Brent, compared with the New York Mercantile Exchange's U.S. contract, could be tied to traders anticipating large, long-only index commodity funds will increase their 2012 holdings in Brent relative to U.S. futures, analysts said.
The U.S. contract has come under pressure this year as rising volumes of crude from Canada flood into the U.S. Midcontinent, especially the Cushing, Oklahoma delivery point for the NYMEX contract. In addition, the backwardated shape of the Brent curve can yield better returns for long-only indexes than the WTI curve, which is in contango.
"The NYMEX is just such a false indicator of where demand is and where the real price of oil is, the Brent market is well over $100 and the NYMEX is just completely detached," said Stephen Schork, editor of The Schork Report in Villanova, Pennsylvania.
"I would expect to see an increase in Brent and a decrease in NYMEX (by long-only index funds)."
In afternoon activity in New York, more than 600,000 Brent contracts had changed hands, 17 percent over the 30-day average. About 500,000 contracts traded on the New York Mercantile Exchange's U.S. contract, about 24 percent below its 30-day average.
EYES ON LIBYA, US INVENTORIES
The premium paid for Brent over U.S. crude narrowed to below $23 a barrel as traders focused on the return of crude supply from Libya. The country's port authority chief told Reuters the OPEC nation had shipped its first crude cargo from the eastern port of Marsa el Hariga on September 25, bound for Italy.
The loss of Libyan crude, a key feedstock for Italian refiners, helped widen Brent's premium to U.S. crude to record levels over $27 a barrel this month.
Data from the American Petroleum Institute showed a 568,000 barrel gain in U.S. crude stockpiles for the week to September 23, slightly lower than analyst forecasts, and a steep 4.6 million barrel rise in gasoline inventories.
Stockpiles at the Cushing hub fell by 1 million barrels, while distillate inventories slipped. The market will be next be looking for data from the U.S. Energy Information Administration, due out Wednesday morning. <EIA/S>
(Reporting by Matthew Robinson, Gene Ramos, Robert Gibbons in New York City, Jessica Donati in London; Francis Kan in Singapore; Editing by Marguerita Choy)
Oh, don't worry. These guys thank you... managers always do OK in these situations of failure.
                          Annual     Participation     Payout
                          Salary     Rate     Factor     Bonus

 Charles Gassenheimer   $ 600,000       75 %     1.0     $ 450,000
 Jeffrey Seidel         $ 300,000       75 %     1.0     $ 225,000
 Richard Stanley        $ 360,000       50 %     0.0     $ -
 Ulrik Grape            $ 300,000       25 %     0.0     $ -
 Naoki Ota              $ 300,000       25 %     0.7     $ 50,000
 Gerard Herlihy          $ 250,000
They cannot sell the product. Electric cars are just too expensive. Congress can force people to change but it won't. After that solar company failure, I doubt more Governement grants are coming.
Now throw on top of that millions more shares causing your current shares to be diluted. (main reason) This is going to be another Reverse split soon. It's getting thrown off the market. It will need to be pink or otcbb.
the lawsuit about restating earnings because they bought their only customer. Think cars have the appearance of being a dangerous car in the US and most people are afraid to drive them.
it's all bad and nothing positive.
I do wish is was different because I think electric cars would be the solution to getting off gasoline. Gasoline needs to be much much higher for these electric cars to make since. The market is just not ready for an electic car. Volt is the way to go though. It runs both gas and electic but it too, the car cost, is way too much.
You should trade this like a penny stock or lose all money you place in it long.
I live in town and I have heard even some employee say the stock is not good. heck, just read the 10q to see..
David J. Kneupper
No slippage in SCO.. backwardation
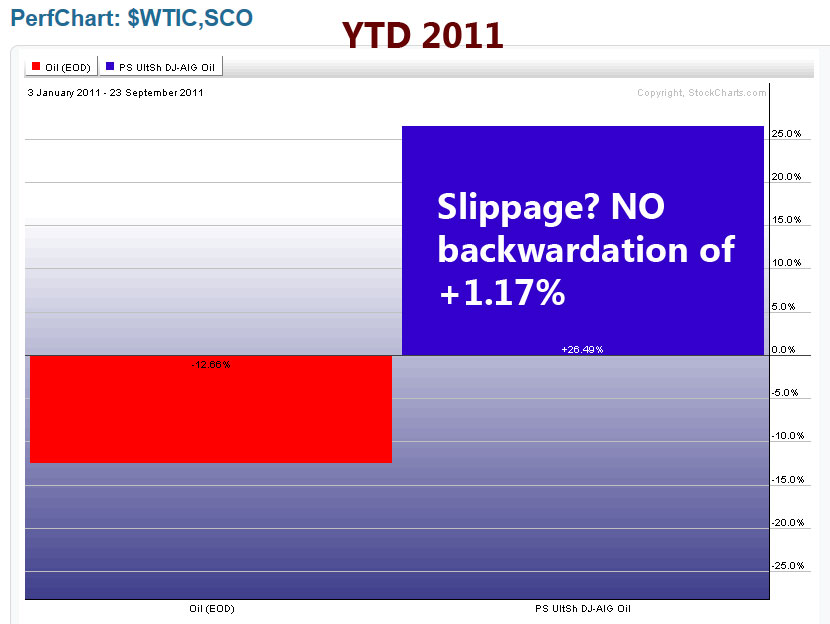
YTD 2011 slippage
negative 7%+

Slippage in 2011

Ahsan U. Haque
A good chance to make some money on oil now...
So let's watch it...
This is Ahsan U. Haque USO... so we use as guide for this double

http://stockcharts.com/def/servlet/Favorites.CServlet?obj=ID3308244&cmd=show[s185786452]&disp=P
No rebounding for this one. Ever.
Unless the goverment forces us to buy electric cars.
Trade it like a penny stock.
right now it's 4,974,248 (Above Avg)
Didn't the Feds say the will be buying these bonds? Think the traders already priced this in?
WOW.. just fell into oversold range..
But who knows???

More looks at this...

Might be some reasons to start looking to enter...
- Will big oil let WTIC go down much from here?
I think this sell off is because the whole market is off. People are in fear of second recession coming.
In 2008, Gold crashed too when whole market crashed.
Fed’s twist: shift $400B in holdings
Noting risks of a further downturn, the Fed aims to lower long-term lending rates by essentially swapping $400? billion in short-term bonds for long-term bonds.
By Kevin G. Hall McClatchy News Service
WASHINGTON -- Digging deep into its bag of leftover economic sparkplugs, the Federal Reserve on Wednesday launched an unorthodox operation aimed at lowering long-term lending rates and thus sparking more spending and investment in an economy flirting with recession.
Specifically, the Fed announced it would sell $400 billion in short-term government bonds and replace them with longer-term government bonds of equal value.
The controversial action is dubbed Operation Twist II because it’s patterned after a similar move in the 1960s named after the then-popular dance craze.
By the end of June 2012, the Fed intends to buy $400 billion worth of Treasury securities with remaining maturities of six years to 30 years. In tandem, it will sell an equal amount of Treasury securities with remaining maturities of three years or less.
“This program should put downward pressure on longer-term interest rates and help make broader financial conditions more accommodative,” the Fed said in a statement at the end of a two-day meeting. Three voting members dissented, saying it wasn’t needed.
While financial markets had expected the move, it was accompanied by a Fed statement noting “significant” risks of further economic downturn. That spooked investors. Stocks plunged. The Dow Jones Industrial Average shed 283.82 points, to 11,124.84.
“Operation Twist is the right thing to do, but it won’t help the economy much,” said Mark Zandi, chief economist for forecaster Moody’s Analytics. “Long-term rates, notably fixed-mortgage rates, are already at record lows, given investors’ anticipating the Fed’s actions today. But the Fed went a bit beyond expectations, and thus I think rates will go even lower. I expect 30-year fixed-mortgage rates to fall below 4 percent.”
Lower lending rates might spur more mortgage refinancing, home sales and business investment.
On its website, the Fed noted Operation Twist II is not a panacea, just another step that contributes to a “broad easing” in policies taken by the Fed, White House and Congress. It said that by driving down the interest rate paid to investors on long-term government bonds, “interest rates on a range of instruments including home mortgages, corporate bonds, and loans to households and businesses will also likely be lower.”
The Fed statement painted a bleak landscape: “Recent indicators point to continuing weakness in overall labor market conditions, and the unemployment rate remains elevated. Household spending has been increasing at only a modest pace in recent months despite some recovery in sales of motor vehicles as supply-chain disruptions eased. Investment in nonresidential structures is still weak, and the housing sector remains depressed.”
Pennant flag says bull and gaps need to fill. Volume is needed and would come from market sell off

and this....
The committee will have until Nov. 23 to propose ways to reduce deficits. Those proposals must be voted on by Dec. 23.
If the committee process fails to produce a debt reduction plan, as much as $1.2 trillion in across-the-board cuts would kick in evenly divided between defense and non-defense spending.

