 News
News  Market Data
  Discover
Support: 888-992-3836
Copyright © 2023 InvestorsHub Inc.


ls7550
![]()
Register for free to join our community of investors and share your ideas. You will also get access to streaming quotes, interactive charts, trades, portfolio, live options flow and more tools.
Register for free to join our community of investors and share your ideas. You will also get access to streaming quotes, interactive charts, trades, portfolio, live options flow and more tools.
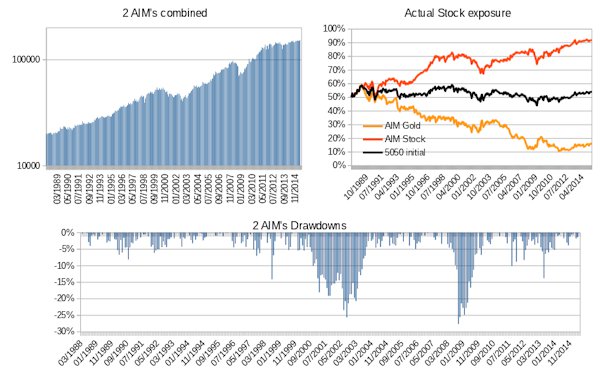
Broadly looks like he's averaged 50/50 SSO/cash i.e. similar to my half in 2x, half in bonds scaling of 2x to 1x, and accordingly achieved similar rewards i.e. turned $20K (stock+cash) into around $50K
Image from bis blog

https://www.portfoliovisualizer.com/backtest-portfolio?s=y&allocation2_2=100&symbol1=SSO&endYear=2015&symbol3=SHY&symbol2=SPY&inflationAdjusted=true&annualAdjustment=0&showYield=false&startYear=2009&rebalanceType=1&annualPercentage=0.0&allocation1_1=50&allocation3_1=50&annualOperation=0&initialAmount=20000
Leveraged ETFs
Does anyone have any experience with leveraged etfs?
I use them a lot. Scaled to the 1x equivalent i.e. half in SSO (2x SPY) half in bonds.
https://www.portfoliovisualizer.com/backtest-portfolio?s=y&allocation2_1=50&symbol1=SSO&endYear=2015&symbol3=SPY&symbol2=SHY&inflationAdjusted=true&annualAdjustment=0&showYield=false&startYear=1985&rebalanceType=1&annualPercentage=0.0&allocation1_1=50&allocation3_2=100&annualOperation=0&initialAmount=10000
The LETF in effect borrows the same amount again in order to buy twice the amount of stock. If you buy half as much and lend the other half (buy bonds) and you lend for more than what it costs the LETF to borrow then that adds value. i.e. it becomes a playoff of bonds/debt costs, typically where debt is for short term (daily), whilst bonds can be longer term (weeks/months).
When scaled to 1x you have to periodically rebalance as the weightings will drift over time. A third in 3x, two thirds in bonds might drift towards being 50/50 if stocks rise, or decline to 20/80 if stocks decline. Resetting back to target weightings (33/67) periodically helps avoid tracking drift. For 2x once/year is generally sufficient. For 3x a bit more regular (6 months).
In the present low interest rate environment (0.5% or whatever pro-rata daily rate) beating that is a relatively simple task IME. Resulting in index busting gains overall.
Another factor is that LETF's often use swaps, so the counterparty matches the actual index change. In contrast conventional index tracker funds tend to lag the index after costs.
Clive.
Australia in the past has been a reasonable diversifier - out of phase with our cycles. I do however prefer the added Hong Kong (China Red Chips etc.) and Korea wider 'Asia-Pac' diversity that VDPX provides.
For UK investors, Australian Franked dividends incur no further withholding tax liability. Unfranked incur a 15% withholding tax rate. Hong Kong doesn't levy any dividend withholding tax, so wider diversity and lower taxes overall.
I use BRK-B as a proxy for US as Berkshire Hathaway pays no dividends - that otherwise would have 30% standard US dividend withholding taxes applied (reduced to 15% if you're known to the US (W8BEN form registered)).
Domestic dividends (UK) are tax efficient (a little less so after our more recent budget) for modest (average) private investors.
We have to be wary with ETF's as there are lots of additional hidden costs such as withholding taxes. Even though a fund might levy a 0.1% 'low cost' fee the fund absorbs the likes of withholding taxes which can greatly reduce the difference between Index and actual total gains. Most ETF's benchmark to the Net Total Return index, which discounts withholding taxes and makes their actual performance look relatively good. For instance a domestic (UK) domiciled ETF that tracks US stocks that pay say 4% dividend will benchmark to the net total return index such that if stock prices have risen say 10% (i.e. 14% gross total return for the Index), its benchmark index will have a 12.8% total return figure i.e. 4% less 30% standard rate US dividend withholding tax. In practice however the UK/US tax treaty reduces withholding taxes to 15%, so 0.6% of dividend taken instead of 1.2%. 10% capital gain, 3.4% actual dividend received, less perhaps 0.1% ETF management fee = 13.3% ETF's total reward compared to 12.8% benchmark figure (so investors think great, the fund I've selected has done well). Whereas compared to the index total return of 14% they've lagged by 0.7%. If the fund 'tracks its benchmark' tightly, then compared to the Index total return of 14% a 12.8% benchmark and actual is a 1.2% 'cost' (lag).
When they look back some years later and see the 'Index' provided a 3% real, but their account is showing only a 1.8% real, they'll scratch their heads and wonder want-went-wrong.
And that's for a 'low cost fund' choice. Many others are far worse (higher fees, more internal costs that are being absorbed etc.). In such cases others might get to eat your dividend. And that's before any other domestic taxes.
Australia is a bit of a commodity play. In the UK Vanguard provide VDPX which is very approximately around 50% Australia, 25% in each of Hong Kong and Korea i.e. also has 'access' to China (trade/markets)
Comparing Asia/commodity like with US and UK holdings Australia has seen both relative decline in currency and in the last year or less seen divergence in stock valuations
MIDD is UK mid caps
BRK is Berkshire Hathaway (US proxy)
AORD is Australia
KS11 is Korea
HSI is Hong Kong
The charts are all from a UK investor perspective i.e. in GB Pounds.

i.e. a Australian investor in UK (US) stocks would have gained both from better stock performance and FX (currency). Commodities in general have lagged.
Like the US$ the GB Pound is relatively strong and stocks doing relatively well compared to many other countries. Global fear would seem to be relatively high and the safety of more secure economies being sought (US$/GB£ over that of Yuan, Won, Aus$, Euro etc.).
Whilst there's relative 'Value' in Australia/commodities, the question is when might the decline reverse and seeing some of that Value being outed (gains).
Same as ever, what's relatively strong can continue to get stronger - but then at some point might see a sharp reversal of those gains; What's weak can become weaker, but then make a sudden rebound to out some/all of the Value.
With Iran opening up and providing even more oil, China in the doldrums, Europe still struggling ...etc, Commodity Value might deepen further still and/or take a while longer yet before any reasonable rebound/recovery is being seen.
AIM or rebalancing between Australia, UK, US or whatever will tend to profit take out of the winners, add to the laggards, until FX, commodities, whatever reversals occur and AIM starts working the other way around. i.e. since 2013 UK stocks are up around 1.3 gain factor (+30) compared to Australia being down near -20% at a 0.8 gain factor - which amounts to a 60% spread (1.3 / 0.8). Reducing UK to add to Australia in effect has the UK stock purchase power of Australia stocks having a 40% discount price tag (0.8 / 1.3) on Australian stocks.
As a alternative to the vWave, if you run a backtest of AIM on the target purchase and use that as a vWave type measure/metric generally that compares to a vWave measure, but specifically for the intended target.
Clive.
Burnt DVD's/CD's and tape have faster degradation than Punchcards.
I've punched in parameters that are somewhat near my A.T.T.I.C. aiming system
Looks like China fell out of bed!!!! -8% in one session...
Out of a multi-layer bunk bed down to a lower, but still high up bed.
Since a year ago the Shanghai Composite hit a +137% gain at one point, but with the more recent -8.5% days decline is down to being "just" +71% up for the year - as priced in CHY.
China Mobile (red chip (in contrast to our blue chips)) traded out of Hong Kong (0941.HK) is currently down -3.5% for the day by comparison, around 15% up year on year after having hit around a +36% high - as priced in HK$ - which is more 'pegged' to US$
Sorry FB, can't help with later Windows versions as I stopped using Windows once MS stopped XP support. I still have XP as a boot option, but default boot is to Linux now (I also have a DOS boot partition - so personally I can run all of the older DOS stuff in native form).
There used to be a compatibility option in Windows where you could set what/how to run a program, no idea if that's still available or whether that might be the cause of your problem.
I tend to run Newport via a DosBox session under Linux and that works great. I haven't installed MyWay into that however and don't particularly want to just in case it screws things up.
Australia (and Canada) are somewhat commodity plays. Australia is relatively lagging the US/UK. With Iranian oil coming back into the market and wage inflation being low it looks like deflation continues to be prevalent such that commodity demand lags potential supply.
Buy relatively low opportunities, but cost average in rather than lump-in i.e. no urgency required IMO.
I remember reading about a stop loss method you use, something along the lines of using 12 separate equal positions (one per month) and using a 5% or 7% stop loss, and rolling those positions over if the stop was not called
That's a approach I used some years back, when 'cash' used to earn more (pre QE years). The concept being not to (ideally) lose any (nominal) value. If both cash and dividends are 5% then take on 5% max price decline risk (stop loss) and exit out to cash if hit, until recouped by combined dividends and cash interest. Otherwise reset/restart from the higher level (year end value assuming the stop loss wasn't hit).
So for example if invest in a 5% dividend yield stock and its price drops 5% below the purchase price a month after initially buying, then sit in cash (earning 5%) for another 11 months and you broadly have the same nominal amount as at the start, at which point start over again (5% share price loss recouped via dividends and cash interest). If the stop loss isn't hit and the share price rises 20% over the year, plus 5% of dividends, then you start afresh, but using 25% greater wealth (gains in effect locked in).
In a low dividend yield/interest rate world however its not really a viable choice/approach.
What is BRK?
What is your opinion on actually implementing such an stock+gold or gold+stock AIM machine at this point in time?
Aiming gold with stock as reserves will likely produce better results in the long term than aiming stocks with gold as reserves, simply due to gold's higher volatility.
I remember doing some backtesting using CEF (gold+silver, data goes back to 1992) and VTSMX as reserves and the results were a lot more favourable than with the two assets reversed.
A US version might be comprised of something like
https://www.portfoliovisualizer.com/backtest-portfolio?s=y&allocation2_1=20&benchmark=%5ESPXTR&allocation1_1=20&allocation5_1=20&annualOperation=0&initialAmount=10000&allocation4_1=20&symbol5=GLD&symbol4=SHY&symbol1=MDY&endYear=2015&symbol3=EWU&symbol2=EWA&inflationAdjusted=true&annualAdjustment=0&showYield=false&startYear=1985&rebalanceType=1&annualPercentage=0.0&allocation3_1=20
Hitorically gold is about the price of the S+P 500
Invest 50% in each and either rebalance yearly or when some % out of wack
The stock purchase power of gold is volatile.
US since 1968 when President Nixon finalised the breaking away from a gold standard has seen gold arithmetic yearly average 11% with a standard deviation of 25% (Pythagorean CAGR approximation 8.14%), min -25%, max +99%; Stocks averaged 10.9% with a 16.9% standard deviation (CAGR approximation of 9.56%), min -35%, max +38%
The stock purchase power of gold averaged 3.7% with a 34% standard deviation (CAGR -2%), min -36%, max 106%.
50/50 yearly rebalanced stock/gold averaged 10.9% with a 13.6% standard deviation, CAGR 10.1%, min -15.8%, max 62.3%.
50/50 stock gold yearly rebalanced produced a higher CAGR (actual gain) than 100% stock and did so with less risk (better min).
Whilst gold pays no dividends and alone broadly paces inflation, the stock purchase power of gold is volatile enough to open up the potential to trade gold and potentially yield a 'dividend'. Deploying gold to buy stocks when the stock purchase power of gold is high, selling stock to replenish gold when the stock purchase power of gold is low (stock purchase power of gold is high), will help bolster gold productivity (dividends). i.e. gold is a reasonable 'reserves', especially when periodically deployed and later replenished in a timely manner.
However the cycles can be long/slow and potentially deep/tall.
I also use Excel.
I like the flexibility it provides
Venezuela has a high risk of asset seizure so few if any would provide a ETF that catered for stock exposure.
Even bonds are highly speculative/volatile and distil down to default risk/changes in inflation/interest rates.

http://www.tradingeconomics.com/venezuela/indicators indicates recent 10 year government bond yield is just under 11%. The longer dated the bond the greater the price sensitivity to changes in market yields.
Not sure how easy/not it might be to trade bonds directly. BONO Market Vectors Latin American Bond ETF has Venezuela weighted around 10% http://etfdb.com/factsheets/BONO/
If you could short Mexican and short Brazil bonds you could negate the two largest out of BONO to leave a predominately Venezuelian bond fund.
...battle for investment survival was lost by millions of trusting investors in 1974 …
.… some of the more pitiful victims, like me, were those who had entrusted their entire financial future to mutual funds. Hardly greedy, we were so flushed with delight in those heady years prior to the day of reckoning that some of us even quit our jobs and dropped out, figuring that the huge capital gain distributions from our mutual funds would be more than sufficient to support us for the rest of our lives. - Robert Lichello (prefix of rev 4).
AIM tends to have a natural tendency to throw off cash over time. Vealies tend to counter that rising cash and help raise overall average stock exposure. Lichello however apparently wasn't adverse to letting cash at times rise to 75% or more levels, and such conservatism can at times be appropriate.
Looking at Constant Real Value (slow AIM) for a Japanese investor whose stock holdings were domestic/internationally diversified, maintaining a constant real (inflation adjusted) stock value saw the same amount of inflation adjusted stock value by the end of 1999 with a further 50% of that amount in cash (assuming cash were deposited in a inflation pacing/safe asset). Far better than a pure buy and hold 100% stock investor who bought Japanese stocks at the 1990 peak.
Continued on to the end of 2014 and both stock value and side-pot (cash) were around the same amounts in inflation adjusted terms. The equivalent to 2.8% annualised real since the 1990 peak, not great but not that bad either given the general progress of their stocks since 1990. Or that could be considered as thereafter the stock holdings were 'free'.
I probably just put myself in retirement also so will start to need an income stream. Any thoughts.
Own a home, so all 'gross rent' is in effect paid in advance. Roof over your head and the landlord is pleasant.
Enough in safe bonds to cater for 20 years or whatever of living expenses (drawdown).
Rest in growth (stocks) accumulation. Provided enough (typically same amount as initially deposited into bonds) then that's sustainable (longevity/heirs).
If no heirs and 20 years is more than you expect then home+bonds alone would suffice. Spend the bonds and the proceeds of the sale of the home might cover twilight life care.
For bonds I worked a ladder of present day living expenses for each of 20 years, discounting future pension income amounts in later years (as and when those come online) in order to identify a present day amount to be initially invested in bonds (assuming bonds are invested/deposited in a inflation pacing investment). For example if I started today at age 55 and led a $50,000/year living expense lifestyle, had a $15,000/year inflation linked occupational pension payable at age 60, and a $15,000/year state pension payable at age 67 then 5 years x $50,000 to see me through ages 55 to 59, $35,000/year to cover age 60 to 66, $20,000/year to cover age 67 to 74. Which in total $655,000 covers. If invested in safe inflation bonds then 20 years of income is reasonable assured/covered. If the same amount again is available and invested in stocks/accumulation then there's a reasonable chance that after 20 years that stock value might have doubled in real terms (3.5% annualised real) - so overall end 20 years with the same amount as at the start of the 20 years in inflation adjusted terms (longevity/heirs).
For stocks, a low cost tax efficient S&P500 accumulation fund is a simple but effective choice. Well suited to when you might become confused as to what day it is let alone how to manage a portfolio of many assets.
That all assumes you've 'won the game' and have enough (no need to take risk). If not then its a case of dividing what you do have by whatever rock-n-roll party-animal lifestyle you fancy.
Slow AIM
Unlike constant weighting (rebalancing back to fixed weightings periodically) AIM dynamically adjusts the weightings over time, typically moving to all-in at market lows, accumulating a sizeable cash reserve during highs.
An idea for a once/year variant of AIM is to :
Yearly note the stock value adjusted for inflation with dividends reinvested (total real gain) and sell enough stock to reduce the stock value down to inflation pacing if the value has exceeded inflation, depositing the sale proceeds into inflation bonds; Or selling inflation bonds to top up the stock value to inflation pacing if enough of such inflation bonds are available when stock value had lagged inflation.
Repeat yearly.
The above is AIM like and can be fed a single diverse fund that otherwise might have been too stable (not volatile enough) for conventional AIM to work with.
As a initial entry amount you could use the vWave as a indicator of how much to load into each of stock and inflation bonds.
Testing US data since 1972 I'm seeing a average 7.4% being added to inflation bonds each year, but in a sporadic manner. Compared to 6% real from buy and hold.
If when the value/amount of inflation bonds were relatively large and a add-to-stock were being indicated you redeployed a sizeable chunk of those reserves (re-levelled to expand stock holdings/deploy cash) at a time when it was indicating to add to stocks then overall it produced the same total gain as stocks, but did so with less portfolio drawdowns and averaged 18% cash reserves - i.e. same reward as 100% buy and hold but with less risk. (i.e. previous paragraphs 7.4% 'dividend' rate x 82% average stock exposure = 6% proportioned (same as 100% buy and holds 6% real)).
Could be a lazy AIM. Looking perhaps to hold something like a single stock fund such as Vanguard LifeStrategy (100% stock) as the 'stock'. iBonds or TIPS fund as cash. And review/adjust once yearly at around the end of the tax year. Like AIM it will have you all-in at times, and perhaps share prices continuing to decline afterwards for a while. Over other periods it will be throwing out loads of cash, too much - such that you have to decide when to redeploy some of those reserves (put them back to work).
For the above test I simply started with 100% stock. 1972 saw some of that stock being sold (around 13%), 1973 saw that being redeployed back into stock, and then subsequently some drawdowns in real terms when ideally more stock would have been bought but no reserves were available. Bottomed out at the end of 1974 being around -43% down in real terms (buy and hold had drawndown -52%), then started a recovery and at the end of 1982 was again profit taking out of stock to add to bonds. Post 1982 were mostly profit take years, with occasional redeployment of reserves back into stocks.
Clive.
Mr. L's AIM-High shifts the Equity/Cash ratio and also requests a 10% minimum trade size.


Given that the FOREX manipulation had gone on from at least 2008 through 2013 does anyone suspect the same is being done in the stock market?
Hi Allen. Yahoo adjusted close prices reflect splits and (excepting indexes) dividends i.e. is more reflective of a total returns (accumulation gain assuming dividends were being reinvested). That's as though dividends were being progressively added day by day rather than jerkier price drops on x-dividend date.
If you use the standard 'close' (or open) prices then you need to add dividends to cash as and when they were paid. I suspect that if you did that then your two examples would more closely align.
MORL is a leveraged REIT (?) and REIT's tend to pay relatively high yields. Borrowing to buy twice as much (as the leveraged version in effect does) amplifies those dividends.
By the time you use standard close price and add dividends to cash ...etc overall you'll likely see much the same result as having used the simpler choice of adjusted close figures (as though you'd had dividends automatically reinvested).
In some respects a bit like running AIM with no adjustment for cash interest compared to adjusting AIM cash to include interest. For total returns its easiest to use adjusted close and increase AIM cash by what SHY or whatever earns (or the return from whatever cash might be invested/deposited in).
Clive.
Hi jaiml
AIM'ing XIV? I am not 100% of the validity of simulated data prior to 2010, but it looks like http://investing.kuchita.com did a decent job. If the simulated data is valid
ZIV is like a less extreme version of the XIV and the SVXY. The ZIV has much less extreme movements than the SVXY and XIV
ntrigued by Nassim Taleb's barbel strategy (80-90% in safe cash-like, rest in highly volatile assets)
Looks good.
15% XIV, 30% gold, 55% TLT, could also be considered as being PP like.
Whilst TLT and stocks can have shorter term inverse correlation, broadly longer term they correlate. Swapping out the 55% TLT for stocks makes the portfolio more stock-like (as though 100% stock were being held). But adds in additional safety factors i.e. gold if there's a major crisis, inverse volatility if share prices drop and flatten out at the lower price level (i.e. XIV loses a lot as do stocks, but XIV gains even more as volatility subsequently declines (share price flatten)). Whilst overall you broadly achieve 100% stock rewards.
A benefit for a UK investor is that if stock = BRK that pays no dividends, and as both gold and XIV pay no dividends then there's no withholding taxes. Whilst yields are relatively low 15% (or even 30% for some) withholding taxes aren't too much of a burden. If yields rose to 5% however then the tax risk is obviously greater.
BTW : SVXY has a lower expense ratio than XIV
This article suggests possibly even using XIV as a proxy for SPY
https://www.mcoscillator.com/learning_center/weekly_chart/vix_etn_not_right_for_investors/
It also provides a reasonable outline of why XIV (short volatility) is better than being long volatility.
The primary thought behind adding a volatility component (XIV) is to recoup long dated treasury bond losses more quickly after interest rates/yields have risen.
Toofuzzy has often said that he'll avoid long dated treasury until yields have risen (prices declined). A problem with that however is knowing when to buy. High yields could continue to rise higher.
With XIV included, when yields rise, each of stocks, long dated treasury bonds and volatility will all lose. After having dropped both stock and bond prices might level off and take a number of years to recoup the losses endured when yields spiked upwards. In contrast XIV might make some big gains as the initial shock of higher yields is priced in and stocks/bond prices stabilise (volatility declines). i.e. XIV helps to more quickly recoup portfolio losses from yields/interest rates rising.
SPY, EDV, GLD, XIV
Just a thought for a possible combination (portfolio) of assets. Stocks, Bonds, Gold and (short) Volatility respectively.
Why short volatility? Because typically it costs to be long volatility (time value). By shorting volatility a broad negative tendency is turned around into a positive expectancy.
XIV is a inverse volatility ETF. EDV is a extended duration (25+ year) treasury bond fund. GLD is gold, SPY is S&P500.
When stocks dive, volatility increases, XIV loses. When stocks sink often either long dated treasury (EDV) or Gold (GLD) will rise (inverse correlation). All four assets individually are very volatile (maximise potential volatility/rebalance benefit capture).
In less volatile times XIV (selling volatility) will capture the time value. As volatility (i.e. VIX) declines from prior highs so XIV benefits. So when stock gains are slowing, XIV gains might be good (gains when volatility decreases).
i.e. sudden stock shock, prices decline, volatility increases, both SPY and XIV lose, EDV and/or GLD gain. As the bottom is past so volatility might remain high as prices rebound/recover, SPY gains, XIV remains level, GLD and/or EDV might give back some of their capital gains (lose). As stock gains/recovery slow so XIV gains (declining volatility).
For 2011 through 2014 calendar years (inclusive), a 25% weighting each in SPY, XIV, EDV and GLD rebalanced once yearly (calendar years) versus SPY (S&P500) total % returns
5.5	1.9
 45	16
 22.8	32.3
 11.6	13.5
Applying AIM to CASH
Standard AIM will tend to cash accumulate over time. That's the reason why some apply Vealies. AIM can also exhaust cash reserves, but never runs out of stock to sell (at least for conventional AIM). That's OK for retired/drawing a income, but not so good for accumulators.
A little trick you might apply is to switch AIM around and apply it to 'cash'. That way you'll tend to accumulate stock over time, and never run out of cash.
Price cash in terms of stock i.e. as though you lived in a topsy-turvy world where stocks were currency and cash were a investment. Typically over time 'investing' in that world would be a bad idea as broadly investing (into cash) would lose relative to 'cash' (stock value).
You need to maintain a 'index' figure (price) for such a AIM. If actual stock prices are up 20% and cash is up 5%, then then cash has lost ( 1.05 / 1.20 ) -1 = 0.125 (12.5%) and the previous periods index figure needs to be adjusted to reflect that i.e. if that was previously 1.0 then its revised to 0.875. That 0.875 figure is the 'price' figure for AIM.
If stocks were down -20%, cash up +5% then ( 1.05 / 0.8 ) -1 = 31.25% and the prior index figure is revised to reflect that (0.875 * 1.3125 = 1.1484
When maintained that way the index price of 'cash' will be volatile and hence AIM will generate trade signals periodically. When that AIM price had risen (i.e. share prices relatively declined compared to cash) then it will signal to sell some 'cash' (which implies buy some actual stock). When 'cash' had declined relative to share prices i.e. share prices performed well, then the AIM will indicate to buy 'cash' (which implies sell some stock).
Used in such a manner you don't actually trade the amounts that AIM indicates - you instead just using the AIM as a indicator of when to trade and how much as a percentage of total cash should be added/reduced. i.e. might indicate that 10% of cash reserves be traded - which you then convert into a actual $ amount to be traded according to the total amount of cash you actually have.
Such a topsy-turvy AIM is also a good way to invest a lump sum. Start with perhaps 50% actual stock value and over time it will cost average more into stocks, at appropriate times and appropriate amounts. Longer term you'll likely find you achieved similar reward to had you lumped all-in at the start date, however AIM would have reduced the overall risk (of having lumped all in at a single time point that with hindsight turned out to be a peak).
Not as aggressive as conventional AIM - but as you can't exhaust cash its relatively safer. And managed appropriately the overall rewards aren't that much different.
The problem with a 5% value limit is that this is only $500 for a $20k position
Hi Allen
Its more a case of inducing less balance/stability. Property prices have a degree of correlation with stocks. Japan for instance saw deep declines in both in the 1990's. Tesco more recently have seen a large hit in their valuation due to property/land values.
If you click on the Rolling Returns option on that backtest web site you'll see that the ten-way 10% x 10 had lower 3-year returns than the 8-way. If each of stocks and property prices both decline together then there's less to counter-balance those losses.
As a more general portfolio however there are viable reasons to add in corporate property/rent/land into the portfolio. Likely uplifts the rewards for acceptable levels of additional risk. Otherwise there's already enough indirect exposure to that class via owning a home and the exposure to that class that the other assets comprise.
An alternative to adding more risk/reward through expanding the 8-way is to hold more volatile versions of the volatile assets. If for instance instead of gold you hold a third of that amount in a 3x leveraged gold fund (two thirds in bonds) and rebalance that back to one-thirds/two-thirds once each year then that blend will tend to have higher upside volatility/lower downside volatility due to the daily rebalancing that the fund performs (in effect adding more exposure during up-trends, reducing exposure during down trends).
Plug in 100% UDOW (3x Dow) and compare to DIA (Dow) as the benchmark into http://www.etfreplay.com/combine.aspx and for 2013 whilst DIA gained 29.6% UDOW gained 107.1%. i.e. one third in 3x, two thirds in bonds was higher than 100% in 1x.
There weren't any 3x leveraged ETF's available back in 2008 that etfreplay has data for, but if you look at SSO (2x SPY) and compare that to SPY for 2008 SSO was down -67.9% compared to -36.8% for SPY. i.e. half in 2x, half in bonds was less deep than 100% in 1x.
More generally a third in 3x, two thirds in bonds rebalanced periodically tends to broadly compare to 100% 1x. When however that is the years best asset and i.e. had trended upwards over the year, the gain from the best asset of the 8 tends to be larger i.e. you potentially boost the running average of yearly best asset gains - without having induced additional portfolio risk (if anything having reduced risk due to potential lower declines when the asset was the years worst performing and a third in 3x, two thirds in bonds were being held instead of 100% 1x).
A somewhat similar effect can be achieved by selecting more volatile 1x holdings as the volatile assets. For instance Small Cap Value tends to be more volatile than Total Stock Market, EDV tends to be more volatile than TLT ...etc. 2008 and 2009 EDV gained +54%, lost -36% to more or less compound out to 0% change over those two years, however the average of +54 and -36 = +9% and the nature of the 8-way is such that it tends to capture that arithmetic average gain/benefit.
Clive.
Hi Allen.
The 8 way is a form of 50/50 Permanent Portfolio (25% in each of stocks, gold, long dated treasury and short dated treasury) and Larry Portfolio (30% spicier stocks, 70% safe bonds) blend.
Some volatile (high beta), some low volatility (low beta). Of the more highly volatile a 20% one standard deviation is relatively common/persistent. Sometimes that volatility will be upwards, sometimes downwards. Stocks, gold and long dated treasury tend to have a degree of inverse correlation, such that the prospects of one asset of the 8 gaining 30% each year is relatively high. With 1/8th exposure to that asset the gain relative to the portfolio total value = 3.75%. Of the remainder (rest) the set of 7 has the tendency to break-even in real terms - again through a combination of inverse correlations in the higher volatility assets and as a consequence of interest/dividends helping to negate losses in the more volatile negative direction holdings.
The broad characteristics are likely to remain ever present, stocks for instance are likely to remain volatile as are long dated treasury as they're both long/undated 'bonds' of sorts (short dated bonds tend to have stable prices, volatile yields, long dated have volatile price, more stable yields). Gold is like a undated zero coupon inflation bond - which again will tend to have high price volatility.
Since 1972 for US data, looking at just domestic stock, foreign stock, gold and long dated treasury the average of the best performing asset each year of those four was 32% with a 20% standard deviation. Compounded (annualised) 30%. Given the choice of a portfolio with 1/8th allocation to a asset that gained 30% annualised relatively consistently and the remainder invested in a relatively stable inflation pacing return many investors would be tempted. That has the potential to be relatively consistent across economic cycles, for instance in Japan over the same post 1972 period the best yearly asset gain averaged 36% (arithmetic).
As a 'safe' asset allocation that 8-way set might be considered as 'bonds' (AIM Cash, stable value). Mix that with other assets as you see fit (or just use it as a benchmark for 'risk-free'). Most investors own their own home and benefit from imputed rent, which can be tax efficient. Selling a home to invest in stocks and rent and those stocks might barely cover the missed price appreciation of house prices and gross rent. Many stocks also own properties - such that whether you need to add yet more 'REIT' exposure ???
I was thinking that the shares of PRPFX (a version of Permanent Portfolio) could be used as a decent benchmark for someone's own investing activities
I read a draft of Jeff's book back in 2008 as per message #27019
Sorry I don't have a US version extending back that far. Here's a even longer back-look for UK

It seems to me higher stock/bond prices lowers yields, not the other way around

Hi K
changing tips to SCV improves CAGR and max drawdown somewhat. By rebalancing the 4-blend at AIM transaction-time plus when a certain max. deviation level is exceeded, 'cash' and 'stock' are always well managed. Rebalancing the 4-blend could also be done quarterly, if trades are free
been in the Ultimate strategy and fully funded since around 2009
Hi Allen
If you look back further before the charts date range in that link you posted, you'll see that there was a paradigm shift after the 1930's.
This chart is for UK, but that broadly looks relatively similar to US

In 1933 the US withdrew investment grade gold - compulsory purchasing such at around $20, to then raise the price to around $35 (75% or so price hike). That was the start of a move away from the gold standard. Nixon put the last nail into that coffin in 1968 as a means to pay down the cost of the Vietnam war.
The predominately inflation years post 1930's have not had periods of counterbalance deflation. Pre 1940's generally inflation and deflation whilst volatile broadly cancelled out to leave flat overall inflation. That ties up with the US ($) having in effect taken over the helm from the British Empire (£) as the predominant currency/politics. Empire preferred gold standard, US opted for a decoupling off the gold standard.
Either that inflationary bias will continue - where population growth is sought to sustain that model; Or it will level off to perhaps revert to a more overall flat line (but with volatility of both inflation and deflation at times); Or it could mean-revert. Sustaining ever increasing world population just doesn't seem viable. A collapse back down just seems too extreme. Accordingly my guess is that we'll see a flattening. Perhaps a return to some kind of gold standard pegged to around current levels.
Policy however is to push for inflation as that's the means for states to raises income (taxflation). With many states targeting a 2% average rate of such inflation. Central Bank manipulation to supposedly induce stability is longer term inducing greater risk of instability. It might have been better to allow the markets to free-float and accept riding through the up's and down's. Letting the banks fail in 2008 for instance rather than bailing them out. Fundamentally distils down to a short sharp pain i.e. bank depositors losing their money due to the bank failing - or a wider sharing of the cost of failure across a much wider base (entire taxpayers base). Personally I'd rather have seen the former, amputation to get the pain over and done with quickly as often there's a subsequent rebound/recovery after such pain - rather than a prolonged water drip torture (dull pain for much longer).
The path we're currently on is quite dangerous. Central Banks having moved from printing money to buy treasury bonds to now printing money to buy up stocks (around 20% of world total equity having been bought with 'funny money'). That's also unsustainable (Central Banks holding all treasury bonds and world equity = death of capitalism).
Low yields/inflation could be with us for much longer yet. As ever however they'll be volatility - typically higher volatility than 'average' as individual economies wax and wane.
For the 19th century investment rewards predominately arose through bonds - that paid a above inflation yield. For the 20th century predominately investment rewards arose from stocks (price appreciation). For the 21st century I wouldn't be surprised if investment rewards predominately arose through volatility capture.
For a simplistic 5 year bond ladder comprised of a spread of treasury, protected fixed term high street bank bonds and corporate bonds, based on actual 5 year treasury yields and assuming high street fixed term reward 1% more than treasury bonds (illiquid premium) and corporates reward 2% more than treasury bonds (greater default risk), where each bond is held to maturity and rolled into another 5 year bond (secondary market prices ignored, each years gain is the average of each bonds redemption yields) - then for US :

(chart shows progressive/accumulation gain assuming reinvestment of all gross interest. Overall annualised = 3.1% real - but much of that real gain arose out of the post 1980 period i.e. 0% real pre 1980, 4.3% annualised real post 1980)
you can see the effects of the high inflation spike that started in the 1980's. Which is a bit like treasury bonds having partially defaulted, and that has subsequently led to a premium (compensation) for such default. With that compensation in effect more recently being fully paid and assuming a flat line tendency rather than a mean reversion, bonds might again broadly reward just a inflation pacing amount.
Protracted declining yields since the 1980's had the tendency to provide above average capital gains (declining/lower yields = higher stock/bond prices). Which if now at a end might equate to forward direction lower yields, lower price appreciation (capital gains).
If prices and yields average 0% real but are volatile, many investors will be tempted to chase yields/price appreciation, only to see that falter and others taking the lead - i.e. profit chasing/buying high/selling-low. Better to perhaps take the counter-side (buy-low/sell-high) i.e. AIM.
Recent generations have become accustomed to 6% or 8% real rewards from their investments. Around 4% of those rewards however might be attributed to the high to low interest rate/inflation transition from the 1980's. 2% to 4% real is perhaps more a realistic figure going forward. 4% if you operate wisely (AIM), 0% or worse if you profit chase (opposite to AIM).
Now what does one do?
The question was what are style funds

