 News
News  Market Data
  Discover
Support: 888-992-3836
Copyright © 2023 InvestorsHub Inc.


learningboutinv
![]()
Register for free to join our community of investors and share your ideas. You will also get access to streaming quotes, interactive charts, trades, portfolio, live options flow and more tools.
Register for free to join our community of investors and share your ideas. You will also get access to streaming quotes, interactive charts, trades, portfolio, live options flow and more tools.
OT - Omandan, I recently had 4 friends that got laid off. It's scary out there. One, was on a business trip trying to drum up more business the week of Thanksgiving. They called him, told him to fly back that same day so they could lay him off. Then his wife gets a call right after T-giving on that Monday and was laid off. I fortunately have been lucky and found a job after applying to 30 jobs with one call back after 2 months of searching in the Seattle Area. (Been busy ever since with work/long hours but am happy that at least I am employed.)
So I've only been in lurk mode.
OT - I think with 300 million people in the US providing Healthcare for everyone will cost a lot more money than most people think; especially when compared to a smaller population base such as ~30million Canadians. In addition we already pay more taxes in the US than Canadians and just because there is free healthcare in Canada doesn't necessarily mean it is good or that you don't have to wait a while (months to a year) to get a particular operation done. When I was living back on the East coast I was paying 40% in Fed, State, County and Local taxes and I got hit with AMT for the past 5 years, and no, my AGI wasn't even near 100K+ it was well below.
I also think that because there is no liability limit for Doctors that is the reason why insurance is so expensive in the US. When my college roomate's wife have to deliver 20 babies just to pay for malpractice insurance that is the biggest reason why there are less Obgyns now. My sister decided not to be a Cardiac surgeon, and is still deciding on what to specialize in. But one main reason was the amount of work needed to just cover insurance costs.
I don't know of any profession where you are expected to perform work knowing full well that the person has no insurance and can't pay, but you can't turn them away and you must use your equipment, your materials, etc at a loss. I know that if I don't get paid for my Consulting work, I stop work. I turned down a recent Network/Security Consulting gig because I had doubts on whether the company was financially stable enough to pay me and I am sure the same could be said about Joe the Plumber, lawyers, construction workers, etc. But the same can't be said of Doctors.

The 15min chart that you posted shows a lot of neg. divergences. So you are probably right QQQQs are not going to go through the High of Day today. It also shows that we've been in a trading range since 10/15.
Also, we just broke 32.73 to the downside.
Gleno, I am now seeing an ascending triangle on the 10min charts. Break above ~33.06 for QQQQ and we continue higher. Watch the bottom trendline. A break below the red line ~32.73 also the 5min Inv. H+S neckline and it negates this ascending triangle pattern.

Stockchart's Example:

http://stockcharts.com/school/doku.php?id=chart_school:chart_analysis:chart_patterns:ascending_triangle_c
Gleno, yeah just checking back in. I went for an hour long dog walk. It looks like we are currently retesting the break of the neckline on the 5min qqqq charts. I haven't been trading for the past two weeks. At this juncture, I am just paper trading and trying to sharpen my TA skills until a new IT trend emerges.
Well... The 1st inv. H+S failed now it looks like another inverse H+S on the 5min QQQQs? We need to break the neckline @ ~32.73 though.

OT - Gleno LOL. Apparently quite a bit of people believe he is the second coming, he can fix everything and do no wrong. But I say: "... beware of false prophets". LOL...


This site is actually kind of funny:
http://www.obamaformessiah.com/
http://obamamessiah.blogspot.com/
Yup.... Inv. H+S signal negated after a drop through 32.50 on the QQQQs and a failure on the right shoulder.
Blasher, I still remember when I hit the jackpot in 1999 for the first time making more than the SS limit.
It's up to 102K now for 2008. Look at how fast it's gone up since 1999. It's only a matter of time before they raise it from 6.2%. (Not good if you're self-employed - paying double @ 12.4% or run a business -paying the other half for the employee.)
http://www.ssa.gov/OACT/ProgData/taxRates.html
SSA - Tax limit since the inception in 1937.
http://www.socialsecurity.gov/mystatement/maxtax.htm
Gleno, possibly inverse H+S on the 5min QQQQ charts. ~33.06 is the neckline, 31.76 the head from yesterday's late afternoon selloff. Target move if we break 33.06 would be 34.36.
G, yeah, a break of 1200 would be the nail in the coffin, and since the descending triangle is a bearish continuation pattern we will see prices accelerate to the downside. The measured move would be 270 points so ~930 for the $NDX.
Gleno, could be a descending triangle forming on the 60min $NDX. We need to see what happens @ 1200. On the other hand there is a small chance that it could be a triple bottom.

Euterpe1,
Sorry for the late reply. Been so busy today didn't really have a chance to look at the markets.
In terms of Renko, it's an Interim term/daily system where there's no indicator expect for price itself. Renko is lagging btw. Anyhow, I use the daily renko charts as an End of Day/market close type system. You can front run it by 15-30mins before the close if it looks like the renko chart is reversing trend and the price will stick at the close.
But, yes, there are possible whippage with renko just as there are with any system. If you take the 1st box reversal, it is always prudent to put a stop 2 boxes below or a certain percentage of what you are comfortable with.
For example on QQQQ, at 33.60, a green CIT (Change in trend) brick was printed. If you enter in around 33.60, put a stop at or slightly below 32 (each box is .80) so a 2box reversal is $1.60 and would be another change in trend back down.
This is a hypothetical example since QQQQ closed up with two green boxes. So a CIT to the downside would now be 32.80. If QQQQ closes at or below 32.80, a new trend has emerged to the downside.
I have been looking at trying to minimize the whippage by confluence of other charts/indicator. If you take a daily candlestick chart of QQQQ and look at the MACD, notice that it has not crossed to the upside so I am a bit weary about this latest renko reversal to the upside.
http://stockcharts.com/h-sc/ui?s=QQQQ&p=D&yr=1&mn=0&dy=0&id=p64854739407
Fox, yes on Renko, QQQQ and MVV both got a CIT to the upside. Renko uses a 2 box reversal while most P&Fs uses 3 box reversals. (Not saying I am a renko master, but I have been using Renko to Interim trade a 1/3 of my entire portfolio.)
http://investorshub.advfn.com/boards/read_msg.aspx?message_id=32835917
http://stockcharts.com/h-sc/ui?s=MVV&p=D&yr=0&mn=7&dy=0&id=p83390293893&a=137225579
Gleno, CIT (Change in Trend).
Now I wish I didn't sell all those QLD shares on Friday afternoon 15min before the close. I picked them up on Friday @ $30. Although I am still holding on to the ones I picked up earlier at $36.70 and $38.
http://stockcharts.com/h-sc/ui?s=QQQQ&p=D&yr=3&mn=0&dy=0&id=p91921891006
Also, I couldn't play today, no cash. I forgot the banks were closed and I transferred my ST trade money out of the Municipal Bonds/Money Market account to my savings account.
Well, at least the the Nasdaq Composite and Rut closed green today. But the more important indexes NYA and XII closed red.
Gleno, that blows, but didn't you make a bundle by buying that gap down this morning? I didn't wake up early enough to play it. I'm still hurting from my climbing trip. The older I get the less I am able to sleep well on the ground.
It sure would be nice for people to see green across the board for a change even if it's +1 at the close. LOL...
Just tagged the 5min 233 magnet on the QQQQs. Watch 32.80 on the close for a trend reversal on the renko. (Not sure that will happen today.)
http://stockcharts.com/h-sc/ui?s=QQQQ&p=D&yr=3&mn=0&dy=0&id=p88503457320
Gleno, we have to hit the 5min 233ma on the QQQQs at some point. We were so far below it. Scamman use to say it's a magnet. The magnet is at 32.18 which I'm not sure we'll hit it before the close today.
I had one QLD trade today and left a bunch on the table since I wasn't anticipating a big rampo job into the close. I thought another major selloff again. Also, still foolishly holding the other two positions from the other day.
2xer, good to hear from you.
BTW - this is an interesting Credit Market Indicator chart from Pcyhuang on the investor village board. If credit squeeze/lack of credit is an issue it is good to see that may be the feds are starting to be able to break the gridlock.
http://investorvillage.com/smbd.asp?mb=6863&mn=3850&pt=msg&mid=5829570
Gleno, coming back up to that 233 again on the QQQQs 5min @ 33.57. Let's see if we get repelled again. If so that would be for the 9th time.
Gleno, the markets just can't make it past the 233ma on the 5min chart. The QQQQs have hit the 233ma 8 times since 10/1. I guess we will see what happens next with all the MAs constricting and coiling. Makes you wonder if the coiling of MAs is base building or another dump coming like last Thursday, 10/2.
Foot, here is another interesting factoid from positiontrader on the ajtj board:
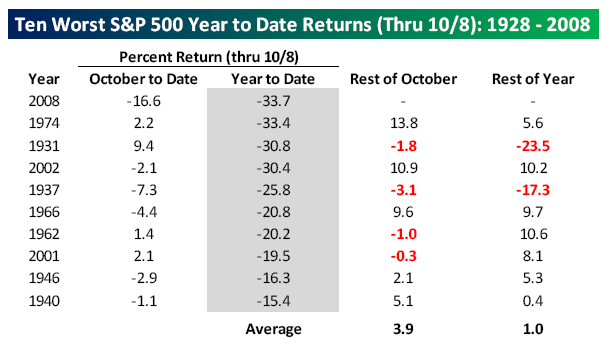
"Just in case you were thinking that it's you feeling worse than you've ever felt with respect to the current decline, it's not. It's the market. Year-to-date, this is now the worst decline in U.S. stock market history."
So it appears that the markets went down even further and that was during the great depression in 1931 and 1937.
http://seekingalpha.com/article/99086-it-s-not-you-it-s-the-market-now-officially-the-worst-s-p-decline-in-history?source=more_author_recent_similar_articles
Not sure if you have seen this data:
"The table below reflects the dates of the rate cuts, the depth of each rate cut (in basis points), and the returns of the SPX from the day of to 20 days following the rate cut. At the bottom of the table, we tabulated the average returns and the winning percentage (percent positive after X days)."

http://www.schaeffersresearch.com/commentary/content/marketimplicationsofthefederalreserveratecut/observations.aspx?ID=88283#88283
Gleno, wow... if true. At this rate we may hit those numbers. LOL...
"1931. The total decline in the Dow came to -89% and took just under three years, September 1929 to July 1932. 1931 came in the middle of that horrific Papa Bear market so that’s dismaying for us today. But, similar to the bottom in 1974, the 1932 bottom came after a grinding last leg down in stock prices. From March through July 1932, we saw an inexorable day-after-day, four-month decline totaling -54%. Whew! Schwartz View: Trading volume was the distinguishing characteristic of that market bottom, shrinking up noticeably."
http://siliconinvestor.advfn.com/readmsg.aspx?msgid=25040147
Yup... no one wants to hold overnight worrying about who's shoes or shorts are going to drop next. Anyhow, what happened to Be and 2timer?
I guess we'll find out in the next 5 mins whether the 233ma on the 5min is going to act as resistance again. Volume is unimpressive when compared to Monday.
This won't flip to green til QQQQs hit and close at or above 34.40. Last flip in September was a whip so make sure you have a stop in place.
http://stockcharts.com/h-sc/ui?s=QQQQ&p=D&yr=3&mn=0&dy=0&id=p36183187998
Gleno, thanks, I was just about to post $34 on the QQQQs looks tough, the 5min 233ma.
Gleno, I got in today at QLD $36.70 and another at $38.01. I guess we will see what happens. Everyone is expecting a 1-2 month DCB (Dead Cat Bounce). Probably be a 3 week deal since we are in a bear market.
Gleno, LOL... it will probably occur on 10/9. I forgot about the old Wall St. Adage! 10/9 is also after Foot's worse time to buy stock is between the 1st of the month to 8th of the month.
http://investorshub.advfn.com/boards/read_msg.aspx?message_id=32702936
BTW - Yom Kippur starts on 10/8 and ends on 10/9.
Gleno, Just looked at the TRINQ chart again. It appears that on 10/1 trinq closed at 2? I can't really tell from the candlestick for 10/1. May be you or someone else can see what the closing day basis was for TRINQ on 10/1. On 10/2 it closed @ around 5.5.
BTW - Cheap land? Where are you looking in East Oregon or are you just joking?
Here is a recap of the DD and in 3-5 biz days a possible ST rally?
From: scamman
Replying To : screentrader (post 46378)
May 14 2002 2:34PM
Title: the Double Deuce
Hi Screen - Thank you for the compliments - certainly Vess, Foot & Fund are deserving of high praise for their consistent efforts. And there are many others as well! I am just an amateur, and I have learned the hard way. I have found a few things that seem to work - so I share them with anyone who cares to steal money from the market-makers!
BTW, speaking of buy signals - the "Double Deuce" has worked like a charm this month! My Modified Double Deuce theory is that when the Arms Index on either NYSE or Nasdaq is 2 or higher on a closing basis on back-to-back sessions, there will be a significant rally within 3-5 sessions. The Nasdaq Trin on May 1st was 2.07; on May 2nd, 5.77; on May 3rd, 2.86 - got the rally on May 8th; on May 9th, 2.70; on May 10th, 4.24 - got the rally May 13th-14th.
Of course, the Rule of Three kicked in basis the Dow on May 8th. Again, regardless of which index or exchange triggers the signal, I will trade the OEX.
I agree with Vess that it is silly to talk about a "new" bull market based on the Double Deuce, but it sure as hell can make you a lot of money on a short-term basis! Which, after all, is what Arms or Trin or STI is - a short-term trading index! (The OEX May 535 call hit a low of 1.65 yesterday - and a high of 10.40 today!)
Use the Rule of Three and the Double Deuce - and you've got'em coming and going! And you can go diving wherever and whenever you want!!
BTW, thanks for the lovely quote from Dickens.
Gleno, just checking in. I have been away on another climbing trip on the east coast. Wow... Well the good news is if we close above 2 on the TRINQ we'll have a rare scamman double deuce. That means a high probability of a rally. (Edit - nevermind. I was looking at the TRINQ chart wrong. It's high of day yesterday was 4.68 but closed below 2. So short is the way to go still.)
Gleno, foot's $CPC chart is getting awfully close to a bottom.
Also, $NAMO shows a divergence. COMP made a lower low but $NAMO made a higher low. I think we are getting close to a tradable bounce. Plus, your 12-15 higher highs on the VIX/VXO.
http://stockcharts.com/charts/indices/McSumNASD.html
We could be carving out a new range between 1.1 - 1.3. Always the case in a bear market with a rise in fear. Look at the VIX and VXO where the range was between 20-40 give or take 5pts. between 2000-2003.
Gleno, I'm outty! Sold all my QLD 5 mins ago.
3rd time hitting resistance at the 20ma on the 5min charts for the QQQQs @ 41.09
Ok... Back to talking about trading. Gleno, do you think the QQQQ gap down this morning is going to get filled? (Edit QQQQ gap is at 41.48)
I sold my QIDs early this morning during the gap down, switched sides and bought some QLDs. I don't plan to be holding over the weekend.
Ooh... Saved by the bell... it was sure tanking that last 2 mins. QQQQ closed on the LOD @ 40.88.
So still a green brick but barely.
http://stockcharts.com/h-sc/ui?s=QQQQ&p=D&yr=3&mn=0&dy=0&id=p34570960094
Gleno, getting close to 40.80 on QQQQ, but we must close below 40.80. On the Interim Term/Daily that would signal a reversal back down.

