 News
News  Market Data
  Discover
Support: 888-992-3836
Copyright © 2023 InvestorsHub Inc.


Register for free to join our community of investors and share your ideas. You will also get access to streaming quotes, interactive charts, trades, portfolio, live options flow and more tools.
who loves horses more than i do huh
If it doesn't break the wrong way. Pro day traders have moved on IMO and without some positive action it could just as easily break south, crossing .20 support and fill the gaps below.
lowtrade will buy ATRN @ .30?
But there has been a positive pattern forming and ATRN should go back on strong watch for pennant breakout entry @ .30.
Strong watch FCEL for a flag break.
http://stockcharts.com/h-sc/ui?s=FCEL&p=D&yr=0&mn=3&dy=0&id=p06948824243
Small entry @ 1.55 trendline break and larger @ 1.75 resistance.
PCFG
Expect a short term climb to .0185/.02 resistance, on TA signals. 5,10,20 & DMI signaling early entry at decision point, with good support indicators.
http://stockcharts.com/h-sc/ui?s=PCFG&p=D&yr=0&mn=3&dy=0&id=p43557560498
Island reversal channel forming third bottom bounce, while on watch for new darkside action. Channel 40% .0135 to .0185. Presently news and funding starved. Day traders keeping volume at 1 mill level needed for single zero stock play.
Buy the day trade bottom bounce around 10:30 am. Play at your own risk.
thanks for this video and explanation--also your "you don't fool with something that works" says a whole lot--gl
ATRN "I personally have no idea why"
I believe its because of the Management, Products, Real Company, with earnings/revenues, and people are awaiting 10Q and 10k.
I just noticed gold took a heck of a beating today. The $ is up but not that much so there must be something else the gold bugs didn't like in addition to dollar strength.
http://stockcharts.com/h-sc/ui?s=UUP&p=D&yr=0&mn=6&dy=0&id=p77979022709&a=244704574
No news, but quite a few things "cooking".. Spyder countdown starts tonight.. Couple of 8ks due.. And facebook hosting an invite only party today, with an officer from ATRN there.. The herd is super worked up today lol
It's required for me. LOL I don't always agree with books.
The volume pattern you describe is not always required.
Volume: In an ideal pattern, volume levels will track the shape of the rounding bottom: high at the beginning of the decline, low at the end of the decline and rising during the advance. Volume levels are not too important on the decline, but there should be an increase in volume on the advance and preferably on the breakout.
http://stockcharts.com/help/doku.php?id=chart_school:chart_analysis:chart_patterns:rounding_bottom_reve
In the case of ATRN the stock dropped on very little volume and bottomed on huge volume because that is where the conversion price was reached and shares converted and sold. However, there is no way to put a value on the breakout volume in the case of the rounded bottom breakout (the pennant breakout may be occuring now...the rounded bottom breakout has yet to occure) because there is no way to know what the true float is until it is reported.
Hi Lowtrade, it think it has something to do with this!
http://www.atrinsicspyder.com/
Heads up for NWSA
Order closed @ 20 for target of 21.25 on ascending triangle break today.
http://stockcharts.com/h-sc/ui?s=NWSA&p=D&yr=0&mn=3&dy=0&id=p90816494099
The difference between cup & handle continuation pattern and rounded bottom reversal pattern is resistance break, on increasing volume for the rounded bottom. And most obvious the prior up trend for cup & handle.
Need to think about mindset leading into and out of the formation.
With the rounded bottom trend is negative and with resistance break on increasing volume, conformation is seen for a mindset change, at that previous high resistance level. Thus it's called a reversal in mindset.
With the cup & handle trend is positive and with stall and basing at high resistance, mindset determines if continuation is warranted during the handle. Once handle break occurs mindset continues positive and continuation is confirmed at high resistance break.
If no prior up trend is present in a cup, or increased volume at previous resistance in a bottom. Then neither similar U shapes has anything to do with calculation of a projected price movement. Because the pattern requirements are not there and the pattern is not there, only the U.
The key to the cup & handle is handle break before 61% FIBs and the key to rounded bottom is increasing volume at high resistance. With out those, both patterns should be thought of as unreliable and not traded for pattern projections.
With the cup & handle pattern. I have made personal restictions of lips within 5% of each other and handle break before 50% FIBs. Only because experience has shown me, if these are not present, projected target is rarely completely reached. For rounded bottoms, I like 3 days of increasing volume or a one day volume double to feel confident projections will be reached. Again personal restictions.
I've yet to find a TA reference source that doesn't require an uptrend prior to a cup and handle formation. In all sourced references a downtrend bottoming pattern similar to a cup and handle is called a rounded bottom.
In all, it may be just a matter of semantics in that the apperance is the same and method of target calculation is the same for both.
That is actually called a down channel. With upper channel break wihich also breaks $34 resistance. Enrty is OK and short term target would be $38 gap fill.
ATRN
Both TA_Sleuth & PoorboyMcCoy are correct about a cup & handle pattern. No cup & handle up trend continuation pattern.
But there has been a positive pattern forming and ATRN should go back on strong watch for pennant breakout entry @ .30.
I personally have no idea why. There has been no news to create new retail emotion. But the pattern is there, Volumes still above 1 mill needed, at 5 mill. And a few well timed buys could start this one over again. The concern area would be decreasing volume, without and price pop before .20 support, to cause it.

SUGO is on weekly watch for attention price & volume surge.
http://investorshub.advfn.com/boards/msgsearchbyboard.aspx?boardID=3972&srchyr=2011&SearchStr=sugo
Remember 100 mill average daily volume is wanted for triple zero stocks. So volume pops to 100 mill are not very large pre play accumulations. Right now the average daily volume is 15 mill. Weekly watch area, until we see that price and volume advertising surge.
AEGY 35 million float sub penny very thin just needs volume
Today it dropped, guys had puts on this with strike prices way below where it was trading yesterday, I don't know to much about options, but if your looking to make a profitable trade you need to take them into consideration, IMO.
Same here, and there's very good gap draw all the way past $2 and very little in the way to get there except normal profit taking. This'll be one for the books, I think. But for it all to work retail needs to hear what they want.
thanks....I'll play the gaps on this one
It's an estimated target. If you use the flag pattern or the rounded bottom pattern for calculation it comes out about the same. However, the current past area of consolidation it is working its way through is the only area of consolidation before the 2.25 area, although there are gaps to be filled between here and there.
http://stockcharts.com/h-sc/ui?s=ATRN&p=D&yr=0&mn=3&dy=20&id=p55042303137&a=256526811&listNum=1
understood....where do you get target of .60? tia
Not a cup and handle...a cup and handle forms in an uptrend as a continuation pattern. ATRN is in a rounded bottom pattern and is currently in consolidation pennant. Target is in the .60 area.
BTW, rounded bottoms are one of the most dependable patterns.
LOL, I think the flag pattern is a little different then the cup & handle pattern. C & H patterns are long term plays, flag patterns are short term plays. So I don't think you can rely on SLV being a flag pattern.
yep.. ATRN 2 girls, 1 cup and handle pattern... giving me nightmares, run already sucka
lowtrade is not the king of the stock world... lolzzz... Welcome to my mind! 
ATRN is going to ROCK more... don't let anyone fool ya
In addition I also believe the left "lip" of the cup needs to be formed on an uptrend, not a downtrend like it is here as a C&H is technically a continuation pattern.
Hello lowtrade. Can you let me know your thoughts on SUGO?
http://stockcharts.com/h-sc/ui?s=SUGO&p=D&b=5&g=0&id=p07929166637
Three big vol spikes near the 100 mil mark with limited price movement. Weekly watch for 100 mil avg volume and retail interest.
Not if you look at a longer chart; tops have to be within 5% of each other.
I'll await lowtrade's comments
If CYBI breaks above resistance I was wondering how you would play it? I am not sure if a candlestick tale counts as bouncing on the 50%. Or is it a 100% pole play? Thanks.

EVGI making nice move guys on radar it
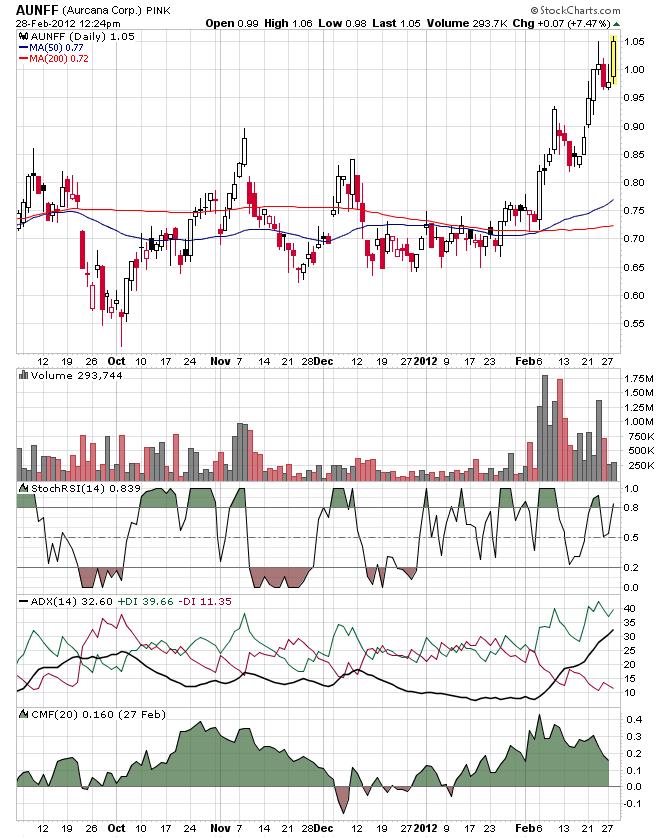
Third generation Flag breakout for AUNFF.
I'm thinking of an entry at .009 and a minimum of 5MM volume. What do you think?
The force, strong in you, I see
(in my Yoda voice)
Weak volumes for a triple zero stock.
I don't think anybody did. I guess that puts the exclamation point behind "never buy and hold through earnings release" or any major event for that matter. Somebody panic sold and started the cascade of sells. Of course the big runup before didn't help any either. RSI was over 70.
Projected target was hit. But didn't expect a fall like that.
http://stockcharts.com/h-sc/ui?s=PEIX&p=D&yr=0&mn=3&dy=0&id=p31507332561

Looks like PEIX is going to retest the point of breakout from the ascending triangle. Made some money buying the AH panic drop and selling this morning's oversold run.
http://stockcharts.com/h-sc/ui?s=PEIX&p=D&yr=0&mn=6&dy=0&id=p14545234599&a=208255211&listNum=1
Still watching EXTO. Channel seems to be moving upwards. Put on daily watch.
Was digging around and found this one, too.
ICBT and SMHS on watch / pond fishing setup
ICBT they raised the AS


Thanks for the analysis.
BPAX
You involved with an Island reversal which has progresses well. But your asking for retail reaction to news. And Because chart & TA has no techincal info showing any pattern price projection. Any call would be speculation.
As for the chart, any re-entry should be above $1.00, when resistance is broken. They had good news on valentines day also, with no follow through. Wouldn't expect anything different now. I'd want resistance break, to confirm change in mindset.
http://stockcharts.com/h-sc/ui?s=BPAX&p=D&yr=0&mn=3&dy=0&id=p73634294438
PS; your also looking at 19% short interest fighting evey pop.

| Volume | |
| Day Range: | |
| Bid Price | |
| Ask Price | |
| Last Trade Time: |


