 News
News  Market Data
  Discover
Support: 888-992-3836
Copyright © 2023 InvestorsHub Inc.


Register for free to join our community of investors and share your ideas. You will also get access to streaming quotes, interactive charts, trades, portfolio, live options flow and more tools.
SPX Cycles Overdue & Future Phases Report that automatically updates:
<iframe src="https://docs.google.com/spreadsheets/d/1MM-R0bBKysIw4P231E9jasa6g9QAI4fVUgRUgDvkgeQ/pubhtml?gid=1293883303&single=true&widget=true&headers=false"></iframe>;
SPX Cycles Indicator's Report automatically updates:
<iframe src="https://docs.google.com/spreadsheets/d/1MM-R0bBKysIw4P231E9jasa6g9QAI4fVUgRUgDvkgeQ/pubhtml?gid=657077088&single=true&widget=true&headers=false"></iframe>;
SPX Cycles Daily Status automatically updated:
<iframe src="https://docs.google.com/spreadsheets/d/1MM-R0bBKysIw4P231E9jasa6g9QAI4fVUgRUgDvkgeQ/pubhtml?gid=1759473798&single=true&widget=true&headers=false"></iframe>;
updated S&P chart and targets
http://wizeeconomy.com/2016/02/01/sp-500-chart-february-1-2016/
The S&P 500 has been in the sideway range between $2040 and $2134 since February 4 of 2015. This is 4.4% range if you count it from the bottom line of this side-way corridor and this is 5-month trend. Last time we had such long side-way trading in January - August of 2011 when S&P 500 index was moving in the range between $1250 and $1370. At that time it was 8 months of the side way action. The same as now, it was about 100-120 points range. The only difference, in 2011 it was 9.6% range and now it is only 4.4% range.
In August of 2011 the S&P 500 index exited this side-way corridor by crashing down to $1090 which is 20% from the high at $1370. I an not telling that we will have 20% correction down, however, taking into account that we had strong steady uptrend without any decent corrections on the S&P 500 for several years (since 2011), we should not disregard such possibility.
So far, it is difficult to expect a deep correction when volatility remains at low levels. The low volatility is the sign tat majority investors are still confident - they are not in panic yet.
Right now, still the majority of the S&P 500 stocks (279 stocks) are traded closer to their 52-week highs. See at
SPX - High-Low Range Chart
On the other hand, since May 29, 2015 majority of the stocks from the NYSE Composite index are traded closer to their 52-week lows - they are clearly bearish. Today it is 1108 bullish (stocks traded closer to their 52-week highs) versus 1688 bearish (stocks closer to their 52-week lows). See at
NYA - High-Low Range Chart
Last time such high number of bearish stocks on the NYSE was seen in October of 2014 when the NYSE composite index had 11% correctional move down.
We may say that the strongest US stocks which are listed in the S&P 500, DJI and Nasdaq 100 indexes still hold the market, yet, the rest of the market is quite uncertain. The Dow Jones Utilities index already declined almost 15%. The Dow Jones Transport is also 13% down and it does not look like any of this indexes are going to reverse up. This was not the case in 2011. At that time we had a side-way range trading across all indexes. Now, we have oil, gas, materials, utilities and transportation market sectors in a decline. Somebody may argue with it, but look at those indexes charts - the indexes covering these sectors are in decline and they are in decline not for just a couple of months.
I an not stating that the market will crash tomorrow. We are entering the summer season and we still could have "lazy" side-way trading. Yet, I think that should we have negative Greece output, it could trigger a strong correction. The decline on June 29th show that the market has a room to slide down and it does need high trading volume to do it - strong decline on that date did not generate strong volume surge - it tells us that there are not a lot of bullish trades ready to jump in and to stop a decline.
northam43
thanks for the reference to the spxcycles site.
I am giving up posting on I-hub. It is to much work to post in 4 different locations. Don't like the format here.
You can view my current reports at my website or you can follow SPX Cycles on facebook at "SPX Cycles" or "Trade Trends"
My website is updated most every trading day.
http://northamlindyjr.com/SPXCycles/SPXCycleReports/SpxCycleReportsWebpage.html
User ID: spxcycles
Password: stock
You can also e-mail me at northam43@yahoo.com, make sure you put in the subject line SPX Cycles or I may delete it if I don't know who you are.
Current Status Report:
The 60 min MACD is now below the zero line. So that would make the 60 min P2 short, and it looks like an extended 60 min P1 could be confirmed at the end of this hour. An extended 60 min P1 projected low will be 1810.62. Tomorrow we may finally get a Daily P1 confirmed

Closing Bell Status Report:
http://northamlindyjr.com/SPXCycles/SPXCycleReports/SpxCycleReportsWebpage.html
User Id: spxcycles
password: stock
Updated Status Report:

Updated Status Report:

Updated Status Report:

Closing bell status report:

Updated Status Report:

SPX Cycle Status Report:

Closing Bell Status Report:

Updated Status Report:
SPX Cycles Current Status:

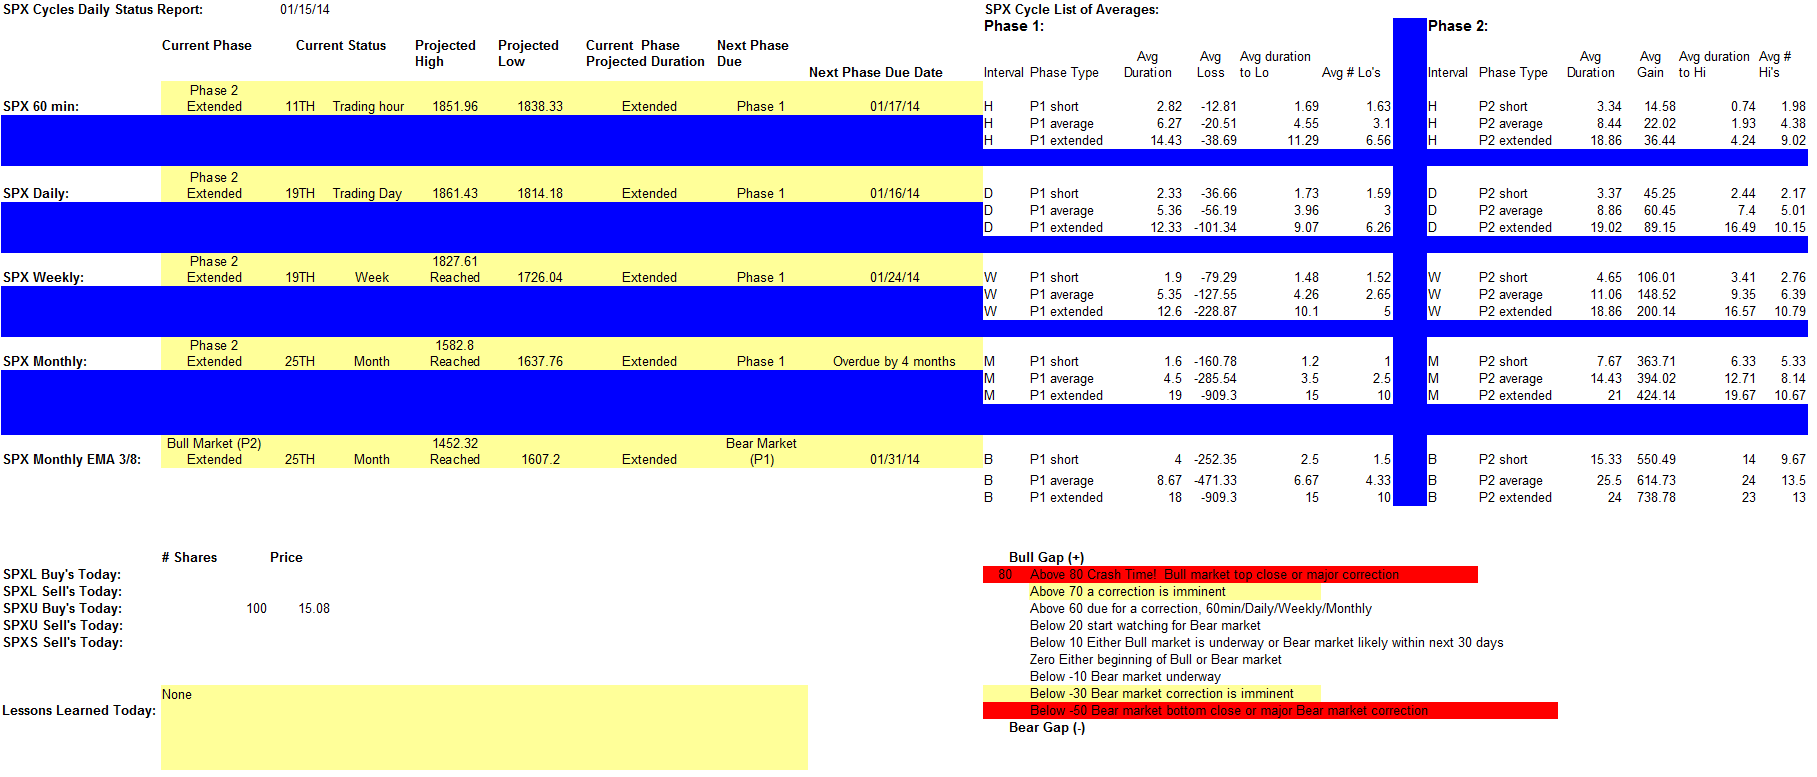
The SPX Daily extended P2 continues the projected high is 1861.43, the SPX 60 min confirmed an extended P2 at the open, the projected high is 1851.96. Tomorrow the 60 min & Daily extended P2's are projected to continue, then Friday a 60 min P1 & Daily P1 are currently projected, with a 60 min low currently projected at 1828.1
The SPX Daily closed right at the UTL. So tomorrow could be another nail biter. On the flow chart for tomorrow is a 60 min P1 and 60 min low, the current projected low is 1818.9 that's for an average 60 min P1. If the SPX opens down, then a good chance that we finally get a Daily P1 confirmed, and if the SPX opens up, then the Daily extended P2 will continue for another day. The only projected high is the Daily extended P2 which is at 1861.43 it is now two trading days overdue.
The only thing on the flow chart for tomorrow is a Daily P1. Then Wed a 60 min extended P1 low is due, the projected low is 1804.76, and then a 60 min P2 will be due and 60 min high, the current projected high is 1836.19, which would likely keep the Daily in P1, then Friday a Daily P1 low is currently projected, the current projected low is 1789.44, so not a lot going on this week, but all pretty much down hill.
SPX 60 min has confirmed an extended P1. The average 60 min extended P1 lasts 14.43 trading hours, the 60 min extended P1 projected low is 1804.76, a 60 min extended P1 low is normally put in by 11.29 trading hours
At this point it looks like the 60 min will confirm an average P1 at the end of this hour, the projected low for an average 60 min P1 will be 1822.94, if it confirms an extended P1 the projected low will be 1804.76
Looks like the projected extended 60 min P2 will be negated at the close of this hour, and a good possibility that a 60 min P1 will be confirmed at the end of the next hour
This morning the projected 60 min extended P2 continues, the projected high is 1872.91, also today the Daily extended P2 high is due, then Wednesday a 60 min P1 is due, and Thursday a 60 min P1 low is projected, the current projected low is 1823.2, also Thursday a Daily P1 is due. The Daily UTL is currently at 1838.9, and the Daily LTL is at 1829.04, so if the 60 min P1 reaches it's projected low, that would take the Daily well below it's LTL and a Daily P1 would likely be confirmed.
By looking at this Daily Summary Report, you would think we should fall off the cliff this month. The 60 min & Daily have been raising the projected highs. However, the 60 min & Daily Extended projected highs end on Monday. So there will need to be at least a 60 min P1 to continue the upside. Wonder where we end at the end of the month?

Monday a 60 min extended and Daily extended P2 high is due, the projected high is 1872.91, then Wednesday a 60 min P1 is due and Thursday a Daily P1 is due
The SPX 60 min closed in an average P2. Tomorrow the only thing on the flow chart is the continuation of the 60 min P2, with a 60 min high projected at 1852.4, if reached that will be another SPX all time high.
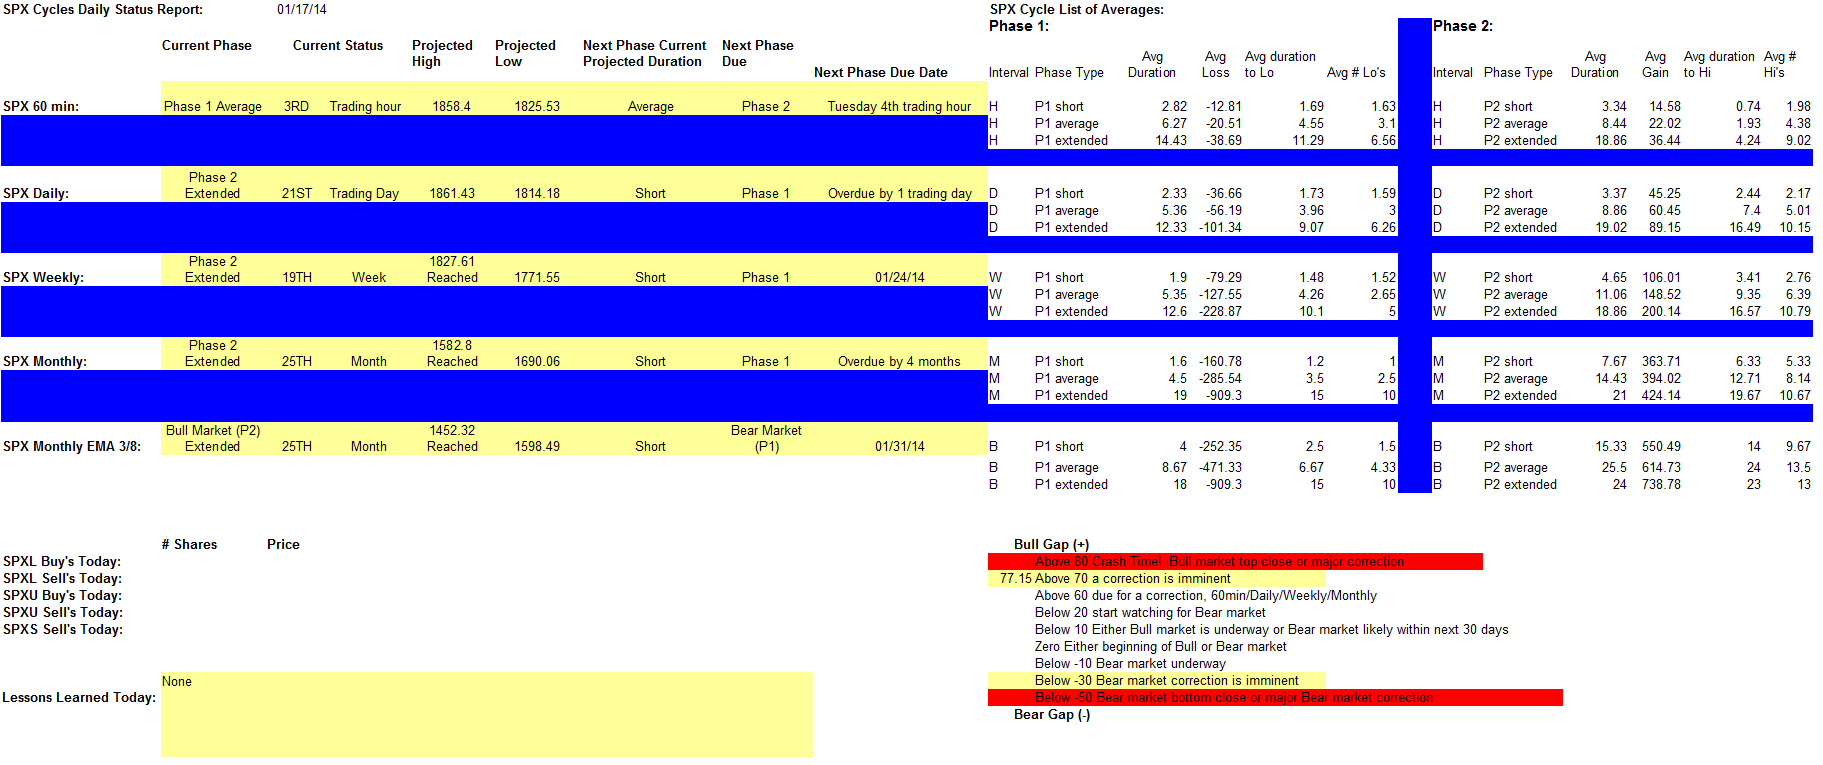
The SPX 60 min closed in a short P1, a 60 min short P1 low is due the opening hour, the projected low is 1827.21, and unless an average 60 min P1 is confirmed in the morning, a 60 min P2 will be due at the 3rd trading hour, and a 60 min P2 projected high of 1852.81 is currently projected by the 4th trading hour. The Daily will likely remain in P2 at the open, unless the futures are down a few points. If by chance the Daily does open in an unconfirmed P1, unless the 60 min confirms at least an average P1, the Daily P2 will likely continue. So there is really no clear picture at the present time for short term, medium term or long term. The upside is likely limited to 1861.43 which is the extended Daily P2 projected high, after that there is nothing to the upside projected, the only way to get higher projections is for the 60 min, Daily, Weekly, Monthly to correct.
Tomorrow the only thing going is the 60 min extended P2. Then Thursday a 60 min P1 will be due.
So once again a Daily P1 has been averted. The 60 min has now confirmed an average P2 with a projected high of 1845.75, and could possibly confirm an extended P2 at the end of the next hour. On the downside, the next 60 min P1 current projected low is 1819.7, that is well below the Daily LTL.
SPX 60 min has now confirmed an average P2. The projected high is 1845.75.
The SPX 60 min could go either way in the morning, it could open as a P2 or as an extended P1. It closed today as an average 60 min P1, but the EMA 3 was just above the 60 min LTL and in after hours dropped below the LTL. If the 60 min opens as an extended P1 then the Daily will open as an unconfirmed P1, right now the 60 min UTL is below the Daily UTL, so the 60 min could come up for a gasp of air and back down into a new P1 keeping the Daily in P1 territory. Now if tomorrow during the closing hour it looks like the Daily will confirm a short P1, I will be looking to add a SPXL position, because an average short Daily P1 lasts 2.33 trading days and the low is normally put in by the 1.73 trading day, the projected low for a short Daily P1 will be around 1812. If the Daily confirms an average P1 I will hold off adding SPXL for possibly a couple days. Now the SPX Cycle Study Flow Chart is projecting a 60 min P2 in the morning with a possible 60 min high tomorrow of 1845.54, that's if it's an average P2 but even a short 60 min P2 will get the SPX above 1833 which will keep the Daily in it's extended P2 for at least another day. So tomorrow I might have a buying opportunity.
This morning the Daily continues in extended P2 for another day. The 60 min confirmed an extended P1 with a projected low of 1798.51 which is due tomorrow afternoon, then Wednesday a 60 min P2 is due with a current projected high of 1844.83, that projection will go down as the current 60 min P1 makes new lows, so I will be updating the flow chart through the day as new lows are made. If the 60 min P1 continues to extend as currently projected, tomorrow will be another chance for a Daily P1, which is looking like a short P1 at present.
The SPX Daily closed once again below the Daily UTL, and the 60 min closed below it's LTL, so both the Daily & 60 min are aligned to have a coordinated P1 on Monday. So Monday the 60 min could get a confirmed extended P1 in the opening hour, which could be a drop of 38.69 points and the Daily could get a confirmed average P1 at Monday's close, which could be a drop of 56.19 points.
SPX 60 min confirmed a short P2. The average 60 min short P2 lasts 3.40 trading hours, the 60 min short P2 projected high is 1843.71, a 60 min short P2 high is normally put in by the .74 trading hour.
The SPX 60 min has confirmed an average P1. The average 60 min P1 lasts between 2.83 to 6.27 trading hours, the 60 min P1 average projected low is 1817.73, the 60 min low for an average P1 is normally put in by the 4.55 trading hour, we are currently in the 5th trading hour, so the low is likely in.
The SPX 60 min has confirmed an extended P1. The average 60 min extended P1 lasts 14.43 trading hours, the extended 60 min P1 projected low is 1799.55, a 60 min extended P1 low is normally put in by the 11.29 trading hour.
Well the 60 min extended P1 yesterday did get 1 hour of extended time. So no Daily P1 today. It looks like the 60 min P2 is coming to an end this hour and it's looking like another extended 60 P1 is likely, that could open the door for a better chance at a Daily P1 on Monday.
The SPX Daily did close below it's UTL, so with the 60 min in an extended P1, there is a chance for the Daily to confirm a average P1, if a Daily average P1 is confirmed the projected low will be around 1789.89
The SPX 60 min has confirmed an extended P1. The average extended 60 min P1 lasts 14.43 trading hours, the extended 60 min P1 projected low is 1810.75, the low for an extended 60 min P1 is normally put in by the 11.29 trading hour, this 60 min P1 is currently in it's 6th trading hour, so a 60 min low will be due tomorrow during the 4th trading hour.
The SPX 60 min has confirmed an extended P2. The average 60 min extended P2 lasts 18.86 trading hours, the 60 min extended projected high is 1875.48
Today the 60 min went back and forth in short cycles. That can either be indicating a consolidation before another leg up or could be indicating that a top is forming. Tomorrow the Daily P2 will be in it's 9th trading day, the average Daily P2 lasts 8.66 trading days, we projected this Daily P2 to be an extended one, and unless the SPX crashes tomorrow, the Daily P2 will be extended at tomorrow's close. With the Daily still solidly above it's EMA 3, what I expect may happen is since the last four 60 min P1's have been short, I will be looking for an average to extended 60 min P1 with a low in the range of 1821.1 if average and as low as 1802.94 if extended, the average 60 min P1 could take the SPX to the Daily UTL, the extended 60 min P1 could take the Daily below it's LTL and put the Daily into a P1, the Weekly UTL is currently at 1802.91, so if a Daily P1 was confirmed, it could send the Weekly into a P1, so we could have a domino effect here.
Have we hit a top? The 60 min dropped below it's UTL several times today but could not get a 60 min P1 confirmed, the 60 min P2 completed 42 trading hours, the record is 53 trading hours, so by Tuesday a 60 min P1 should be confirmed or a new record will be established. Next week on Thursday the SPX Bull extended high is due (the projected high has already been exceeded), then the following week, an extended Weekly P2 high is due (the projected high has already been exceeded), and then the next week after that, an extended Daily P2 is due, the projected high is 1861.43, then after that there are no more projected extended highs.
SPX continues to make all time new highs. I'm still looking for a 60 min P1 which is now overdue by 15 trading hours, the 60 min P1 current projected low is 1824.3, the gap between the 60 min LTL and Daily UTL is 17.15 points, with that big of gap, the 60 min will likely have at least a couple more complete cycles (P1/P2) before a chance of a Daily P1. So it's looking pretty good for the extended Daily P2 to reach it's extended projected high of 1861.43, which is due Jan 14th.
SPX continues making new all time highs. The SPX Monthly EMA 3/8 Bull gap closed at another all time high at 84.59, the 60 min extended P2 has now completed 35 trading hours, the next 60 min P1 projected low is currently at 1822.2, the Daily P2 has only completed 6 trading days, lots of room for more upside, the extended projected high is 1861.43
The SPX continues to make new all time highs. The 60 min extended P2 is now in it's 31st trading hour, the record is 52 trading hours, that could be reached by Dec 31st, the SPX Daily P2 is now in it's 6th trading day, the Daily P2 is projected to extend, it will be in an extended P2, Jan 2nd, on that day an extended SPX Bull high is due. So when does the rubber band break? This market is really getting stretched to the limits.
I have consolidated the SPX Cycle reports at this website.
ID: spxcycles
password: stock
http://northamlindyjr.com/SPXCycles/SPXCycleReports/SpxCycleReportsWebpage.html
The SPX continues to make new record highs. Today the Weekly extended projected high was reached. Also today for the first time, the SPX Monthly EMA 3/8 Bull gap closed above 80 at 80.69, the SPX Monthly MACD is at 125.78 the record is 130.11 (Jun 99), so is the SPX close to a Monthly top? A 60 min P1 is now overdue by 2 trading hours, the 60 min projected low is currently at 1809.2, a SPX Bull market extended high is due Jan 2nd, a Weekly extended high is due Jan 6th, and a Daily extended high is due Jan 9th.
This morning the SPX continues to make all time highs. This afternoon a 60 min P1 is due, tomorrow a 60 min low is projected, the current projected low is 1807.9, the SPX Monthly EMA 3/8 Bull gap is currently above 80, I will be selling my SPXL position. I plan to add a SPXL position during the next 60 min P1
|
Followers
|
26
|
Posters
|
|
|
Posts (Today)
|
0
|
Posts (Total)
|
2930
|
|
Created
|
11/02/10
|
Type
|
Free
|
| Moderators | |||
SPX Cycles has moved to facebook. If you would like to join my facebook group go to www.facebook.com and create an account it's FREE.
Then search for "SPX Cycles" and press the request to join button. We will confirm your request during the next trading day.
Please remember that everything that I say or imply on this board is not meant to be used in any way for trades with real money, you should either consult with your financial professional or do your own research before trading with real money.
Thank you for your interest in SPX Cycles.
| Volume | |
| Day Range: | |
| Bid Price | |
| Ask Price | |
| Last Trade Time: |

