Support: 888-992-3836
Copyright © 2023 InvestorsHub Inc.
Register for free to join our community of investors and share your ideas. You will also get access to streaming quotes, interactive charts, trades, portfolio, live options flow and more tools.
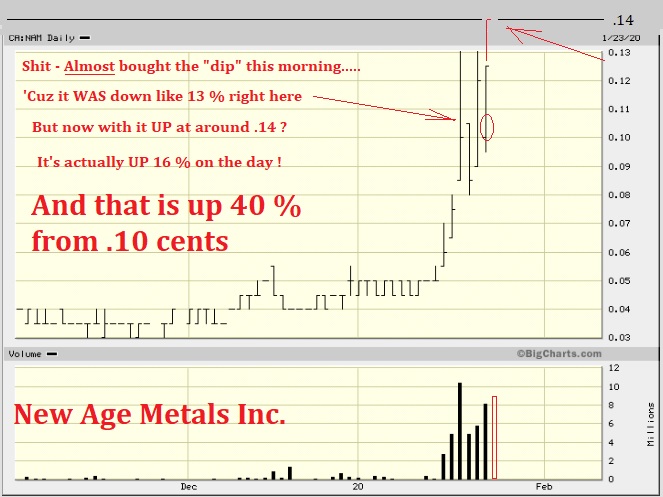
3 charts 25/26 was Sat. Sun.....Today it was down by 16% Hit .145 and is now .105
Now 2 days later - At .24 (following yesterdays' pause) http://bigcharts.marketwatch.com/advchart/frames/frames.asp?show=&insttype=&symb=ca%3Axtm&x=0&y=0&time=100&startdate=10%2F10%2F2019&enddate=1%2F31%2F2020&freq=1&compidx=aaaaa%3A0&comptemptext=&comp=none&ma=0&maval=9&uf=0&lf=1&lf2=0&lf3=0&type=2&style=320&size=3&timeFrameToggle=false&compareToToggle=false&indicatorsToggle=false&chartStyleToggle=false&state=9 Just wasn't sure about yesterday.....(and/or this morning either) But once "a market" makes ITS' mind up - There's not much time to ACT https://ceo.ca/xtm
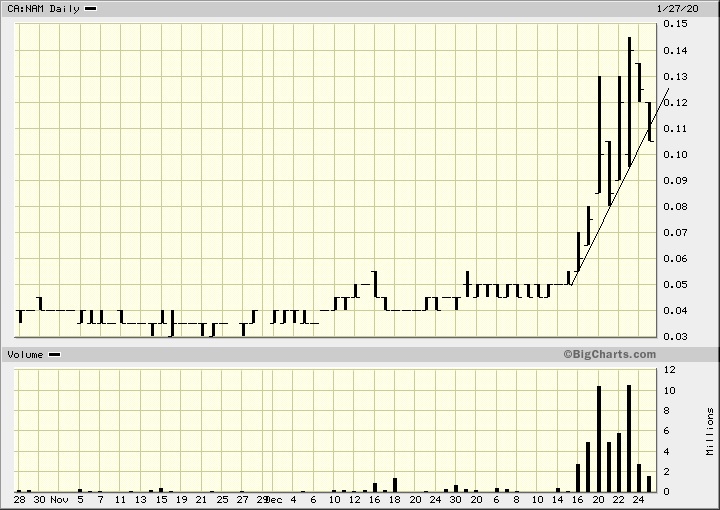
Long term chart
InvestorsHub community
Register for free to join our community of investors and share your ideas
You'll also get access to streaming quotes, interactive charts, trades, portfolio, live options flow
 News
News  Market Data
  Discover