 News
News  Market Data
  Discover
Support: 888-992-3836
Copyright © 2023 InvestorsHub Inc.


Register for free to join our community of investors and share your ideas. You will also get access to streaming quotes, interactive charts, trades, portfolio, live options flow and more tools.
James Turk History Will Repeat Itself, $11000 Gold 2013-2015
future gold price, gold prediction, forecast, outlook -
This stock will go to fiat$10.00 +++++++++++++++++++++++ soon
libor will destroy the khazar super red banksters
http://doreenellenbelldotan.info/AdolfRothschildHitler.htm
666 gangsters feds-cult fiat$ poncy scheme of ussr rubel
gulag evils of copycats -
http://investorshub.advfn.com/boards/read_msg.aspx?message_id=77246998
in a fair 888 market with a level playing field -
Eliot Spitzer - LIBOR Mega scandal (total corruption)
The weekly charts are smokin on these miners
TIV
BRCO
CCE.V
DDN.V
GWG.V
LGO.V
URST
New Gold Growth Company Mining Gold in Ecuador; TTXP.OB is under the radar for now!
Trilliant Exploration's Muluncay region surrounds IAMGold-IAG:NYSE, Dynasty-DMM.TO and Kinross-KGC:NYSE.
Trilliant Exploration Featured in Resource World Magazine!
'Trilliant’s expansion plans include ramping up production from its current 55 tons-per-day production to 130 tons-per-day by mid 2009, and to an estimated 800-1000 tons-per day by the end of 2009.'
Read full feature at : http://www.ttxp.biz/media/trilliant.pdf
Major inflation, Bullish Gold. Discussion with Peter Schiff. Very good to watch.
GXPI, Gemini smallcap in Colombia is about to report its quarterly. The chart is technically strong and there do not appear to be any shorts on it, as they got shaken out by the 25% growth in the last couple of weeks. If the news is good in the report, it could be a springboard to some rapid gains.
Mining Stocks Showing Green Today
LMA.T === Closed @ 1.32 === Building for a move over 1.40
http://www.stockscores.com/quickreport.asp?ticker=t.lma
LRG.V === New Highs on a Daily Basis === 1.88 Close
http://www.stockscores.com/quickreport.asp?ticker=v.lrg
CTG.V === Up 10% Today === Little Producer with Big Upside
http://www.stockscores.com/quickreport.asp?ticker=v.ctg
BMD - down HUGE last 2 days. Buy Oppt?
All based on a price negotiation problem on limestone.
LaMancha Resources (LMA-TSE $1.20) All the above companies have one thing in
common-I personally took a very large equity position in them. Now the same can be said for
LMA. While there’s absolutely no reason for anyone to mortgage their house and/or chase this
stock up, I do want to tell you why I did this for myself.
LMA has been spearheaded by Walter (Wally) Berukoff. Wally’s main business is running
http://www.redlionmgmt.com/ . Red Lion has been active around the world in the real
estate and resource industries. Wally was the founder of both Northern Orion Resources (NNO-TSE $4.66)
and Miramar Mining (MAE-TSE $5.69 ), where he helped raise over $450
million dollars. Both these companies were kick started by having major assets placed in
them. Wally has done this again with LMA recently http://www.lamancharesources.com/ .
Effectively what has taken place is the precious metals assets of a major French subsidiary
were placed into LMA via a RTO and that French company is now the largest stake holder of
LMA. Like anything else, this deal took time and after many months of being halted, the stock
began trading not too long ago. It ran up at first but began to decline on the back of the recent
gold correction. I believe because there has been virtually no promotion, which made the
stock ill-liquid, a seller of size hit a no-bid market and drove the share price under a dollar. I
was buying much higher but was the buyer of a large block last Friday that appears to have
removed whatever that seller had left (as of now).
In the meantime, the company has been undergoing a complete review as it gets its feet wet
as a much, much, bigger concern. It’s an emerging producer with large-scale exploration
potential. The bottomline is this, I think Wally’s past involvement with MAE and NNO, plus
the French Connection, is likely to become a very promoted story in 2007. It fits a need
serious individual investors and institutions look for
production, while offering blue-sky exploration as well. I believe Wally can get in doors other
companies can’t because of who he is and what he has done in the past. Chances are a substantially
higher valuation can be put on it than is currently being afforded it. This is why I’ve have been so
aggressive. Also, because it already has producing mines, a higher gold price should be beneficial
to the share price. The company has over $40 million in cash, no debt and 99.99999999999999% of
mining share speculators haven’t even heard of it-YET!
Listen especially to part two of this radio interview of Wally
http://www.lamancharesources.com/media/
WLV - blood in the streets - down 43% -
Just added at $1.61 - Easy Money ?
Here we go. The long over due pull pack and completion of this correction.
my father will soon be traveling to asia to meet with suppliers for his company. He needs to bargain with them and show that they are overcharging him for the price of items containing aluminum and copper. I was hoping anyone on this board would be able to direct me to some sort of chart, or website, showing the trends and current price/demand of copper and aluminum worldwide.
once again, copper and aluminum. any help is appreciated, thnx guys
Rule #8 "Rules For Fools" Whenever hope becomes a chief factor in determining a market position sell out quickly.
Case Studies in Corrections:
· Rather than falling fast and all at once, they grind gradually over time.
· Sharp falls are followed by promising rallies.
· A few weeks later, the promising rally collapses to a newer low and losses are even greater.
· Hope is smashed on the rocks over and over again.
I posted for years and years on the EK board telling them that camera film was dead. I took a lot of flack, board scum refused to admit it. EK stock refused to go down. Finally it did and practically everyone admits digital camera have all but replaced film.
With film dead, that has to relieve some silver consumption.
Not sure about the other metals.
Fishpert once expansion of industry in developing nations stabilizes, continues, or accelerates, short term rate requirements aren't as effective in tighting supply with excess liquidity. I can't see demand ever decreasing unless an armageddon occurred, but in a few decades time, the prosperity in the economy will fluctuate.
New sources of minerals will always continue to be found, as long as someone can find them somewhere in or on the planet.
instead of finding supply, demand could be stiffled. Rising interest rates soak up liquidity. Japan just raised rates.
Fishpert, that's ok short term stuff. I look to years ahead and see the demand equation bringing prices to historical highs again and beyond. Non-renewable resources do not follow a quirky price pattern, but reflect demand most strongly, except perhaps in gold and silver. If metals prices fell back to recent support levels that's ok, it will still be almost double or more of 5 years ago. The prices should never return there, unless a new, giant source of Copper, aluminum, moly, gold, silver, ect. is found. Not likely. Some word is the ocean may be a source of gold, but not economic yet. Word is there are giant reserves of metals on the ocean floor, or deep within unexplored mountains and dry rivers, not feasible or found yet. Some extra reserves are recovered from prior mines that were worked out, because new technology allows more recovery from ore, where they could not before. Check out Anglogold, and Durban Deep, and some others, who are using this new recovery technology on old mines and discarded ore. The Economists can determine the equation, but I know consumption is not decreasing, at least for the long-term. Good-luck in the short term trade.
Fish is back. Looks like PM's are going down.
http://tinyurl.com/poswo
DKGR is in GOLD, DIAMONDS and OIL...this company is a true Trifecta....You gotta love this company's aggressiveness.
KEY METAL MARKETS NEED TO CONTINUE CORRECTING.
June 9th Richard Russell, well respected newsletter writer wrote “Matter of moths before Gold can establish a real bottom.
Major corrections function is to wipe out exuberant sentiment : 2 dimensions depth and duration.
Current corrections in gold and silver deep and painful, but they remain young. Only 18 weeks in duration, average corrections lasts 88 days.
Since last up legs were so enormous we need to expect a major correction to restore balance.
Next HUI interim bottom will probably not be the 200 dma since this was dragged higher in a surge. (usually hits at 80% of 200 dma).
gold close to 200 dma..predict it will go below in next 3 weeks...then it's time to go all in....
PAAS is already below 200 dma...good buy now????
I am long AGC.V- drilling in Brazil at the moment-
Website is www.amarillogold.com-
730,000 ounces of gold estimated from a previous property owner-
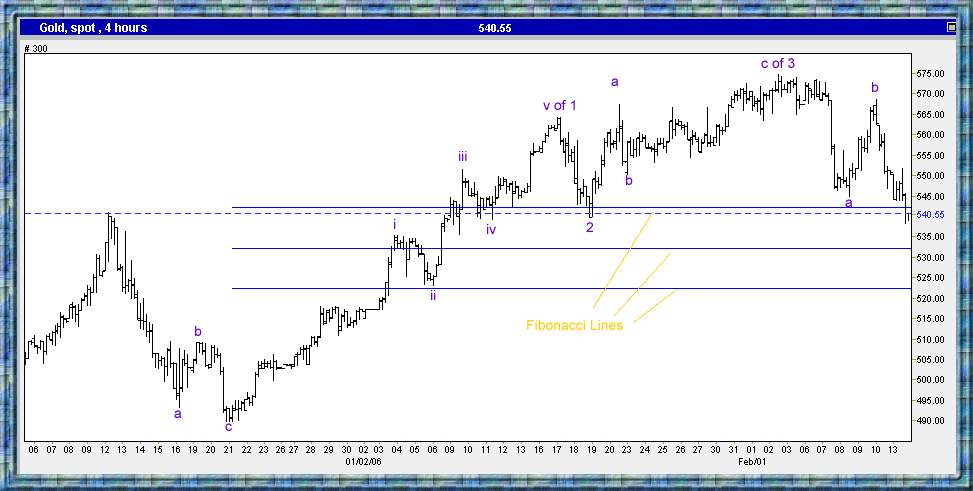
Gold Intraday chart
Gold and silver headed lower today below last week lows, gold is already about 35$ below it recent top currently trading around the 2005 high level. This pullback might have another leg down but I wouldn’t bet on it. I continue to see excellent risk reward opportunity in buying gold and silver , the higher risk is on the short side of this market and the appreciation potential is much higher then the total price of gold or silver. Physical buyers, long term buyers and those holding short positions should take advantage of the market weakness and accumulate; short term traders could probably wait a bit longer for a bottom confirmation. I have annotated a four hour gold spot chart with Fibonacci levels and Elliot wave count.
daily update here:
http://globalgold.blogspot.com/
Surely you jest. But then I am admittedly biased against the dart board E-wave TA seen on this board.
Hi, I'm over at www.smartinvestment.ca Hit discussion. Coach's corner. Glad you liked my posts. I was double posting here and there. Got to be a bit too much.
D Square where are you? Miss your astute posts!
Thanks for the alert of your new board. Looks good.
Goldbugs board started:
http://www.investorshub.com/boards/board.asp?board_id=3386
Quasimodos, Gold Sector Update:
http://www.quasimodos.com/cgi-bin/index.cgi?Action=Story&Command=525
Gold ETF Continues to Flex Muscles
by T. Stein / S. McIntyre
http://www.safehaven.com/article-2490.htm
My, how things change. It was only several weeks ago that the yellow metal was hovering above the $450 mark, and pundits were cheering the launch of the gold exchange traded fund (GLD). Finally, there would be a way for the average Joe to purchase gold using his E*Trade account instead of having to meander to the local coin shop and then to his safe deposit box. Everything seemed to be pointed towards the sky and suddenly, the air was let out of the balloon. A contentious debate about GLD's viability ensued as gold bugs complained about the fund's custodians' lack of transparency regarding physical gold backing. Meanwhile, the price of physical gold and the gold mining shares plummeted into a sea of pervasive pessimism.
In its first three days of trading, GLD traded roughly 30 million shares...and nearly all of that had been incremental demand (new buyers) according to the press. After a few weeks, however, the volume dropped off and there hasn't been a peep since about GLD from the press or the gold community. Obviously, the drop in the price of gold has muted the public's interest in GLD and the mining shares - this is why we are so keyed up.
If you take a look at the streetTRACKS web site, there is a real time account of the amount of gold sitting in GLD's vault. Despite the drop in gold's price, the amount of GLD's ounces has been rising steadily over the last month, which shows that someone is quietly accumulating gold through the ETF.
Is it a fund liquidating gold mining stocks in an effort to diversify into physical? Perhaps. But we tend to think that word is getting out to individual investors that the U.S. Dollar's long-term prospects are grim to say the least. Heck, even Warren Buffett was on CNBC the other day saying that he is still very bearish on the greenback. Buffett has about $40 billion reasons to think he might be right long-term on the Dollar's downward direction and we don't think this fact is lost upon individual investors.
Foreign currencies are decent ways to play the Dollar's decline, but they have limitations in both the ease of availability to individuals and the fact they are hampered by clueless central bankers much like in the U.S. Gold and silver remain the only currencies not controlled by inept governments. Sure, the central banks could sell some more gold if they desire, but it will be a drop in the bucket if widespread gold investment demand picks up as we think it will. The quiet accumulation of GLD ounces is yet another early indicator that this gold bull market and dollar correction has just begun.
Todd Stein & Steven McIntyre
Texas Hedge Report
Today's Pfennig!
Here We Go Again With Chinese Rumors!
Good day.... Well, yesterday's CPI data for December did confirm that inflation exists in our economy, to the tune of 3.3% more than the previous year! Of course, in my mind, inflation really stands around 5%, but let's not let that get in the way of the Government's announcement yesterday. So... Inflation is around us, and it's not just oil prices! But we can all sleep soundly at night knowing that our Fed Reserve has everything under control, and all will be right on the night. GET OUT OF HERE! My fingers didn't even want to type that last bit about the Fed.... LOL!
Immediately after the CPI data was announced, the dollar saw a reversal of fortune, and the euro shot up to 1.3120. Then the trap door sprung, and the single unit couldn't find a bid until it reached the 1.2970 level. I'm told that Japanese names came in an bought everything dollar related they could get their hands on. So, it's not only the Japanese Gov. that wants to keep yen from getting stronger, it's Japanese exporters too! OK, now you're wondering how I went from the euro/ dollar pair to the yen/ dollar pair and wound it all together... Of course those of you that have held their attention in class know that it's all tied together by the "cross trades" that exist in the currency markets. There are so many of them, that yen selling and dollar buying creates dollar strength that is then carried over to euro / dollar trades. Sort of like the old song about the thigh bone being connected to the knee bone, and so on.
Of course, I've tried to tell anyone in Japan that would listen that they have nothing to fear from a stronger currency, the proof is in the pudding! Look at yen's rise VS the dollar last year, and if you buy into the thought that the stronger currency is hurting their exports, then you would be broke, because Japan's Trade Surplus grew last year. And if you buy into the fact that Japan needs a weaker currency to attract investment flow, you would once again be asking your mother for a $20 to buy a Big Mac, because Net Equity Inflows to Japan have increased the last two month (.7 Trillion yen). This Net Equity Inflow data has remained positive since the 2nd QTR of 2003, except for a brief and modest outflow in May last year.
So... Will everyone in Japan please calm down? Your currency is going to get stronger and besides those little games you played yesterday, there's not a whole heck of a lot you can do about it. Besides, you should have been more influential with China and the talks to revalue.
Speaking of a Chinese revaluation, I hear this rumor yesterday, so take it with as many grains of salt that you wish but here it is... China could revalue its renminbi currency by as much as five percent against the dollar any time after the Chinese New Year in mid-February, according to a report by New York-based consultants Medley Global Advisors. Medley sent the report to clients on January 19. A source, reading from the report, told Reuters it said: "At this moment our information continues to be that Beijing is looking at a de facto one off revaluation of around five percent. It is also clear to us based on our conversation over this past weekend that while no specific time-table has been set out for the revaluation the move can come literally at any time after the Chinese New Year."
So, there you go! I'm going to probe further here, and say that I think I smell smoke because it just so happens that yesterday we saw news from Malaysia... This is very interesting...
Former prime minister Mahathir Mohamad, who fixed Malaysia's exchange rate in 1988, on Wednesday called for a review of the peg as the weak dollar has caused the ringgit to depreciate against other major currencies. "I feel the time has come for us to review because we have lost a lot as the value of our currency has fallen," Mahathir was quoted by the official Bernama news agency as telling reporters."
Hmmm, you don't think China called Malaysia and have them a heads up do you? I smell smoke here... And you know me... "Mr. Conspiracy" Where there's smoke... There's fire!
Back to reality here... Well, traders and speculators had tried to move the euro to the downside of the 1.30 level for a couple of weeks now, with no success, until yesterday. It's really not a fundamental thing that's driving this market right now, in fact, I'm not really sure who is at the wheel, but I do know one thing, the euro might even fall further, but it does not change the weak dollar trend, or my call for euro 1.40 this year one iota! Just like above, where the "crosses" pushed euro down because yen got sold, the euro will see the other side of that coin when yen gets back on the bus that takes it to below the 95 figure! Be careful, don't get caught in this "trap" of thinking the dollar is out of the woods...
You don't have to listen to just little ol' me on that point (yeah, little Chuck is like saying Texas is a "small state"!) Warren Buffett has this to say about the dollar yesterday on CNBC... Berkshire Hathaway Inc, Chairman Warren Buffett said he expects the U.S. dollar to continue to decline and is having a "hard time" finding stocks to buy. "Unless we have a major change in trade policies, I don't see how the dollar avoids going down. I don't know when it happen, I don't have any idea if it's going to be this month, next month or next year."
Well, my two-cents says it will be this year and next year!
Before I head to the big finish, I want to make this note to my Euro-based readers... Sterling may be down VS The dollar these days, but it is holding near a one-month high VS the euro on rate speculation. As I told you before, the U.K. enjoys a nice rate differential to the euro, and should outperform the euro going forward. This is for "euro based" customers.
Currencies today: A$ .7585, kiwi .7020, C$ .8120, euro 1.2950, sterling 1.87, Swiss .8390, rand 6.115, krone 6.33, forint 191.10, zloty 3.185, koruna 23.49, yen 102.85, baht 38.50, sing 1.634, pesos 11.24, and gold... $421.40
That's it for today... I don't get a good feeling toward euro pricing today, I think when U.S. traders come in and see it held below 1.30 overnight, they will sell it further... So just batten down the hatches! Things have not slowed down on our currency desk, long days indeed! But we carry on! Speaking of which, I've got to get to work! Have a great Thursday!
Chuck Butler
President
EverBank World Markets
I never get the twenty bucks:
Richard Daughty
...the angriest guy in economics
The Mogambo Guru
Archives
January 20, 2005
- Marshall Auerback, one of the big dogs at the PrudentBear.com website, handily explodes the conceited stupidity that The Mogambo knows what he is talking about when, oops! Sorry! On re-reading the piece, he did NOT expose The Mogambo for the pretentious little twerp that he really is. What Mr. Auerback REALLY did is to explode the overarching stupidity that constantly lowering interest rates will always produce economic growth. This is important because this idiotic idea is the bedrock from which all of modern central bank theory springs. He writes, "It is generally assumed that increases in credit stimulate aggregate demand. In the short run that is always true. But in the long run it need not be true. The expansion of credit is an increase in debt. When debt levels are low, a credit expansion which increases debt does not leave a legacy which later suffocates demand, since the resulting still low level of debt is not yet a problem. But when debt levels are very high, the increases in debt created by credit expansion soon act as a burden on demand. It follows from the above that, as the level of debt relative to income rises, it should take larger expansions of credit to achieve any given percentage increase in demand, since the now high, and climbing, debt burden acts as a countervailing force to depress demand." As is proved by stopping by my house on almost any day, as I try and explain to my wife that what we really NEED around here is another mortar emplacement down at the end of the backyard, and she explains that we owe so much on the OTHER mortar emplacements that we simply can't afford another one.
But as long as the credit keeps expanding, which you can measure by total debt, then that means that people are still borrowing and spending money, and as it winds through the system there will be money flowing into everything, and that includes the stock market and the bond market and the housing market. So far so good.
In a related note, Total Fed Credit, which is the ultimate measure of "money out of thin air," went down by a whopping, and surprising, $11 billion last week. I am not sure what this means, but it is unusual, after all these years and years of the damnable Federal Reserve creating more and more money and credit, day and night. But if it continues long enough, then the money supply will start contracting. And while I am again not sure exactly what THAT means, either, the steel-trap mind of The Mogambo (STMOTM) notices that there are no economic theories that start out with "To get economic growth, first you need a shrinking money supply." Hahahaha!
That new lack of borrowing is why the chance of Congress authorizing the use of Social Security contributions to be invested in private accounts is almost sure to pass. And if it does NOT pass, then I will have this really surprised look on my face and people will say "Is something wrong with The Mogambo? I mean, look at his face!" and somebody else will say "Yes, by golly! It DOES look like something is ailing him. I wonder what we can do to help him?" and I tell them that giving me twenty bucks would go a long way towards making me feel better. But then they just stare at me and get all huffy and make some rude comment, and I never get the twenty bucks, which shows you just how deep their compassion runs, the little bastards.
But the subject was not my problems with things surprising me, and how I never get the twenty bucks, dammit. No, the subject was that if you really want to see the beginning of the Great Bear Market Which Signaled The End Of The World, then pay attention to how much debt is being created, because if credit is going up, then that means, as I never seem to tire of saying, that people are borrowing and spending. But when it starts going down, then people are not spending, and economic and financial things will start going down, too.
In the meantime, perhaps we can take some solace from Bob Wood of Kaizen Managed Assets, who explained to me over lunch that everyone apparently believes that the whole "economics thing" is apparently of divine origin, and is so complex that our puny human minds cannot comprehend it, and so economics must be taken on faith, particularly faith in the Federal Reserve. It is, we decided, sort of an Intelligent-Design, Neo-Keynesian, Supply-Side Economics, and thus we expect that all books of economics will, in the future, have affixed to their covers a sticker that reads "Intelligent-Design Neo-Keynesian Supply-Side Economics is a fact, and not a theory" thus effectively proving it.
- There is a plan afoot to let American corporations who have substantial assets sitting in foreign countries bring the money "home to America" by allowing them to repatriate those monies by paying a special, one-time, ultra-low tax rate. This is supposed to be some wonderful news. But it will not be such hot news for those countries that are currently harboring those monies when they see it flow out of their countries, and out of their assets, and out of their markets, and out of the control of their governments.
- As a little change of pace, let's take a little trip to Technical Analysis Country, and visit Chris DeHaemer, courtesy of the DailyReckoning.com site. Suppose that you want to make a little short-term money by predicting market action. How do you do that? Easy! As Mr. DeHaemer explains, look at volatility, as revealed by the VIX. "Simply put, when volatility spikes during bearish action, buy. That flood of panicked sellers is a contrarian indication that the market has bottomed. When volatility continues to drop during a time of high bullish action, sell." See? Nothing to it!
- Edmund M. McCarthy, the President and CEO of Financial Risk Management Advisors Company, is one of those guys who goes around looking at things in financial reports, while The Mogambo goes around peeking through the windows of Madame Lulu's Cavalcade of Girls, Girls, Girls, and he writes "Looking at a 10Q of a quite revered bank recently, we saw an 100% expansion in that footnote to credit quality entitled 'Over 90 days past due but not non-performing.' The dollar amount would be significant to most analyses. There was no further explanation. We will be paying particular attention to this area going forward as it was an early warning sign in previous cyclical changes."
Part of the problem may be explained by Rosalind Wells, who is the chief economist for the National Retail Federation, who notes that consumer spending appears to be dropping precipitously. Ms. Wells says, in an article in my local paper, the St. Petersburg Times, entitled "Stores Facing Closed Wallets," that "Consumer spending is about to downshift. This may be a tough year because the consumer may be tapped out." While not forecasting the imminent destruction of the globe and flesh-eating zombies rising from the grave, like the stupid Mogambo who is always either in a panic or close to one, she says that consumer spending will probably settle down to a 3.5% gain this year, down from 6.7% in 2004. I love this next part in the article: "Virtually all of the gain would be consumed by inflation. Her downbeat assessment brought general agreement from other experts and industry leaders" at some convention that they were all attending, a convention to which The Mogambo was not invited, probably due to a mere oversight or as part of a coordinated plan to destroy me, I'm not sure which, but I'll bet you know what I suspect.
Now this 6.7% increase in retail sales for 2004 is very interesting to me, because according to the AFP, consumers spent a hell of a lot of money last year. "Total sales of 4.06 trillion dollars in 2004 were up 8.0 percent from 2003, the biggest annual increase since 1999," they say. This is the first time in history that the consumers of one country spent more than four trillion dollars in one freaking year, roughly 12% of the GDP of the entire world.
And all of THAT may help explain why Consumer Installment Credit contracted by $9 billion in November, which was a big surprise to everyone, including The Mogambo, who is usually only surprise that armed and armored agents of the government haven't hauled me off by this time, hopefully to give me the therapy I so desperately need.
- According to XFN, "China is beginning to have an impact on US technology industries formerly thought to have been insulated from low-wage overseas competition, according to a report prepared by a US Congress-mandated commission. China's exports of electronics, computers, and communications equipmentare growing much faster than its exports of low-value, labor-intensive items." Hey! I know what you are thinking! This isn't fair! As I understood it, the deal was that those Chinese guys would remain content with their peasant status, work like slaves for pennies a day in horrible working conditions, and then we Americans, for our part, would sit around in our air-conditioned offices, waiting until the boss isn't looking, then go online to go shopping to buy those cheap Chinese products, and download entertaining pornography to pass the time while we wait for delivery! And use money borrowed from the Chinese to pay for it all! Isn't that the way you understood the arrangement? Me, too! This proves that you can't trust the damned Chinese!
Chinese economic growth has been averaging 9.7% a year from 1990 to 2003. Partly as a result, the People's Bank of China said that China's foreign exchange reserves rose 51% last year to $610 billion, a new record. (But as John Mauldin reports, suddenly, the overwhelming bulk of that increase in reserves was NOT in dollars!) And China's M2 money supply growth expanded 14.6 percent from a year earlier. M2 in China is now up to 25.3 trillion yuan, which apparently works out to $3.06 trillion, which is, for comparison, roughly equal to half of our M2 money supply. So, like the budding little capitalist swine that they are, and we are, and we all are, the nefarious Chinese now want to invest in producing high-value items, taking the bread out of our mouths! As one of the bright dudes at the Daily Reckoning website notes, also looking at the trade deficit, "Over the last 12 months, exports of 'high tech products' actually FELL 21%." How much longer before they start producing some nuclear weapons, like us? And then they can strut around the world, randomly kicking butt, like us! And won't that be nice?
But life is not all eggs rolls and Geisha girls who are all giggly and happy until they find out I have no money, and the inflationary impact of such unrestrained money/ credit/ production excesses is showing up as higher and higher consumer prices, which is why the Chinese are trying to cool off their economy, even though the official Chinese consumer price inflation is only 2.8%. On the other hand, America's official inflation rate is higher at 3.5%, and instead of trying to cool the economy in the face of such high inflation, the Bush idiots are trying to stoke inflation even higher! And then people wonder why The Mogambo has locked himself in the Mogambo Fortress Of Solitude (MFOS) and is writing terse, incomprehensible letters to George W. Bush (e.g. "Dear Butthead President: Arrrggghhhh! Signed, Angry in Florida (AIF)").
And speaking of China, one of the most Profound Moments In History According To The Mogambo (PMIHATTM) is that Mises.org reports that the Taiwanese have published, in Chinese, a reprint of Murray Rothbard's famous book "What Has Government Done to Our Money?" This miraculous little book (62 pages), which is actually more of a booklet, contains all you need to know about money, credit and economies, and the disastrous results of fiat currencies, fractional banking, government deficits and all the rest of the stuff that keeps The Mogambo screaming long into the night until the police come and make me shut the hell up by putting handcuffs on my wrists and tape over my mouth, which tastes like crap, in case you were wondering, and then the rest of the night all I can muster is muffled cries of rage ("Mmmffhhh mmmummfffmmmm!").
And now that the book is translated into Chinese, that singular effort will doom us if they take it to heart and base their money on gold. Our only hope is that the politicians of China are as corrupt and stupid as our own, and opt to go with a profligate central bank creating and un-backed paper currency in a banking system rife with fractional banking excesses, too.
- Let's not count the Russians out! Agent 007 ("The name is Bond. James Bond") has had his share of run-ins with those guys, now their central bank reports that their foreign currency and gold reserves rose to a record of $124.6 billion. Note that they are including gold in their report, which we do not, and they are accumulating gold, which we do not, either, mostly because our government and central bank figure that Americans are too stupid to know the significance of that. The only good news is that Rothbard's book has not been translated into Russian, as far as I know, although the fact that they are accumulating gold shows that it probably has. Now we have the Russians AND the Chinese to worry about! Fabulous. Just freaking fabulous.
People often ask, "Mogambo, how come you never amounted to anything and are, according to recent data, actually a big failure in everything?" Well, to be fair, they usually only ask me that question one time, and then forever after they carry bad memories and/or actual scars to remind them not to ask me THAT damn question again!
But they are wrong when they say I have failed at everything, because you can ask anybody who works at the supermarket about monetary policy and they ALL know all about how the dollar is being destroyed by the Federal Reserve, and how they are literally creating this tsunami of credit and money, which is going to rise up destroy our money by lowering its buying power to, rounding off to three decimal places, squat. And if you have never actually tried to exist on money that has buying power that registers in the "squat" range, then gather up some attractive pebbles from the roadside and try and use those "pretty rocks" as money when you go to the store. If you try that silly crap around here, as soon as you use the phrase "pretty rocks" the manager will probably run off, tearing out his hair and screaming, "Noooooo!! Not the damned Mogambo and his damned 'pretty rocks' and his damned loud monetary policy lectures! Death, where is thy sting?"
But Hans Sennholz takes the calm, philosophical approach, as he demonstrates with his essay "The Dollar's Questionable Future." He writes, "If the love of money is the root of all evil, the depreciation of money must be the mainspring of all shams and frauds. It works silently and covertly, impoverishes many while it enriches a few, and thereby inflicts great harm on social cooperation and international relations."
And what do you get when you, as he says, inflict "great harm on social cooperation and international relations"? You get strikes and riots, something like the recent outbreak in Moscow when they tried to trim a little off their bankrupting welfare payments, and countries like the USA operating as terrorist nations that routinely invade other countries and kills whole swaths of people. Oops! But then again, nobody ever said that the downside of a fiat currency was pretty.
- The U.S. trade deficit reached $60.3 billion in November. Peter Schiff, of Euro Pacific Capital, makes the telling statement that "The reality is that a falling dollar, by itself, only exacerbates the trade deficit, by increasing the cost of imports." How much, you ask? Before I could shrug my shoulders and admit I had no idea because I am just a big, brainless idiot with a big, fat mouth, Mr. Schiff saves me from that embarrassment by interrupting to say, "Including energy, import prices rose 6.9% for the year." And yet I cannot pick up a newspaper or listen to some clueless market tout on TV telling me how there is no inflation in prices! Hahahahaha!
And it gets worse than that, because if the dollar continues falling in value, then imports will continue to go up in price! Bummer!
And don't be mollified by the teensy-weensy. 0.7% drop in producer prices last month. The index still posted a 4.1% gain on the year. And why do producer prices matter? Because there is a lag between higher wholesale prices and rising consumer prices down the road, since somebody has to eventually pay the higher producer prices. And if you are at all familiar with how business actually works, let me tell you. Somebody owns a company, and they hire a manager to run it so that the owners can make a profit without actually working. The profit comes between the cost of inputs (producer prices) and the price they get for selling the firm's output (goods and services). And when that profit goes down because producer prices are up and the manager did not find a way to increase prices, then the owners come into the manager's office and the next thing you know (insert video footage of Donald Trump looking into the camera and saying "You're fired!") two beefy guys from Security have me under the arms and I am being hustled towards the door and tossed into the cold street, and all the pretty secretaries are looking out the window at me, including the adorable Teresa, with whom I had thought we had shared the bond that unites two tortured souls, but who is also standing there yelling "Get lost, ya big weirdo! " and laughing at me, which is a sting that really hurts the most.
Continuing on, Ron Peebles of the PrudentBear.com site writes that The Mogambo is right on the money (although he doesn't actually mention me by name, but he did crinkle up his nose as if he had smelled something bad, which is practically the same thing) about this inflation thing when he says, "For the record, prices for intermediate goods, excluding food and energy, were up 8.3% in 2004, with crude goods soaring 20.1%."
Then he went on to talk about other, more prosaic things, such as housing prices. Chugging another shot of cheap tequila to help us forget for a moment that we are buying each other's houses for what is elsewhere known as "a king's ransom," he says, "Oh sure, having your house increase in value is a great thing if you're planning to sell in California to buy in North Dakota. But if you're going to stick around long enough to get some use of those granite countertops, the penalty for such pleasure is higher property taxes. According to CNN, state and local property tax collections in Q4 spiked 9% year-over-year." So high-priced houses mean high-priced taxes. It just doesn't get worse than that!
- Alfred Tella of the Washington Times has taken a look a the Fed minutes and notes that "Some members worried that low interest rates 'might be contributing to excessive risk-taking in financial markets.' " No kidding! Hahahaha! That is the whole point of it, isn't it? Everybody is running around taking on more risk to hopefully (please please please!) get higher returns, right? And now that the Fed is provably intent, in their desperation, on permanently lowering the cost of borrowed money to less than the rate of inflation, they figure that people are NOT going to be taking on more risk? I was right; the Federal Reserve IS a bunch of idiots!
- Richard Russell, of the Dow Letter, wryly notes that the idea (Mogambo says "Not just an idea, but a Really, Really Stupid (RRSI) idea!") underlying the Bush scheme of putting part of your Social Security money in stocks is that they figure that "the long-term rise in stocks will make up for any possible inflation, and SS would then be a boon instead of a boondoggle." Hahahaha! This proves that Bush is an idiot, because if he was NOT an idiot, then he would have died on the spot for saying something so ridiculous! For one thing, we are not having, nor are we going to have, "possible inflation." It is beyond "possible." Price inflation, and ruinous inflation at that, is a dead-bang certainty. And if you care to examine the evidence, financial assets do not usually prosper for long when inflation is roaring.
To further bury that idea, Mr. Russell reports that Stanley Hogue, a defense industry analyst and MIT graduate, put money into SS over his 45 year career, and then decided to go back and check his own records to answer the burning question "Would he have done better investing his money than the bureaucrats at SS?" Mr. Russell notes his method: "He recorded all the payroll taxes, tracked down the return the SS Trust Fund earned for each of the 45 years, and then compared result with what he would have received had been able to invest the same amount of payroll tax money over the same period of time in the D-J Industrials (including dividends)." So what was the result? "To his surprise, the SS investment won out: $261,372 vs. $255,499, a difference in favor of SS of $5873." He didn't mention the tax bite, I notice, but perhaps it was implied.
And this all assumes that private pensions will always be a good deal. Not so! For example, Paul Krugman comments on an article in the magazine American Prospect, which illustrates the dismal failure of the British experiment in privatizing pensions. Britain's Pensions Commission warns that at least 75 percent, which is a big chunk of the population, of those with private investment accounts will not have enough savings to provide "adequate pensions." Of course, those are just the stupid British, who can't be very smart, or else Tony Blair would not be Prime Minister.
- The LeMetropoleCafe.com site attempts to answer the perennial question, "What in the hell is going on in the gold market?" They reply "The motives of The gold Cartel are as plain as day: The gold Cartel and US financial market power structure know the dollar must fall. However, they are concerned a dollar rout could cause some sort of financial market instability or panic. To prevent such an occurrence, they are following Paul Volker's insight and what he had to say regarding the rise in the gold price in 1980: '...Joint intervention in gold sales to prevent a steep rise in the price of gold, however, was not undertaken. That was a mistake.' "
Note that Mr. Volker was only referring to a STEEP rise in price, which took gold to $850 the ounce. Regardless of what the gold Cartel and Mr. Volker want, the price of gold will rise, thanks to the dollar's problems.
- Warren Pollock, of The Macroeconomic Newsletter, is as pessimistic as I when he writes, "We are right on top of multiple inflection points. Will it be a dollar rout with a rising stock market, or a dollar rise with a stock market crash? My answer to this question is that we will experience both! We are going to have a declining-grinding stock market and a stealthy devaluation of the dollar." Ugh.
**** The Mogambo Sez: To start the new year, I am responding to all those who have written and complained that the MoGu is too long, and by the simple expedient of shortening it. You got what you wanted. You are welcome. Now send me twenty bucks, you cheap bastards, because that is what I want. It's a win-win situation!
Jan 18, 2005
Richard Daughty
GOLD ... ON HOLD?
Is the $60.3 billion November trade deficit now "paid for" as recent foreign capital-inflow numbers ($81 billion) suggest? Is the dollar's bear market over? Are we in a gold-holding pattern again?
The Dollar: Turning on a Dime
Without any change in fundamentals or even news about exchange rates the dollar turned on a dime as soon as the new year hit. On Friday, December 31, the dollar still fell to an all time low of 1.36 to the euro. On Monday, January 3, the rebound started without any advance notice whatsoever.
What caused that?
Manipulation? Investor psychology? A technical rebound? An "oversold condition"? Which is it?
Forex news reports cited all of the above in one instance or another, but what was the real reason? Are there any "real reasons" for anything anymore in financial-land?
We got a sudden repeat performance of the 2003 dollar collapse during September last year without any fundamental change in financial news or economic outlook from the earlier month dollar rebound and gold stagnation period. Now we get a sudden change back to the dollar-upside without any fundamental change in outlook. Fed rates had been rising and had been expected to rise further throughout the September-December dollar collapse, but as soon as New Years Eve revelers had slept off their hangovers, the dollar began to climb again.
Where are these things coming from? What is happening?
Who cares anymore? There's only one thing that seems to be certain: when the dollar is falling, the Dow goes up. When the dollar stabilizes, the Dow stagnates. When the dollar rises, the Dow falls.
Such has been the case since September 2003 with mind-boggling accuracy - and such is still the case now. The dollar-Dow inversion is alive and well, and is best depicted by looking at a chart showing the Dow and the dollar's main "foe": the euro:

Why does this happen?
The ordinary thinking goes that a low dollar is good for US exporting companies because their products become less expensive abroad. But the effects of this usually lag by at least a matter of months, if not an entire year or longer. So, how come there is this uncanny, almost instantaneous inverse relationship? What accounts for that?
There are no textbooks on this subject. You will find nothing online or in your local library. Ask your College economics professor, and he will be stumped for an answer. So, what's up?
Since September 2003, it almost appears as if the dollar now has the same adverse relationship to the Dow as it has to gold itself. Why is that so? What changed from before 9/03?
If so, what does that say about the current stock rebound? Is it just a reflection of the falling dollar, and no more? If this is so, then investors in US stocks should take note: if they are still skeptical of gold because the current gold-bull is "just the shadow of the falling dollar", then their cherished Dow Jones average has recently fared no better.
Here is another thought: what does that say about the confidence foreign investors have in US stocks? If they only buy them when the cheaper dollar makes them more affordable, then a stronger dollar becomes an economic no-no for US policy makers. If this is the perception of US markets, the US cannot afford a strong dollar policy any longer, any comments from the administration through it's snowy mouthpiece notwithstanding.
If this is true, then the situation we face also instructs us that the dollar has become adverse to even the confounded, rigged, and artificial representation of economic value we all call "the US stock markets." In short: the dollar is now absolutely value-adverse. An increase in the price of anything that has any kind of value to Americans now has to be purchased at the expense of a falling dollar!
The evidence appears striking. There seem to be no two ways about it. It's not so much that a strong dollar is bad for US assets, as it is that only a weak dollar can induce foreign investment in US or dollar-denominated assets anymore.
Or, seen the other way around: if higher prices for US assets can only be bought at the expense of a lower dollar, then we simply have a wash. We are treading water. We are going nowhere. The only thing we have is an illusion of an increase in the value of US assets tailor made for the domestic US population.
At least one thing still remains of the old pillars of economic reality: There is at least that one perception of "value" left in investors' minds. At least they still do buy US assets (or dollar-denominated assets) when the dollar tanks. If and when that ever stops, if and when the international estimation of the value of US assets sinks so low that they won't even consider buying them when they are cheap, that is going to be the day when US economic supremacy is simply over.
How does all of this jibe with today's report of the huge November rise in net foreign investment?
It jibes perfectly.
Even if the figures are correct and not skewed at all, the dollar-Dow scenario explains perfectly why foreign investment has increased so much. Look how the Dow shot up after the election. Look how the dollar dived during the same time. If foreigners are simply scavenging for cheap US assets, then this points to one sad but undeniable truth: they will only continue to do so when the dollar is falling, making US assets cheaper for them.
At this point, it's time to make a prediction: If this explanation is correct, then the December TIC figures to be released in February should show a far lower net increase in foreign capital inflows. And if the dollar keeps climbing during January and boasts a significant increase at the end of the month, then we should see a reversal of net inflows during January when those figures are released in March.
Now, if this scenario holds true, then how far can the dollar rise?
Better question: how far can the dollar-faction afford to let the Dow to fall (as a result of the rising dollar) before foreigners will jump off the train and look elsewhere for bargains? A rebounding dollar will act like insect-repellant for foreign investors. They simply won't go anywhere near US assets if a rising dollar makes these assets ‘smell bad' (more expensive) to them.
And that means that the trade deficit will continue to loom large on the investment horizon, no matter what these (now no longer so surprising) capital inflow figures showed in November. Only a seriously falling dollar can attract enough foreign investment to "pay" for the US trade deficit. That means a rising dollar will simply crush the US equities markets.
There is another possible explanation for this upward explosion in foreign asset inflows:
I have seen people talking about covert US Fed buying of longer term treasuries to keep long rates manageable so that consumers won't get scared out of their pants by the two-prong pinchers of rising US prices and the rising cost of debt-repayments. Some astute analysts have observed that there is a lot of activity in the bond market coming out of the Caribbean money centers. These same traders have observed that an unidentified but huge entity acting through the Caribbean money centers keeps coming in to buy treasuries as soon as a sell-off begins to develop. Could that be the Fed?
Is it possible that the Fed is making good on Bernanke's threat and is buying long term treasuries? Are those the "foreign investment inflows" we have been told about today so boisterously? Here is a snippet from a Reuters article of today:
Michael Woolfolk, senior currency strategist at Bank of New York, reckoned however that much of November's asset inflow was speculative, given an increase in investments from Caribbean money center banks. These banks are known to be financing channels for most hedge funds, which have become major players in the daily $1.3 trillion turnover of the global foreign exchange market.
Looks like they may also be financing channels for the US Fed.
A rising dollar's seemingly inevitable negative effect on the Dow will force US insiders to do whatever they need to do to prop up their beloved stock-market con game. As the Dow goes, so goes investor psychology. When the Dow finally folds, we will get Prechter's predicted (but so far not occurring) deflation scenario. Individuals and businesses will pull in their horns. Credit will contract, not because rates are high but because everybody gets scared. Then, the Fed may be forced to reverse course and drop its interest-rate pants again, exposing the nakedness underneath for all the world to see.
But the above still doesn't explain why the dollar turned on a dime in the new year.
What we have witnessed so far does not appear to be a major dollar support action by anyone - unless it's an act of covert dollar-buying by the ECB and/or euro-zone member nations. If I were to go way out on a limb I'd say that, just as the US is trying to undermine the euro by dropping the dollar too far too fast, the euro-members may have figured out they can "mess" with the US by covert dollar-support. In doing so, they can apply a fair amount of pressure on the Dow, as is evident from this chart:
Funny world, isn't it, where nations and power-blocs now appear to try and hurt each other by supporting the opponent's currency?!!!
But it doesn't have to be covert EU dollar-support that drove this reversal. It may very well be that Japan is finally acquiescing to longstanding EU demands to stop selling yen to buy dollars, which in the past forced the euro to take the brunt of the ongoing dollar-depreciation.

It is too early to tell whether this represents a definitive policy shift by the Japanese, but it is interesting to note that, although the dollar bounced against both the euro and the yen in early January, its bounce against the euro has been sustained and continues, while it fell back against the yen to levels that are now lower than they were at the beginning of the bounce. And that despite the lift it got from the foreign capital inflows data.
So, is gold "on hold" again? Yes, for the time being - but that's a good thing if you are consistently buying and saving gold (as the Chinese and other Asians do) to align yourself with the coming changes in the world monetary system. Those changes are detailed only in the Euro vs Dollar Currency War Monitor.
If you are only trading gold or gold shares for paper-profits, your long-term priorities may be a bit off. If you end up selling gold in the face of a sustained rise in the dollar, you will be doing those who truly save gold a huge favor. They'll be glad to buy it from you - for even less paper cash than it takes to do that now!
Got gold?
Alex Wallenwein
Back to the 1970s:
Mary Anne & Pamela Aden
The Aden Sisters
January 20, 2005
Courtesy of www.adenforecast.com
Gold's bull market is alive and well since reaching a 16 year high in early December at $456. And the decline we've seen since then is normal.
Gold's 16 year high last month reinforced that the current bull market has now clearly outperformed the bull markets in the 1980s and 1990s in both time and price gains. This confirms the current bull market has now been the strongest since the 1970s and it could be similar, eventually reaching $800 or more.
It's not really surprising when you see the similarities compared to the 1970s. The most obvious is the high oil price. It rose over 400% in 1971-1974, which is about the same as the 400% rise oil has had in the last six years.
The budget deficits and an extremely loose monetary policy are also similar, as are the costs to finance an expensive war.
Furthermore, just as the industrialized world now has stiff competition with China and India causing disruption in the manufacturing and service industries, the 1970s had a similar situation with Japan and Korea. In both cases, it hurt the West.
China and India are also keeping upward pressure on commodities due to their growing demand. In the end, it's very possible we'll see rising inflation and slower growth, which would be very good for gold.
GOLD TIMING: On track
chart 1
Meanwhile, many of you know how well the 65-week moving average has worked in identifying the major gold price trend over the years (see Chart 1). Gold rose above this average in August, 2001, triggering a major buy signal, and it hasn't looked back. This moving average is currently at $408 and gold's major trend is up above that level.
Since August, 2001, the times gold declined to this average was during a D decline, which is precisely where gold is today, since what we call a D decline started last month.
Many times these intermediate moves will tell us if a major change is in the making and so far they're signaling the bull market is solid. The latest "test" was when gold hit a high last month. The previous C rise performed well taking gold to a new bull market high, which is normally the case during a C rise, and that was important for the strength of the major uptrend.
For now, a D decline is underway below $435 and we could see gold stay weak until the end of January to mid-February time period. This would be normal, but if it ends up lasting as long as the previous D decline did, we could see weakness until April. The end of this decline will be the next ideal time to buy new gold positions.
GOLD SHARES: Disappointing
Gold shares have been disappointing. It's been frustrating for investors to see gold shares end the year lower than where they started as they watched gold rise to 16 year highs.
chart 2A and B
We know that gold shares move with gold (see Charts 2A and B). The vertical lines show how gold shares rose during gold's previous C rises going back to 2001. But another pattern is developing too...
Of the five C rises gold's had since 2001, the 2nd and 3rd ones in the XAU gold share index were similar to the 4th and 5th ones. The best gold share moves took place during the 2nd and 4th C rises when gold shares shot up to new highs, strongly outperforming gold. In both cases, the following C rises (#3 and #5) were lackluster rises in gold shares, despite the strong gold price.
If this pattern continues, we could see the strongest gold share rise take place later this year with gold shares hitting new bull market highs.
chart 3
The only thing that bothers us is the big picture on Chart 3. This shows the gold shares to gold ratio going back to 1969. You can see the rise since 2001 has so far been a rebound rise within a major downtrend that goes back to 1969. The peak in the ratio occurred a year ago at the major downtrend. And the lack of strength in gold shares last month was not a good sign because the ratio failed to break above the major downtrend.
The bottom line... gold shares are at a critical juncture compared to gold. If the alternating strong-weak C rises continue, then gold shares will be the better investment. But if gold shares fail to strongly outperform gold this year and the ratio falls below its 2004 low, the alternating trend since 2001 will change and gold will then clearly be the better investment compared to gold shares.
If gold outperforms gold shares this year, however, it won't affect the bull market. Note from 1973 to 1980, the ratio fell sharply as gold strongly outperformed gold shares. In other words, an investor would've wanted to be heavily invested in gold at that time.
Meanwhile, until the trend clarifies, it's best to keep half of your portfolio in metals and half in gold shares. Then as it becomes clearer, we'd adjust and go heavier into the strongest area. For now, keep your gold coins, gold contracts, gold mining shares and the new gold ETF, GLD.
Mary Anne & Pamela Aden
info@adenforecast.com
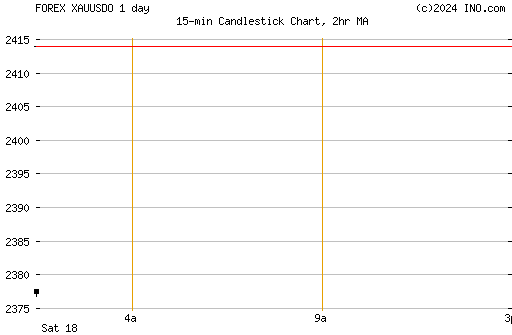
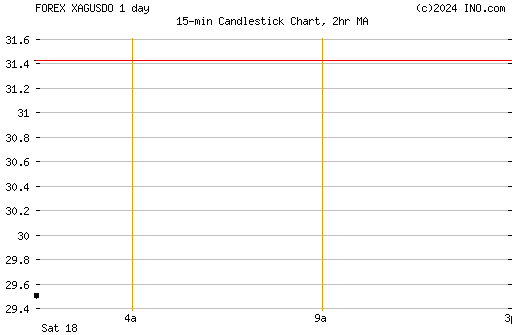
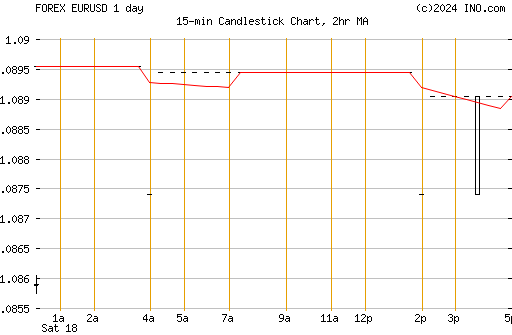
INO Daily charts (gold, silver, usd, euro):
{these update automatically all day...keep checking back}
Gold 1 day:
Silver 1 day:
Dollar 1 day:

Euro 1 day:
ScotiaMocatta Gold & Silver Marketwatch:
http://www.scotiamocatta.com/prec/pdfs/pm_daily.pdf
Rand key to gold output stability:
By Eric Onstad
January 19, 2005
Production decline 33% over decade
Johannesburg: Gold output in South Africa is expected to fall slightly this year, but a bigger slide is threatened if the rand extends its bull run, a government expert said yesterday.
SA gold production could nearly stabilise this year with a buoyant dollar gold price and a stable rand, Alex Conradie, chief mineral economist with the Department of Minerals and Energy, told Reuters.
The country has seen production tumble by over a third in the past decade as high-grade mines run out of ore and firms have to dig deeper to find new deposits.
This year output is forecast to slip only three tonnes to 363 tonnes, a decline of 0.8% after an estimated fall of six tonnes, or 1.6%, in 2004. Final figures for last year are not yet available. "But I think that there is definitely a danger that it could fall further (in 2005) with a stronger rand," Conradie added.
The main factor in knocking output over the past few years has been the rampaging rand, one of the world's best performing currencies, which has strengthened 127% against the dollar since late 2001.
A strong rand, which rallied by 18% versus the greenback in 2004, slashes local income from dollar sales of gold, making some mines unprofitable and vulnerable to closure.
Downscaling
Last year the largest domestic gold producer, Harmony Gold, announced downscaling at six unprofitable shafts that had been producing a total of 220 000 ounces (6.84 tonnes) of output per year.
But this year Conradie expects the rand to stabilise at an average of R6.00 against the dollar, not far from its midday level yesterday of R6.08.
He also projects the dollar gold price will average $447 per ounce in 2005, up from current levels just above $420 and near a peak achieved late last year.
"That is because of contin-uing instability, geopolitical reasons, especially the situ-ation in Iraq, and also the US economy with the dollar weakening," he said.
That would result in a domestic gold price of around R86 000 per kg, compared with just over R82 000 currently and a range of around R100 000-R75 000 last year. Gold production, however, could fall further if the rand extended its three-year march higher, but Conradie said no estimates were available under those scenarios.
Conradie sees the long-term downward trend continuing, with production down by 4.4% to 350 tonnes by 2008, when he projects the local gold price slipping to R80 000.
It would take a gold price of over R100 000 to significantly stem the decline, he added.
South Africa's share of global gold production has shrunk to under 15% from 27% in 1993, but the country still dominates the world in terms of reserves - underground deposits yet to be tapped - with 40%.
The bulk of those deposits, however, would only be economical if local gold prices doubled to R150 000 and above. - Reuters
http://www.dailynews.co.za/index.php?fSectionId=500&fArticleId=2378697
Mining ADR's:
Lihir Gold, Ltd. (LIHRY):
http://stockcharts.com/def/servlet/SC.web?c=lihry,uu[w,a]daclyiay[dc][pb50!d20,2!f][vc60][iut!Uah12,...
Aluminun Corporation of China (ACH):
http://stockcharts.com/def/servlet/SC.web?c=ach,uu[w,a]daclyiay[dc][pb50!d20,2!f][vc60][iut!Uah12,26...
BHP Billiton Ltd. (BHP):
http://stockcharts.com/def/servlet/SC.web?c=bhp,uu[w,a]daclyiay[dc][pb50!d20,2!f][vc60][iut!Uah12,26...
Corus Group PLC (CGA):
http://stockcharts.com/def/servlet/SC.web?c=cga,uu[w,a]daclyiay[dc][pb50!d20,2!f][vc60][iut!Uah12,26...
Randgold Resources Ltd. (GOLD):
http://stockcharts.com/def/servlet/SC.web?c=gold,uu[w,a]daclyiay[dc][pb50!d20,2!f][vc60][iut!Uah12,2...
Ispat International N V (IST):
http://stockcharts.com/def/servlet/SC.web?c=ist,uu[w,a]daclyiay[dc][pb50!d20,2!f][vc60][iut!Uah12,26...
Pohang Iron & Steel (PKX):
http://stockcharts.com/def/servlet/SC.web?c=pkx,uu[w,a]daclyiay[dc][pb50!d20,2!f][vc60][iut!Uah12,26...
Companhia Vale do Rio Doce (RIO):
http://stockcharts.com/def/servlet/SC.web?c=rio,uu[w,a]daclyiay[dc][pb50!d20,2!f][vc60][iut!Uah12,26...
Grupo Simac, S A de C.V. (SIM):
http://stockcharts.com/def/servlet/SC.web?c=sim,uu[w,a]daclyiay[dc][pb50!d20,2!f][vc60][iut!Uah12,26...
Gold Ratios:
HUI/Gold
http://stockcharts.com/def/servlet/SC.web?c=$hui:$gold,uu[w,a]daclyiay[db][pb10!b50!f][vc60][iut]&am...
GOX/Gold
http://stockcharts.com/def/servlet/SC.web?c=$GOX:$GOLD,uu[w,a]daclyiay[db][pb10!b50!f][vc60][iut]&am...
XAU/Gold
http://stockcharts.com/def/servlet/SC.web?c=$XAU:$GOLD,uu[w,a]daclyiay[db][pb10!b50!f][vc60][iut]&am...
Precious Metals/Gold
http://stockcharts.com/def/servlet/SC.web?c=$GPX:$GOLD,uu[w,a]daclyiay[db][pb10!b50!f][vc60][iut]&am...
Why The World Loves America's Deficits:
by Richard Benson
Benson's Economic & Market Trends
January 19, 2005
At the end of last year, the nation’s financial deficit – what the United States owes the rest of the world, minus what the rest of the world owes the United States – amounted to more than $3 trillion, and it’s still growing. This account deficit means the United States imports more than it exports. To fill the gap – and its budget deficit – it borrows heavily. However, while the trade deficit weakens the dollar, it strengthens the world! For Europe, Japan, China, and even America, as long as the nation’s trade and budget deficits continue to grow and are financed by the world’s central banks, everyone seems to win! Let me explain.
Let’s take The European Central Bank “ECB” as an example. The ECB is the central bank for Europe’s single currency, the euro. Their main task is to maintain the purchasing power of the euro and thus price stability in the euro area. The euro area comprises the 12 European Union countries that have introduced the euro since 1999. The ECB needs to be able to “place their paper” at a reasonable cost when they borrow, the same way any corporation that borrows would have to do. Given the fact that Germany and France are having a horrendous time keeping their budget deficits below three percent, and Greece is regularly “cooking their books” and running six percent budget deficits, you would wonder who in their right mind would be interested in putting their cash in sovereign euro debt.
The current account deficits – the broad gap between exports and imports of goods and services – are mushrooming out of control so much so that on a relative basis, they almost make the euro look good on an absolute basis. In 1999 when the euro was introduced, there was great fear that it might fall apart. Sure, the Europeans hate the weak dollar and the fact that the Americans and Chinese are competing with unfairly low prices. But for now, making the euro a rival to the dollar as a world reserve currency is more important! As the euro is being firmly established, European countries and businesses can borrow at subsidized rates because of the pressure to get out of the dollar. Inflation in Europe is also lower and oil is relatively inexpensive. Euro pride can run high!
Another example is The Bank of Japan’s buying of limitless amounts of United States’ treasury and agency securities. This has allowed Japan to run their printing press much faster than they could otherwise without suffering embarrassment. Japan’s budget deficit is approximately seven percent, which makes the United States look fiscally responsible in comparison! In 2005, Japan will have about $240 billion worth of fresh Yen bonds to sell to finance their government deficit but very few people will want to buy them with interest rates there at almost zero. When Japan is buying dollars to hold down the Yen, no one thinks twice about the extra monetization. What’s more important, is the fact that as long as the world thinks there is money to be made from dumping the dollar against the Yen, speculators and gullible investors will buy the hundreds of billions in new government debt Japan has to place. (In reality, Japanese fiscal policy remains bankrupt.) In addition, Japan gets to build up massive dollar credits it can use in the future so it can continue to attack and destroy industries, such as the American Auto Industry (GM just announced another seven percent cut in U.S. jobs). Of course, the Japanese would like to keep their foreign exchange reserves safe, but funding their deficits and getting American jobs is more of a priority.
The story on China is similar to Japan, only more so. In 2004, speculating investors invested over $95 billion in China. This cash is in addition to China’s $150 billion trade surplus last year and the massive $610 billion in foreign currency reserves they have amassed. China is running the fastest industrialization effort in the history of the world using classical “mercantilist trade policies”. A greatly undervalued Yuan is pegged to the dollar. These speculating investors may never get a return on their money, much less a return of their money, but they are confident they can’t lose as the Yuan will have to revalue against the dollar. Don’t hold your breath. (Obviously, these investors have never read history; even recent history!)
China has been winning the economic war against America as our factories are closed down and relocated there. Just like the Japanese, China would like to keep their foreign exchange reserves safe. However, for now, with the dollar going down against the euro and the Chinese Yuan fixed to the dollar, the Chinese government can begin their “big push to collapse and replace European industry” after helping to reduce American production to a meager 45 percent of our nation’s consumption. China has recently witnessed worker riots, so getting Western jobs remain the number one priority just to keep a lid on the domestic, political situation.
Clearly, one of the most important things for the Bush Administration to focus on is getting foreign central banks to finance a major portion of our budget and trade deficits. In the first nine months of 2004, foreign central banks purchased $315 billion of our financial assets. This is equivalent to about three-quarters of the U.S. trade deficit, and more than enough to pay for the war in Iraq. Temporarily, this central bank buying of dollar assets holds down our interest rates and keeps our economy in a housing boom, with false prosperity and no savings. Our government seems to have decided that as long as our country is the military superpower, the strategy of exporting troops to the Middle East and jobs to Asia – in exchange for a lock on the oil reserves and cheap imports – remains more important than rebuilding American industry.
So for now, all the major countries seem to “win”(as their central banks print up new money to finance our trade deficit) because (i) the euro is secure; (ii) Japan can finance a seven percent deficit; (iii) China gets everyone’s jobs; (iv) America gets its war paid for; (v) every major country gets financed, and (vi) all the produced goods get sold with that last $600 billion bought by Americans on credit.
Perhaps things will change as inflation bursts out into the open and exposes the fraud of prosperity through printing money. Or, at some point, central banks may discover that not only do they need to finance new U.S. debt being created but all the old debt as well, as the private sector dumps their dollars en masse. This would surely put into question the seemingly limitless dollar asset buying spree of the world’s central banks.
For the future, however, Bush’s wish list, led by the privatization of Social Security and a reform of the tax code, seems to leave little space for policies that would reduce our country’s deficits. Greenspan, himself, in a speech to German bankers recently warned that “foreigners would probably demand higher interest rates and bond yields to hold American debt”. The real question may be “when does the debt become so big that foreigners begin to worry about getting their money back with a reasonable return?” With America taking the short-term economic view, and Asia taking the long-term economic view, the future will prove very interesting.
The losers in all this will surely be those who want to save in dollars, insist on holding investments denominated in dollars, and Americans who would simply like a job working in the most efficient and productive factories in the world, rather than sit back and watch them be built, with the latest technology, half a world away. Unfortunately, since most Americans will continue to use dollars, you can guess who’s going to be the big losers here – just look in the mirror!
The Weekly Gold Perspective:
by Julian D.W. Phillips
Gold - Authentic Money
January 19, 2005
That was the week that was
The Funds ruled the roost during the holidays until last Wednesday. Then came the explosive news that took Technical features out of the picture and reminded us all that gold is moving as a currency, and driven by structural decay in the global economy. The Trade deficit came in at $60.3billion in November. The Euro leapt up away from the $1.30 area in minutes, taking gold with it up to $427. But how important it was that the funds did what they did, by taking the quiet holiday period to play with the Technical structure, press the price down $36, clearing out major speculative positions in the process, removing that awful feeling that one was buying at the top, and bringing the price to levels all present buyers feel comfortable with. The made the professional gold market players happy, as well as helped all to realise that the fundamentals weigh heaviest when they kick in hard, like the Trade deficit. Our forecast of 2005 being a year of ‘volatility’ is already being proved correct, but brace yourself for much more this year.
The Euro price of gold moved down to Euros 319, but held around 320, before steadying and building a foundation at the Euros 322+ level. This all happened because the opportunities the Technical picture offered, resulted in the huge fund liquidation taking net long positions to 249 tonnes from the peak last year of 610 tonnes and from a level of 516 tonnes in November. This leaves little room for them to push the price lower, so we expect consolidation for a while.
We have also established as fact our forecast and many statements that we have made over the last year that a strong U.S. economy sucks in imports and exacerbates the Trade deficit.
The weaker bias, we forecast last issue, appears, at first sight, to have been dismissed, being replaced by a period of consolidation. It is now for the market to decide whether the U.S. Administrations words, claiming yet again that they favour a strong $, in the face of action that says the opposite, hold any more water than they did the last time! This will decide the near term direction of the Euro/$/Gold.
The Indian market saw strong buyers of gold through London, in the last quarter of 2004.
The wave we now see in the gold market should take it further up the beach than the last one did, as the tide pushes harder.
Latest
At the time of writing, gold stood at $422.70 and in Euros 322.770. The Euro is worth $1.3096.
The Dollar – Is the rally over? Or is the future better for the Greenback? - The U.S. $ Index
Fundamental Features:
In 2005 the $/ started the year holding tight to the gold price. The jump in the Euro on the publication of the startling deficit number of $60.3 billion in November, sent the $ down rapidly. It had rallied to just below the $1.30 level, but then leaped to $1.32 almost immediately on the press release. This has brought a new feature to the surface one that is critical for us to assimilate. We can discard the thought that there is a link between the Dow and the gold price. Both fell and both rose together during the last week. On the interest rate front the picture starts to break away from the apparently sound concept of a ‘return’ on your money. The interest rates available on the $ have been higher than on the Euro, so if return on investments were what counted [and several Central Bankers have trumpeted this as justification for turning from gold] there should have been a major capital flow from the Euro to the $. But there has not been. What has grown in importance is the concept of the capital value of a currency. The longer term prospects of the value of the $, irrespective of the return one can get, is now more important to investment managers. This is a departure that we have been waiting for. It reflects dropping confidence, a main driver of gold. Gold gives no interest rate return of its own, but does have great capital gain prospects. With the market showing a move away from the return concept, gold will hold its own by comparison to currencies in this changed ‘climate’.
France is not selling Germany’s ‘option’ to sell 120 tonnes in 2005!
Until an announcement to the effect that France has taken over the option to sell Germany’s 120 tonnes in the year Sept 2004 to Sept 2005, we do not accept that it has. One of the foundations of the Central Bank Gold Agreement was to provide “Transparency” to European Central Bank sales in the future. Such actions would go directly against that objective.
Ceilings not sales!
We must remind ourselves that the 2004 Central Bank Gold Agreement only set “ceilings” on sales of gold by the signatory Central Banks; it did not state that these amounts would be sold. To date the evidence of Central Bank sales confirms that far less than the ceiling limits have been sold.
G.F.M.S. and our Track record!
The latest survey from the reputable consulting firm G.F.M.S. has just been released reviewing 2004. Their fact-gathering abilities, forms the foundation of an accurate global gold picture. We attempt to forecast the next period ahead and rely on such firms to lay the foundation for our future forecasts and to establish our forecasting track record. We are happy to say that the record we have established has been sound. We dislike the concept of bragging, but realise that you the readers and Subscribers need to know whether you are getting your money’s worth. In a nutshell, what we forecast has been accurate on the supply side, and the demand side, but more importantly, our reading of the monetary scene and its impact on the gold price and attitude of the leading market players to gold has been absolutely correct.
These were the highlights of the G.F.M.S. report: -
Official Sales: - Constrained selling by the signatories to the Central Bank Gold Agreement (CBGA) was the prime cause of the decline in “Official” sales for the year as a whole, though quite numerous purchases by others, most obviously Argentina, were significant. We at G – AM have specialized in this aspect of the gold market and will continue to do so over 2005 and onwards.
De-Hedging: - The report singles out the major importance of producer de-hedging, which is estimated to have risen by over 50%. G - AM have forecast that de-hedging will continue to occur until the level of hedging is consistent with levels which provide financing for the mines, no more.
Mine production: - Was also, and slightly unusually, said to have been a contributor to price strength in that it fell unexpectedly by a sizeable amount of 110 tonnes or 4%.
Exchange Traded Funds: - The report this year devotes a greater amount of space to investment, partly to accommodate an analysis of a relatively new area, exchange traded funds or E.T.F. ’s. G.F.M.S. noted, “the E.T.F. ‘s, especially New York’s streetTRACKS, are looking quite exciting at the moment. Their combined holdings after all aren’t that far off the 200 tonne mark”.
Acceptance of higher prices: - The consultancy lastly feels sentiment was critical. This is normally seen in the context of where western investors and the major mining companies think the price is going but on this occasion the report ranks of similar importance the growing acceptance by the traditionally price sensitive countries of prices above $400 as fair and sustainable. G – AM will continue to focus on the relationship between the global macro-economic and Monetary scenes, the global gold markets in different currencies and the gold price.
International Gold Prices in their Currencies:
London. Euro €: $1.3096

London dominates the physical market in gold. The Comex market exercises a primarily short-term surface action for gold. We expect in 2005 the London Fix will exercise even greater dominance over the daily prices than it did in 2004. Whilst the $ is still the prime currency in which the gold price is made, its relationship with the Euro is the one that has defined it most as a currency, over the last year. The gold market keeps a very close eye on the Euro price, which defines the real price of gold presently.
Euro Fundamentals:
The Euro appears little changed since our last report, with it still standing above 320 at Euros 322 for an ounce of gold. It has held steady at these lower levels since the recent correction from Euros 336.
As we pointed out last issue gold is below its long-term level of Euros 330. Euro interest rates are on a par with Euro-zone inflation at 2%, which is why the Euro interest rates was held at 2% this week. U.S. $ rates are higher, which is why there is the struggle going on, on the exchange rate front. Question is, is the total return on the $ worth more than the total return on the Euro. The answer to this question will point the Euro’s direction. Are interest rate increases enough to give true value?
India: Rupees: ($1: Rupees 43.60)
Present Price [excluding duties, etc] Rs.18,429.72 per ounce [last week: Rs.18,685]
Key Fundamentals for the Indian Market.
The harvest was not bad at all. It was sufficient to remove the past economies of Mothers sacrificing their gold for their daughter’s dowry and their financial security. We expect the acceptance of $400 and above as an acceptable price to pay, to continue. With approximately 600 tonnes purchased last year, we expect this year to see a similar performance.
South Africa: South African Rand ($1: R6.0465)
Key Fundamentals for the South African Market
Some relief on the Rand exchange rate front, but expected to be short lived as the Rand weakened through the R6.00 level to the $ in a reaction to the strength in the $. But then the deficit saw the Rand leap to R5.94 to the $ before weakening to R5.99: $1. Now it is weaker and above the R6.03 level again, while the $ consolidates.
There is an expectation that interest rates in South Africa, will be cut again. However, the country is enjoying a structural boom presently, and there is a fear that if rates are cut it will inspire over-spending and excessive stimulation. This is a weak argument against the continuing stress to exporters, including the gold mines. The sustained pressure on exporters eventually leads to them disappearing off the South African scene. In the latest issue of “Global Watch – The Gold Forecaster”, we take a close look at the South African gold and Gold share prospects [Subscribe below].
[The South African Rand is the price paid to the Gold Mines. With South Africa producing 11% of the world’s new gold, and some leading Mines operating there, the balance of future gold supplies is directly affected by the strength or weakness of the Rand, so the Gold Price in Rands is a key one to the gold market.] Last week the gold price, per ounce was R2,583.75, today it is R2,555.86.
Silver $6.585 [Euros 5.028]
The future for Silver in 2005 is favouring a similar market to the one it saw in 2004. Industrial demand is strong enough to absorb any selling from the photographic industry. Chinese sales were down 22 % last year. The same sort of reduction should occur this year. The funds will continue to sit like vultures over this market playing it both ways to give a far greater volatility than gold in 2005.
The Real Interest Rate Conundrum:
Stephen Roach
Real, or inflation-adjusted, interest rates remain near rock-bottom levels. That’s true in most major segments of the world. It’s also true for short- and long-term maturities, alike. This condition is not sustainable. The days of abnormally low real interest rates could be coming to an end. As the world economy returns to trend, a normalization of real interest rates is both appropriate and likely. This poses major risk to financial markets, as well to asset-dependent real economies that have become hooked on low real interest rates.
The real interest rate conundrum is largely made in America. The Federal Reserve is the leading actor in this saga. Fearful of a Japanese-like post-bubble carnage, the Fed slashed its policy rate by 475 basis points in 2001 in the aftermath of the bursting of the US equity bubble. Another 75 bps of rate cuts were implemented in 2002 and 2003 as the US veered dangerously toward deflation. To varying degrees, other major central banks went along for the ride. The Bank of Japan augmented its zero interest policy with extraordinary efforts at quantitative easing. Even the inflation-phobic European Central Bank took its policy rate down to “zero” in real terms and allowed excess growth in Euroland M-3 that has been above the 4.5% reference zone for the past three and a half years. And the People’s Bank of China, operating with a pegged currency, took its cue from the Fed and followed with a major monetary stimulus of its own -- fostering M-2 growth that has averaged 16.5% since 2000.
In response, real interest rates have tumbled from the short to the long end of the maturity spectrum. Nowhere is this more evident than in the United States. When “deflated” by the headline CPI, the federal funds rate is still in negative territory by about 125 bps. Using the core CPI, which excludes food and energy, the real funds rate is basically “zero.” (Note: I have long objected to stripping out important, but volatile, items in order to get a clean read on any economic trend; in the comparisons that follow -- especially the international ones, for which core inflation data are not always available -- the headline construct is used). Based on either inflation metric, US monetary policy remains in its most accommodative position since the late 1970s; the real federal funds rate has been below its post-1985 2% norm for nearly four years and has been at the zero threshold or in negative territory for more than two years. A similar downside breakout is evident for long-term US real interest rates. Adjusted for inflation, the yield on 10-year Treasuries is currently a bit below 1% (4.20% nominal yield less the latest reading of 3.5% on headline CPI inflation). That reading essentially equals the lows hit in the spring of 2003 and remains more than 250 bps below the post-1985 norm.
Real interest rate trends elsewhere in the world essentially mirror those in the United States. Short rates in both Europe and Japan remain below the inflation rate -- underscoring the extraordinary degree of monetary policy stimulus that is still in place in both regions. Long rates remain equally depressed. That’s true in Europe, where yields for 10-year German bunds (3.5%) are only 100 bps above the pan-regional European inflation rate (2.5%) and about 300 bps below the post-1985 norm. Similarly, nominal yields on 10-year Japanese government bonds (1.4%) are only about 70 bps above the now-positive Japanese CPI (+0.7% in December 2004); while that’s above the negative readings that were hit in 1998, it remains well below the 2.5% post-1985 average. Elsewhere in the developed world, it’s basically the same story. The IMF’s composite measure of world real long-term interest rates -- including not only the US, Japan, and Germany but also the higher-yielding securities of France, Italy, the UK, and Canada -- is currently at a 20-year low of around 2%. Even in the developing world, spreads relative to Treasuries are at lows last seen in the pre-crisis period of 1997-98. The world’s real interest rate cycle is, indeed, in rarefied territory.
We debate endlessly the hows and whys of fluctuations in real interest rates (for a good discussion of the broad outline of this debate see Federal Reserve Governor Roger Ferguson’s "Equilibrium Real Interest Rate: Theory and Application," 29 October 2004, and Dick Berner’s 3 January 2005 dispatch, “Critical Macro Investment Themes for 2005”). But there can be no mistaking the implications of a protracted period of low real rates -- unusual support to financial asset valuations and to those economies that convert asset appreciation into aggregate demand. Again, America leads the way in this regard. In a climate of subpar income generation -- with the current recovery in private sector real wage and salary disbursements falling ten percentage points short of the cyclical norm -- US consumers have been quick to extract “extra” purchasing power from their asset holdings in order to keep on spending. This phenomenon has been a long time in the making; it was initially concentrated in the equity wealth effect in the latter half of the 1990s; however, when that bubble popped, income-short US consumers moved seamlessly into the property-market wealth effect. It is the essence of what I have called the Asset Economy (see my 21 June 2004 dispatch, “The Asset Economy”).
In their most basic sense, asset-based economies are nothing more than a levered play on low real interest rates. And with America at the forefront of this trend, the rest of a US-centric global economy has been eager to go along for the ride. So eager, in fact, that a massive surge of foreign capital inflows into dollar-denominated securities has played a key role in subsidizing US real interest rates in recent years. That’s not without good reason. Lacking in domestic demand of its own, the non-US world has a vested interest in keeping the magic alive for America’s asset economy. Dollar-buying campaigns of Asian central banks -- especially Japan and China -- have been an important piece of this equation. Significantly, such efforts have forestalled the real interest rate pressures that normally accompany current-account adjustments. Not only has that provided interest rate support to asset-dependent demand in the US but it has also prevented an outbreak of Asian currency appreciation that might have otherwise crimped the region’s export potential.
Consequently, the role of subnormal real interests cannot be minimized as a driving force behind today’s US-centric global growth dynamic. But, at the same time, low real rates are equally culpable in producing the extreme state of imbalance that currently exists in the world economy. To the extent that low rates encourage asset-based saving, income-based saving gets minimized. In the case of the United States, this has been taken to excess -- a net national saving rate that has been pushed to a record low of 1.5% of national income since early 2002. Lacking in domestic saving, America then must import foreign saving in order to grow -- and run massive current account deficits to attract that capital. The resulting persistence of outsize trade deficits is a recipe for trade frictions and protectionist risks. Moreover, asset-based consumption also entails a bias toward ever-increasing household sector debt loads -- leverage that is manageable for only as long as real rates stay low. While low real rates may keep the party going, the celebration is hardly without consequences.
Which brings us to the endgame -- how world financial markets and the global economy are weaned from abnormally low real interest rates. This is likely to be a delicate surgical operation, to say the least. Not surprisingly, it all starts with America’s Federal Reserve -- the central bank that has nurtured the Asset Economy the most. The task is clear -- to restore the policy rate to a level that is compatible with the Fed’s multiple goals of price stability, full employment, and sustained economic growth. The recently-released minutes of the FOMC’s mid-December policy meeting send a reasonably clear signal that the central bank is about to embark on such a recalibration. By citing two sets of concerns that are goading it into action -- rising inflationary pressures and mounting speculative excesses -- the Fed is threatening to reset the anchor of the world’s real interest rate structure. In doing so, I believe that Greenspan & Co. now have their sights set on a policy rate that is in the restrictive zone. Gone are the days when the Fed can afford simply to shoot for “neutrality.”
As this realignment of US monetary policy filters through the term structure of interest rates, collateral reverberations can be expected at the long end of the yield curve. In large part, that’s because the Fed will be changing the rules of the “carry trade” and the artificial demand that bets on the “spread” create for long-duration assets. In my view, that poses especially large risks to high-yield, emerging-market, and even investment-grade debt. It also poses great risk to perhaps the biggest carry trade of them all -- the overvalued US housing market and the concomitant “refi bet” of the income-short American consumer.
There is always the risk that the asset-dependent US economy -- and by inference, the US-centric global economy -- is far more sensitive to real interest rates than might be the case for a more normal, income-based economy. If that turns out to be the case and the economy quickly weakens, then Fed tightening will undoubtedly be curtailed. That would have the effect of limiting the downside of the real economy, but at a cost of perpetuating excesses in asset markets. Therein lies the most worrisome aspect of the real interest rate conundrum -- an asset economy that won’t allow for an easy exit strategy. That should not keep central banks from acting responsibly and attempting to return real rates to more normal levels. The longer the world resists such a normalization, the more treacherous the endgame.
http://www.morganstanley.com/GEFdata/digests/20050118-tue.html#anchor0
Sectorwide Upside Breakout Alert:
Clive Maund
19 January, 2005
Further to the "General Buy Alert" posted on clivemaund.com on the 8th January, there is now additional evidence that PM stocks are about to break higher and enter into a new uptrend. A bullish falling wedge pattern has developed in the HUI index above what is clearly very important support at 200.
On the 6-month chart we can see that the index has steadied for long enough above the 200 level to make the channel line drawn beneath the early January low valid, which is good news indeed because it results in a very clear - and very bullish - falling wedge. Although now falling and providing some resistance immediately above the index, a closing break above the 200-day moving average, which would be simultaneous with a breakout from the falling wedge pattern, is expected to lead to a strong move up. This would be similar to what happened last September. Note also on this chart how the RSI and MACD indicators are starting to turn up from low levels, suggesting that an uptrend is imminent and also signifying that there is plenty of leeway on the upside.
A look at the longer-term charts gives us more of an idea just how important this 200 level is. Zooming out to a 1-year chart brings into full view the trading range that developed between mid-April and mid-August last year. The early sellers in this range are a potent source of support at the current level.
Looking now at the 3-year chart we see that the HUI index is right on its long-term uptrend line. Of course it could break down from here, but as I have just made clear above it is looking much more likely now that it will break out upside - and if it does then we should see a substantial uptrend that comfortably surpasses the earlier highs, although we can expect it to tarry around the former highs before breaking out into open country.
We are now at a major cusp, and the weight of the evidence points to a vigorous uptrend starting from here. This is an optimal buy spot. A break below the clear support at 200 would, however, be bearish, and it is therefore considered wise to place general stops beneath the 193 level, this amount of leeway being considered prudent to guard against an attempted intraday shakeout being engineered by big money with the aim of scooping up your shares on the cheap, and also to take account of the position of the lower line of the wedge. Note that an upside breakout may well involve a "kicker move," with the HUI index up between 8 and 12 points in 1 day. There are a lot of traders sitting on the fence right now and if this situation resolves itself to the upside they will pile in, particularly as the current situation is so finely balanced.
Silver is also expected to pick up strongly and with the big silver stocks having been beaten back severely to sit just above strong support levels, there is clearly lots to go for with the silver stocks.
Oil is now strengthening as earlier predicted and this is having a positive influence on the precious metals. With an attack on Iran looming, it is hard to see how the price of oil could fall, and despite the fact that the attack or attacks will probably be confined to precision bombing and sabotage, for the time being, it can be expected to generate considerable friction internationally. This will be a supportive influence on the precious metals.
A wide range of big PM stocks are now looking ready to advance and provide important additional evidence to support the view that a breakout and new uptrend are imminent.
Clive Maund
Today's Pfennig!
Good Show!
Good day.... Well, thank goodness! The Net Securities Purchased Data showed a nice increase over Octobers dismal showing of $48 Billion, rising to $81 Billion in November. Whew! Did you hear that? It was a huge sigh of relief from the markets, that feared Foreign Investors had packed up their bags and went home. Well, they haven't... Yet! So, we carry on for another month, eh?
The dollar was bought by the bushel full after the data was announced, which was merely traders and speculators closing short positions they had put on in case the data was as dismal as the previous month's. Once those short positions were closed, the euro began to rise, albeit slowly on the day. This morning I'm seeing the single unit trade 1.3085, which is better than yesterday morning's price, so we've got that going for us, eh?
There was a great article in the Wall Street Journal yesterday comparing our current situation with what the writer calls the last currency crisis in the 70's. I borrowed a piece of it, because it really talks about something that I continue to stress...
"In 1978, the U.S. current account deficit -- the balance on goods and services trade plus the balance on investment income between the U.S. and its trading partners -- was less than 1% of gross domestic product. It is now approaching 6%. That deficit represents the extent to which U.S. households, corporations and governments spend and invest more than they earn. Compared with 27 years ago, U.S. households save far less of their after-tax income, and thus must borrow more to finance their housing and consumption. The federal government also borrows more; its budget deficit was 2.7% of GDP in 1978 but was 4.5% last year."
It goes further to say, "Just as an individual who spends more than he earns must borrow or sell some of his assets to pay his bills, the U.S. finances its current-account deficit by either borrowing or attracting foreign investment in its businesses and stock market. Lately, it has borrowed heavily by selling Treasury bonds and other IOUs, often to foreign central banks. As a result, the U.S. has gone from having net foreign assets equal to 9% of GDP in 1978 to net liabilities equaling about 25% now. Mr. Eichengreen says there is no historical precedent for such a large economy being so heavily in debt to the rest of the world. Timothy Geithner, current head of the New York Fed, recently highlighted the risks: "We are significantly more dependent today on the confidence of the rest of the world in U.S. economic policy."
Oh, and Ty Keough was kind enough to pass this note from my favorite economist, Morgan Stanley's Stephen Roach... "Nor would I be too sanguine about prospects for the dollar in a more aggressive Fed tightening scenario. The recent trading rally in the greenback has given some investors hope that the currency-adjustment cycle has run its course -- offering the tantalizing prospect of reinvigorated foreign capital inflows triggering the ultimate virtuous circle for US financial assets. My advice: Don't count on it. Back in 1994, when the Fed was last faced with a similar normalization challenge, the dollar fell like a stone even as the US authorities pushed the federal funds rate up by 300 bps. In today's climate, with a US current account deficit that is nearly three times what it was back then, the downside for the dollar can hardly be minimized. There's far more to currency adjustments than swings in relative interest rates."
So... See! I'm not the only one singing from the "deficits matter, and higher interest rates don't necessarily equal a stronger currency" song sheet!
OK, back at the ranch... Aussie and kiwi have gotten some attention and buying interest overnight after a report from Australia showed home loan approvals had the biggest gain in nearly two years, and then that was followed up by a labor report that showed unemployment fell to the lowest level in 28-years!
So, who still thinks that the domestic demand and growth in Oz is over? Who still thinks the Reserve Bank of Australia is finished with rate hikes to improve the rate differential to not only the U.S. but Europe and Asian? I personally believe that all those that have bailed on Australia will wish they had their Aussie dollars back when it hits 80-cents later this year! OK, that's just my opinion... (got to make the legal beagles happy!)
Kiwi is in the same boat as Australia, although, the questions about their Reserve Bank don't run so deep as the RBNZ did raise rates to combat inflation pressures in 2004, unlike their kissin' cousin across the Tasman. I like Kiwi, and can only think that these current levels are great entry levels!
Just when the thought for the Bank of England was that they would not be able to maintain their interest rate differential to the core Europe and the U.S. along comes Mary... No wait, I mean along comes two reports that tell us differently. First, Inflation surprised on the upside in December, and wage growth held at its highest level in the past 3 years. There's no "backing off" by the BOE here... They've got to maintain rates where they are to fight these inflation pressures.
Today, we'll see the color of the December CPI, which on a month-on-month basis is expected to tick up .2%, not bad, but any inflation in my mind is a "Baaaaaadddddd thing" But the piece of inflation data that should turn some heads is the Year-on-Year figure which is expected to rise 3.4%... OUCH! That's very close to the "supposed" growth figure for the country! Double OUCH!
Now, if the number does come in that high, the perverse market mentality will once again enter into the currency markets and the dollar will get bought again... Don't ask me why, strange days indeed... Because, once again let me make this perfectly clear... INFLATION IS A BAAAAAAAAADDDD THING! Our little Christine just came in, and she caught me yelling at the wall! How embarrassing! Not for me! For her! She has to sit by me each day!
OK, on that note, I better get this out the door, I am running late today. A late night for me last night, and I overslept this morning... UGH! Yeah, and still made it in hours before anyone else!
Currencies today: A$ .7655, kiwi .7055, C$ .82, euro 1.3085, sterling 1.8820, Swiss .85, rand 6.01, krone 6.22, forint 1.8825, zloty 3.11, koruna 23.13, yen 102.15, baht 38.47, sing 1.63, pesos 11.23, dollar index 83.02, and gold... $425.50
That's it for today... look at that CPI data today, should be a wing dinger! We'll also see Housing Starts, Building Permits, and Weekly Initial Jobless Claims, so the trading screens will be lighting up today! Be careful... And Have a great Wednesday!
Chuck Butler
President
EverBank World Markets
Nell Sloane:
DAILY US METALS COMMENTARY 1/19/2005
METALS: OVERNIGHT CHANGE to 3:45 AM: London Gold Fix $424.10 +$1.55 LME COPPER STOCKS 43,525 metric tons Unchanged COMEX Gold stocks 5.934 ml -16,702 oz COMEX SILVER stocks 102.6 ml -307,011 oz
OVERNIGHT ACTION: Mixed trade in Asia with $ action slightly more beneficial today.
GOLD: Despite the fact that Chinese gold was slightly weaker overnight, we suspect that support under gold will be a little more prevalent this morning, as the Dollar is showing some signs of weakness. However, if the March Dollar Index were to fall below 83.00, that could psychologically inspire even more gold buyers to come back into the market, after the recent fund liquidation. The April gold contract continues to coil in a $420 to $430 range but until the pattern of lower highs is violated with a rise back above $430.5, we have to give the bear camp a slight edge. With the US CPI report out this morning and the PPI recently showing a contraction, we suspect that gold will see a minor ripple of selling in the wake of the CPI report. While the initial claims report is pulled forward today, due to the Inauguration, we doubt that the report will impact the gold market significantly. We suspect that gold is in much better short term technical condition than it was to start the month, especially when one considers that April gold fell nearly $30 an ounce in the January slide. However, from the fundamental front the gold market still doesn't seem to have a conclusive theme besides the hope for more weakness in the Dollar. In the short term, one can't rule out a waffling of prices between $423.2 and $430.
SILVER: At times the silver market appears to be divorcing itself from the daily gold market action and could be attempting to tie its fate to the industrial metals. With copper and zinc rising sharply overnight and favorable Chinese dialogue surfacing again, the best hope for the bull camp in silver is to play up the physical demand link. However, we would be a little surprised to see March silver manage a rise above $6.775, but we concede that the path of least is now pointing up but we are not sure that momentum will be that impressive.
METALS TECHNICAL OUTLOOK 1/18/05
SILVER (MAR):Stochastics are at mid-range but trending higher, which should reinforce a move higher if resistance levels are taken out. The market back below the 18-day moving average suggests the longer-term trend could be turning down. The market has a slightly positive tilt with the close over the swing pivot. The near-term upside target is at 673.5. The next area of resistance is around 670.0 and 673.5, while 1st support hits today at 661.1 and below there at 655.5.
GOLD (FEB): Daily stochastics are showing positive momentum from oversold levels, which should reinforce a move higher if near-term resistance is taken out. The close below the 18-day moving average is an indication the longer-term trend has turned down. The market has a slightly positive tilt with the close over the swing pivot. The next upside objective is 425.7. The next area of resistance is around 424.7 and 425.7, while 1st support hits today at 422.3 and below there at 420.8.
4godnwv,
Appreciate you taking the time to respond.
I got in it at 3.49 and was thinking I made a mistake with the $USD starting to move north. Sounds I might be a tad early but should be ok in the intermediate term. Thanks again...
Oil and Gas Charts & Other Stuff:
Oil, Gasoline, Heating Oil, Natural Gas Charts:
Light Sweet Crude Oil:
New York Harbor Unleaded Gasoline:

Heating Oil:

Henry Hub Natural Gas:

Links of Interest:
American Oilman:
http://www.americanoilman.com/
Bloomberg Energy Prices:
http://www.bloomberg.com/energy/
CNN Commodities:
http://money.cnn.com/markets/commodities.html
EIA Energy Statistics:
http://www.eia.doe.gov/
EIA Petroleum:
http://www.eia.doe.gov/oil_gas/petroleum/info_glance/prices.html
INO Energy:
http://quotes.ino.com/exchanges/?e=NYMEX
Oilfield Directory:
http://www.oilfielddirectory.com/realnews.html
Petroleum Stocks.com:
http://www.petroleumstocks.com/
WN Energy News:
http://www.wn.com/s/oilprices/
|
Followers
|
41
|
Posters
|
|
|
Posts (Today)
|
0
|
Posts (Total)
|
1217
|
|
Created
|
04/07/04
|
Type
|
Free
|
| Moderators | |||
| Volume | |
| Day Range: | |
| Bid Price | |
| Ask Price | |
| Last Trade Time: |


