News
News  Market Data
  Discover
Support: 888-992-3836
Copyright © 2023 InvestorsHub Inc.


Register for free to join our community of investors and share your ideas. You will also get access to streaming quotes, interactive charts, trades, portfolio, live options flow and more tools.
6/25/20 50 % 7 BELOW 4 ABOVE
there are active and passive sectors
SECTORS
1 ABOVE 200 EMA
2 ABOVE 50 EMA
3 NEW HIGHS - NEW LOWS WITH 10 EMA
CHART 1 XLK XLF XLY XLI
CHART 2 XLU XLV XLP XLB XLE
DAILY DEFENSIVE 1 UP 2 DOWN
Nov. 6, 2016 10:01 AM ET
|
About: Materials Select Sector SPDR ETF (XLB), XLI, XLK, XLV, XLP, XTL, XLY, XLE, XLF
• Real estate: +2.5% vs. +4.1%.
• Telecom: -0.3% vs. +2.1% as of October 1
Here is what the data shows for EXPECTED growth by sector for Q4 '16:
• Consumer Discretionary: +3.5% as of 11/4, vs. expected growth of 7.9% as of October 1 (mostly Amazon's (NASDAQ:AMZN) tempered results hurting sector).
• Consumer Staples: +8.3%, vs. +9.3% as of October 1.
• Energy: +2.9% vs. +2.5% (deserves a separate blog post - even though crude oil down, Energy earnings could be better in Q4 '16).
• Financials: +15.4%, vs. +13.7% (the only sector to show a positive return since 9/30/16 - stay with Financials for Q4 - the higher revisions a definite plus).
• Health Care: +6.4% vs. +8.3% (the drug distributor stocks have gotten crushed. The sector revision's not yet alarming though.)
• Industrials: -2.6% vs. +2% as of October 1.
• Basic Materials: +7.3% vs. +21.7% as of October 1.
• Real estate: +2.5% vs. +4.1%.
• Technology: +7% vs. +6.1% (Tech is the other sector that has seen upward revisions since October 1 for Q4 '16 - important tell).
• Telecom: -0.3% vs. +2.1% as of October 1.
• Utilities: +11.1%, vs. +16.7%.
S&P 500: +6.6% vs. +8.3% as of October 1
Conclusion: Technology and Financials are showing upward revisions to Q4 '16 earnings which (again) is atypical of the normal pattern, hence I would encourage readers to heed the revisions and stay with the sectors. These two sectors are our largest overweights for clients, but really that has been the case for most of this decade. Tech and Financials had their bear markets from March 2000 through 2009, thus even the Tech companies that are growing rapidly - like the FANG stocks - are not nearly as overvalued as the tech stocks of the 1990s. (Long Facebook (NASDAQ:FB), Amazon (AMZN), Google (NASDAQ:GOOG) (NASDAQ:GOOGL)).
Energy and Health Care deserve a separate blog post (each) which are coming tomorrow, and Monday, 11/7.
For now, continue to stay with Tech and Financials. The market weakness, and the "down 9 days in row" losing streak are what they are, but as long as these two sectors see earnings and revenue revisions moving the right away, the downside to the S&P 500 has to be limited since Technology and Financials are still close to 35%-40% of the S&P 500 by market cap.
Thomson Reuters data (by the numbers):
Forward 4-quarter estimate: $128.56
P/E ratio: 16.54(x)
PEG ratio: 4.6(x)
S&P 500 earnings yield: 6.05%
Year-over-year growth of forward estimate: $128.56 - third week in a row it has moved lower.
The S&P 500 earnings yield has been above 6% for five weeks in a row now, since the forward estimate is now firmly positive, but the S&P 500 is testing its 200-day moving average. Something will have to give one way or the other, but I suspect we will see a pretty healthy stock market rally shortly.
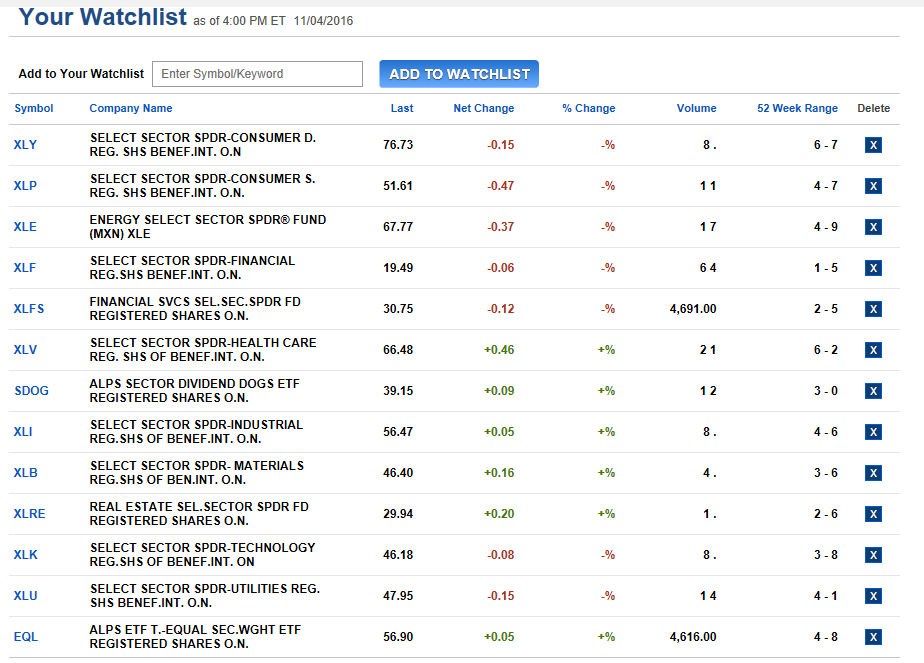
6,732 people have XLB in their portfolio
Which Sectors Looking Better For Q4 2016?
Nov. 6, 2016 10:01 AM ET
Brian Gilmartin, CFA
www.trinityasset.com
http://seekingalpha.com/article/4020182-sectors-looking-better-q4-2016?app=1&auth_param=1vat:1c1uhes:ceb3c747a5a55cb59e46cc3a7975763d&uprof=51
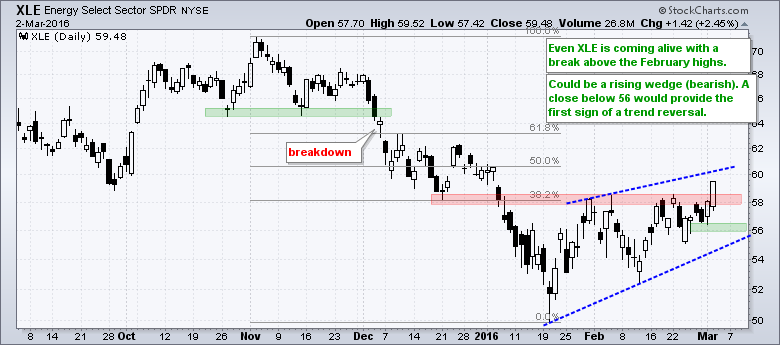
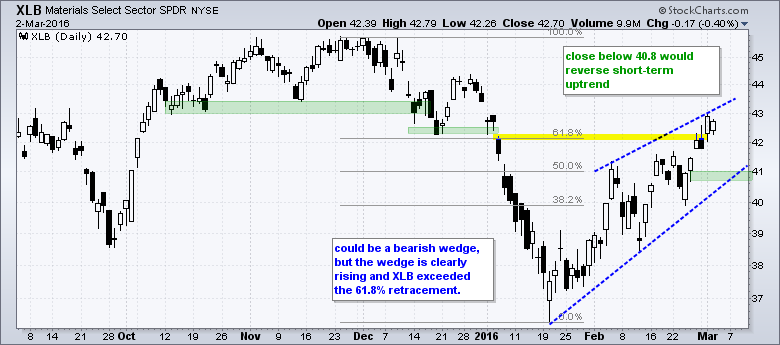
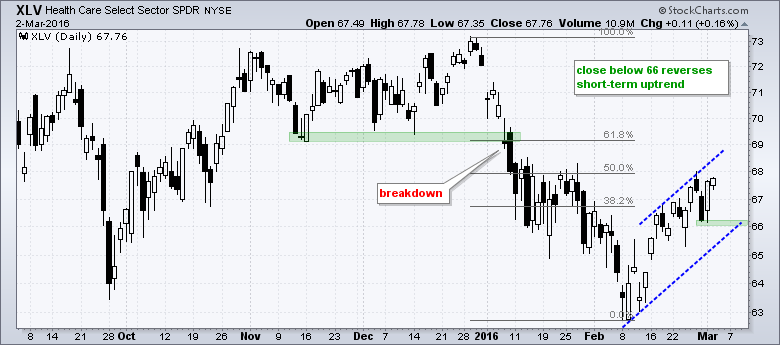
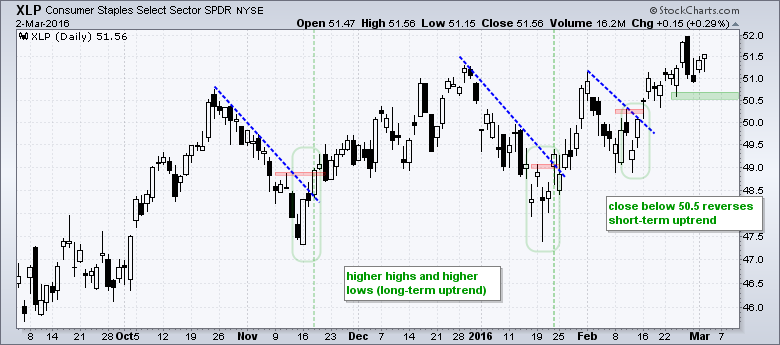
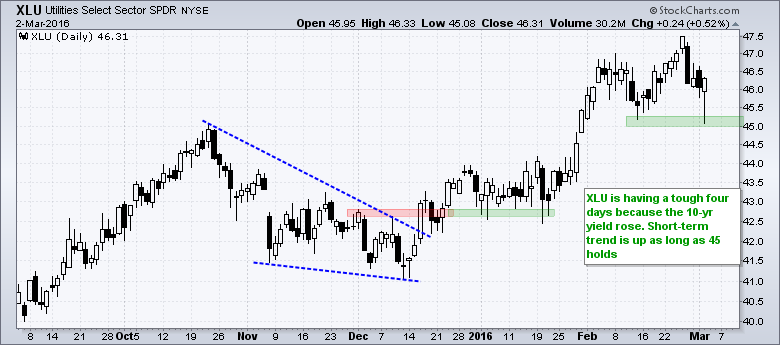
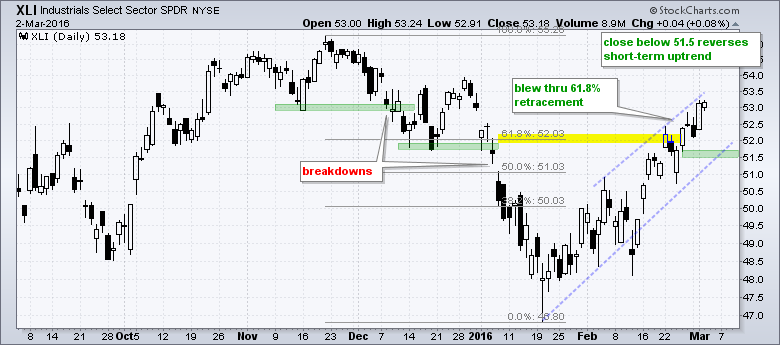
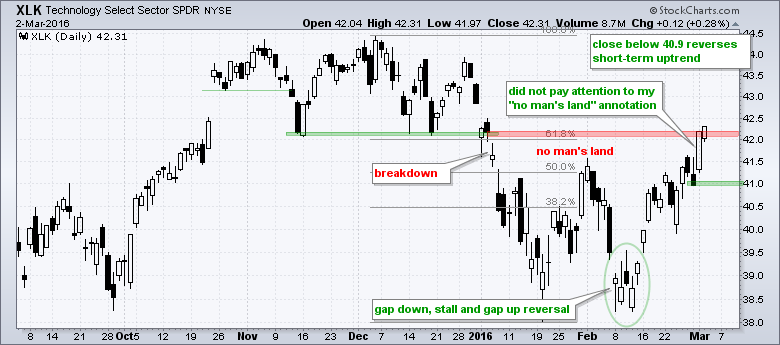
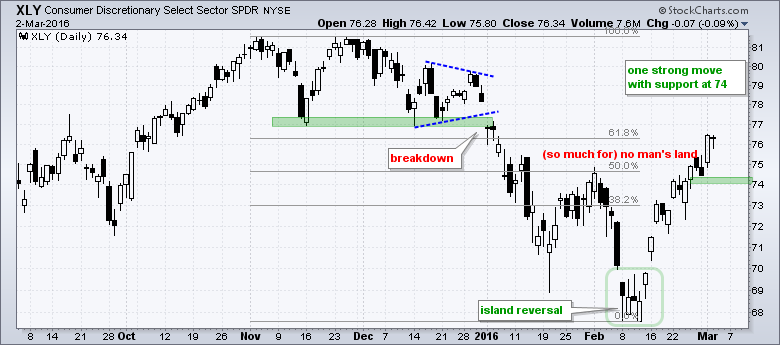
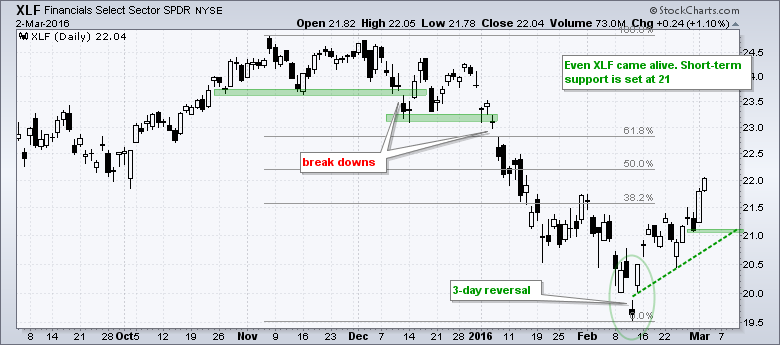
3/3/16 OFFENSIVE All Nine Sector SPDRs in Short-term Uptrends
All nine sector SPDRs are in short-term uptrends and above their 50-day moving averages. Four could be considered in long-term uptrends. Note that the Industrials SPDR (XLI), Technology SPDR (XLK), Consumer Staples SPDR (XLP) and Utilities SPDR (XLU) are above their 200-day moving averages. At this point, XLI and XLK are the new leaders in 2016. XLP and XLU were the leaders at the beginning of the year and are still in uptrends. I am just showing six month candlestick charts to define the short-term uptrends, which range from 3 to 6 weeks. I will be watching short-term support levels (marked in green) for signs of weakness in the broader market. Breakdowns in five of the nine sectors SPDRs would tilt the market evidence bearish.
| Volume | |
| Day Range: | |
| Bid Price | |
| Ask Price | |
| Last Trade Time: |