Register for free to join our community of investors and share your ideas. You will also get access to streaming quotes, interactive charts, trades, portfolio, live options flow and more tools.
3/11 The StockCharts Outlook Webinar Recording with Arthur, Greg and Tom
http://stockcharts.com/members/articles/arthurhill/2017/03/the-stockcharts-outlook-webinar-recording-with-arthur-greg-and-tom.html
3/10 Weekly Market Review & Outlook - Looking at Performance Splits within the Market and Oversold ETFs
http://stockcharts.com/members/articles/arthurhill/2017/03/weekly-market-review--outlook---looking-at-performance-splits-within-the-market-and-oversold-etfs.html
3/9 SystemTrader - Reducing Risk with a Portfolio Approach to Mean-Reversion Trading
http://stockcharts.com/members/articles/arthurhill/2017/03/systemtrader---reducing-risk-with-a-portfolio-approach-to-mean-reversion-trading.html
3/7 Small-Cap Breadth Deteriorates -
http://stockcharts.com/members/articles/arthurhill/2017/03/small-cap-breadth-deteriorates---bonds-could-hold-the-key-for-stocks.html
3/4 Weekly Market Review & Outlook 4-Mar-17 (w/ video) - Breadth is Strong Enough
http://stockcharts.com/members/articles/arthurhill/2017/03/weekly-market-review--outlook-4-mar-17.html
3/3 SystemTrader - Testing a 58-ETF Portfolio using Trend-Timing and Momentum-Rotation
http://stockcharts.com/members/articles/arthurhill/2017/03/systemtrader---testing-a-58-etf-portfolio-using-trend-timing-and-momentum-rotation.html
2/28 Fibonacci Retracements are Not Science
http://stockcharts.com/members/articles/arthurhill/2017/02/fibonacci-retracements-are-not-science-and-17-stocks-to-watch-.html
2/24 SystemTrader - Testing a Trend-Timing System and Momentum-Rotation System for the nine Sector SPDRs
http://stockcharts.com/members/articles/arthurhill/2017/02/systemtrader---testing-a-trend-timing-system-and-momentum-rotation-system-for-the-nine-sector-spdrs.html
2/16 Small-caps Join the New High Parade
http://stockcharts.com/members/articles/arthurhill/2017/02/housing-stocks-lift-the-consumer-discretionary-sector.html
1/21 FIRST WEEKLY REPORT
http://stockcharts.com/members/articles/arthurhill/2017/01/weekly-market-review--outlook-video-.html
1/19 Broad Market Breadth Indicators are Far from Bearish Signals
http://stockcharts.com/members/articles/arthurhill/2017/01/broad-market-breadth-indicators-are-far-from-bearish-signals---using-above-20-day-ema-for-short-term-bullish-setups-and-signals.html
1/3 DOW THEORY
TIDE = 6 MONTHS = MAJOR TREND
WAVE = 4 MONTHS = CORRECTION
RIPPLE = 1/2 MONTH = MINOR TREND
PER ART HILL
TESTING 2000 TO 2016
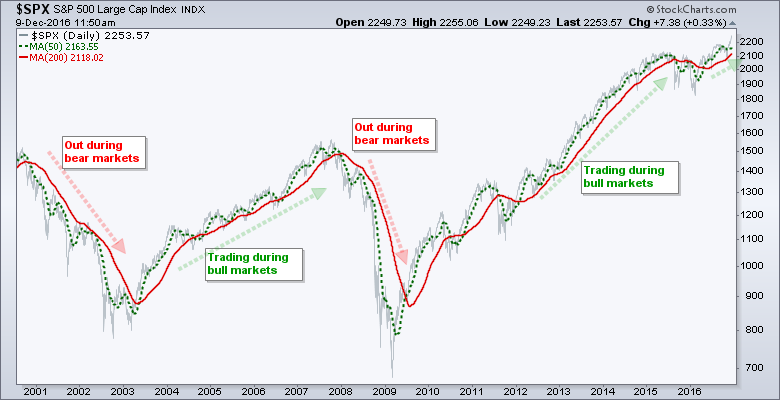
The backtest period extends from 12/01/2000 to 12/01/2016, which covers 16 years of data. I like this testing window because it includes two bear markets, two bull markets and a few periods of extreme volatility. In short, pretty much everything the market can throw at a trader is included.

The system looks for long positions when the 50-day SMA is above the 200-day SMA for the S&P 500 (golden cross). The system does not trade when the 50-day SMA is below the 200-day SMA (death cross). I tested with short positions and it is better to be out of the market when the long-term trend is down.
I am using SPY (the tradable benchmark) and the golden-cross system to compare against these mean-reversion systems. Buy-and-hold for SPY from 12/01/2000 to 12/01/2016 returned 5.22% per annum with a 55% max drawdown. In contrast, the golden cross system returned around 7% per annum with a 20% max drawdown.
System Rules
The testing focuses on SPY, QQQ and IJR with daily data. I am using the S&P SmallCap iShares (IJR) instead of the Russell 2000 iShares (IWM) because IJR has consistently outperformed IWM over the last 16 years. Commissions are $10 per trade and the initial portfolio is $100,000. The signals are based on end-of-day data (closing prices) and the buy-sell prices are based on the next day's open.
Why 5-day RSI and 30/70?
I decided to focus on 5-day RSI because it crosses the 30 and 70 levels quite often. The chart below shows IJR with 5-day, 10-day and 14-day RSI. Notice that RSI(5) crossed the 30/70 thresholds more than 20 times, RSI(10) crossed around 8 times and RSI(14) crossed just 5 times. I also found that the Maximum Drawdowns using RSI(10) and RSI(14) exceeded -20% most of the time. I am using 30/70 to generate signals because these levels are crossed more frequently than 25/75 or 20/80. The drawdowns were generally higher when using the latter levels.
12/9 IJR Mean-Reversion System
http://stockcharts.com/members/articles/arthurhill/2016/12/systemtrader---testing-and-tweaking-an-rsi-mean-reversion-system-for-spy-qqq-and-ijr.html
Conclusions IJR system that waits for RSI to cross above 30 and then uses the Chandelier Exit (22,1).
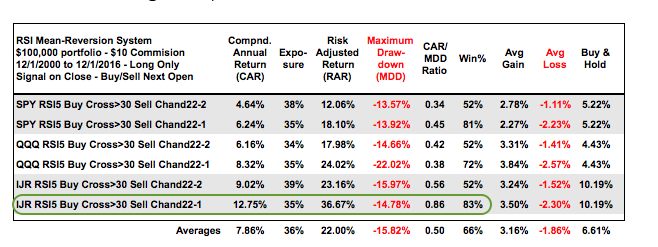
The table below shows two system tests from last week and two from this week. Overall, I am impressed with the IJR system that waits for RSI to cross above 30 and then uses the Chandelier Exit (22,1). The last row highlights this system with the second highest CAR, the second lowest MDD, the second highest exposure and the highest CAR/MDD ratio. It does, however, have the lowest gain/loss ratio, but the winning percentage is quite high. Over the 16 year test period, this particular system generated 80 trades and was in the market 35% of the time (5.6 years or 67.2 months). It is not a full-time system.

Even though the results for IJR look pretty good, keep in mind that past performance does not guarantee future performance. Also keep in mind that this system will perform differently for other ETFs and stocks. The results based on taking EVERY trade and STICKING with the system, which can be hard in real life. The chart below shows IJR with an entry signal on October 18th and subsequent 4.8% decline (drawdown). There are no stops and this system does not even consider an exit until price moves above the Chandelier, which occurred right after the election. The exit triggered on 28-Nov and IJR advanced another 3-5% afterwards. The system is far from perfect, but neither are traders.
5-day RSI for entries and the Chandelier Exit for exits.

Comparing the Results
Looking at the two tables, it is clear that the tighter of the two exits improved the results (Chandelier (22,1)). I noticed that the Compound Annual Return was generally higher when catching the falling knife (first table) and the Maximum Drawdowns were generally less when waiting for RSI to move back above 30 (second table). This looks like a classic trade-off of less return for less risk. It seems that QQQ and SPY perform better when buying an RSI cross below 30 (first table) and IJR performs better when buying an RSI cross above 30 (second table). This is not surprising because large-caps act different than small-caps. IJR is clearly the best performer on both tables.
12/17 http://stockcharts.com/members/articles/arthurhill/2016/12/systemtrader---testing-a-mean-reverion-system-with-the-chandelier-exit-spy-qqq-ijr---rsi5.html
IJR RSI 5 SYSTEM IJR Mean-Reversion System
Conclusions - IJR is King
Even though I tested four different systems, there are many similarities with these systems. First, the exposure ranged from 20% to 35% and this means trading money was tied up less than a third of the time. These are not full-time systems that are ALWAYS on a signal. Second, the Win% was extraordinarily high and averaged 78% for all 12 systems. This is typical for mean-reversion systems. The table below shows all the results with an added column (Average Gain/Average Loss Ratio). I circled the best results for each column to see which ETF/System stands out.

Most of the green can be found on the IJR lines, which makes IJR the best of the three ETFs. In particular, I am impressed with the CAR/MDD ratios of .68 and .67 in lines three and four. Even though SPY and QQQ still have positive expectations with the RSI(5) strategy and the returns are decent, IJR is clearly the king with Compound Annual Returns averaging more than 10% per year. Expect to see IJR a lot more in the commentaries. Next week I will look at these systems with a Chandelier Exit. Preliminary results suggest that the Chandelier Exit does NOT increase returns, but it does increase exposure.
12/9 IJR Mean-Reversion System
http://stockcharts.com/members/articles/arthurhill/2016/12/systemtrader---testing-and-tweaking-an-rsi-mean-reversion-system-for-spy-qqq-and-ijr.html
12/22 HEALTH CARE
http://stockcharts.com/members/articles/arthurhill/
|
Followers
|
4
|
Posters
|
|
|
Posts (Today)
|
0
|
Posts (Total)
|
461
|
|
Created
|
06/20/15
|
Type
|
Premium
|
| Moderators | |||
| Volume | |
| Day Range: | |
| Bid Price | |
| Ask Price | |
| Last Trade Time: |
