News
News  Market Data
  Discover
Support: 888-992-3836
Copyright © 2023 InvestorsHub Inc.


Register for free to join our community of investors and share your ideas. You will also get access to streaming quotes, interactive charts, trades, portfolio, live options flow and more tools.
VIX DAY is above 20 = bearish
Strike Two for the S&P 500 BY ART HILL
STRIKE ONE = BREAK BELOW PREVIOUS LOW.
The S&P 500 closed below its 200-day EMA for the first time since Brexit and this marks strike two for the bulls.
Notice that the bulls also had two strikes in late June when the index broke the May low and closed below the 200-day EMA. This two strike count led to one of the best mean-reversion trades of the year. This is not a prediction, but I am saying that we should not count da bulls out just yet because the fat moving average has yet to sing.
Strike three would be the 50-day EMA moving below the 200-day EMA. Note that the S&P MidCap 400 and S&P Small-Cap 600 are below their 200-day EMAs as well, but their 50-day EMAs remain above their 200-day EMAs. The red areas mark the first resistance levels to watch.

WED ....Ultra-Short-Term Indicators: Negative climactic readings appeared today. The market has been in a steady decline for seven days which makes me conclude that this is a selling exhaustion. The VIX has poked well beneath its lower Bollinger Band and typically what follows is a short-term bounce at a minimum. The only time I noted this not to be true was the selling initiation back in January. Remember the timeframe for this chart is hours to days, meaning any rally these climactic readings call for would not necessarily last long.
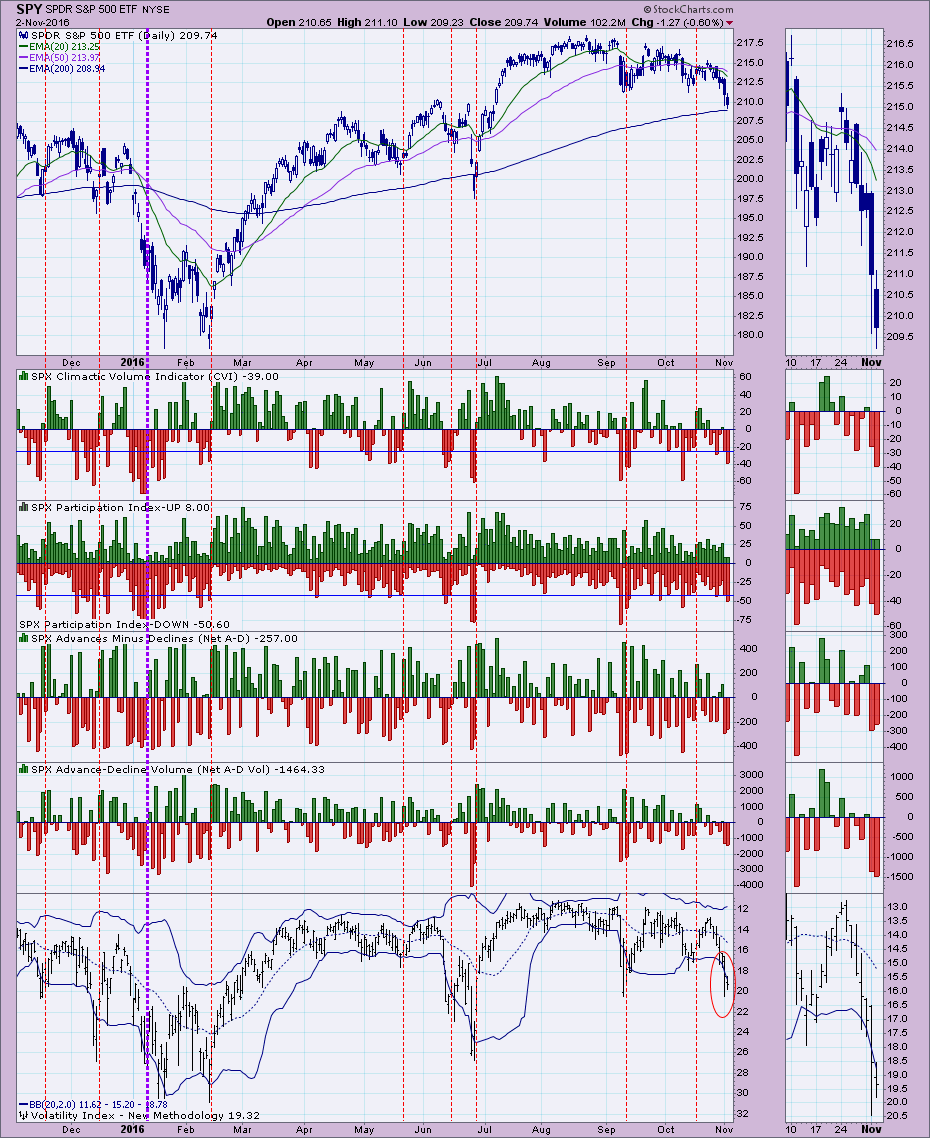
From Decision Point............ Ultra-Short-Term Indicators: Negative climactic readings appeared today. The market has been in a steady decline for seven days which makes me conclude that this is a selling exhaustion. The VIX has poked well beneath its lower Bollinger Band and typically what follows is a short-term bounce at a minimum. The only time I noted this not to be true was the selling initiation back in January. Remember the timeframe for this chart is hours to days, meaning any rally these climactic readings call for would not necessarily last long.
Two Steps Forward and One Step Backward BY ART HILL
There are basically two moves to focus on right now. First, the major index ETFs surged from the Brexit lows in late June and hit 52-week highs in July-August-September. This represents two steps forward. The second move is what happened after the 52-week highs. Some ETFs corrected, some traded flat and some hit new highs just last week (QQQ). This move represents one step backward. The table below shows the percentage distance from the recent peak for 10 major index ETFs. Small-caps and micro-caps are the furthest from their higher, while large-caps and large-techs are the closest. Small-caps corrected the hardest, but they also advanced the most during the prior surge.

Bottom Line: The bigger uptrend is the dominant force and I am using this to set my broad market bias. This means I am focused on bullish setups and bullish resolutions. Conversely, I am ignoring short-term support breaks, bearish MACD crosses, bearish candlestick patterns and the like.
BY ART HILL

Conclusions
Even though the charts show the breadth indicators weakening the last two months, I view this weakening as part of the correction process. Stocks decline or move sideways during a correction and the breadth indicators reflect this corrective process. I do not know if this correction lead to bearish breadth signals and a bear market. That would be predicting the future! Instead, I will work under the assumption that broad market environment is bullish until proven otherwise and I will turn bearish when the indicators tell me to turn bearish.
BY JOHN MURPHY bullish on coal.
COAL ETF IS ALSO HAVING A VERY STRONG YEAR... Speaking of rising commodity prices, I've been writing lately about commodity stock groups that have been doing very well, including metal and mining stocks tied to base metals and steel. Coal stocks are doing even better. Chart 6 shows the VanEck Vectors Coal ETF (KOL) surging almost in a straight line since January to the highest level in eighteen months. The group has doubled in price since the start of the year (as has the price of coal). That comes as a surprise to me because I thought the coal industry was dead. Apparently not. An article in Investors Business Daily this morning explained some reasons why the coal industry is starting to improve. First, a recent court decision offering some relief on the regulatory front. Second, rising natural gas prices are making coal more competitive (see gray area). And third, rising coal demand from China. A big part of that foreign demand is coal that is used to make steel. That's just another sign that commodities, and stocks tied to them, are back in favor. The new inflation trade explains why investors are selling Treasury bonds and moving money into TIPS.

Now we see IWM's spectacular breakdown from its bearish descending triangle. This formation is on the S&P 500 and Dow above and you'll see it on many of the other large- and small-cap indexes. IWM could be leading the way to a market breakdown. Small-caps are typically the first place we will see weakness and in many cases, the first place to see recovery.
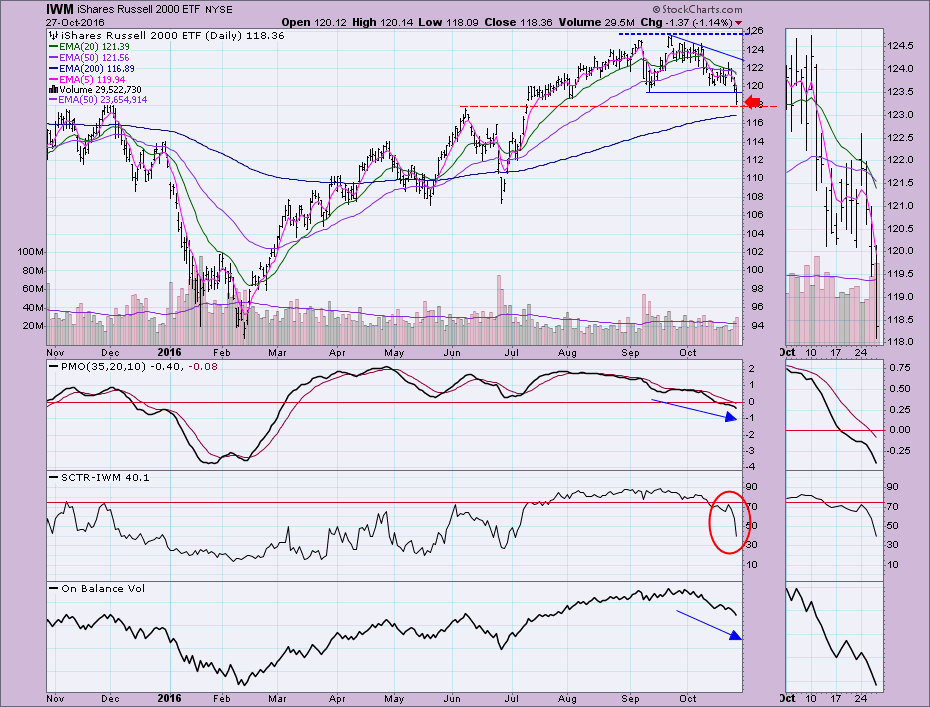
The picture does not brighten for IWM when you look at the weekly and monthly charts. The rising wedge is executing. You can see a wedge on most of the large-cap index weekly charts. (Go to the DecisionPoint LIVE free public ChartList to review) and a new IT PMO SELL signal is on tap. This signal will not go "final" until the close tomorrow.
BY DecisionPoint
Small cap stocks tumbled today, losing 1.23% and far exceeding losses incurred on the other major indices. Since Monday's close, the Russell 2000 has dropped approximately 3% while the benchmark S&P 500 has retreated less than 1%. One hallmark of a bull market is the outperformance of small cap stocks relative to the S&P 500. It's a signal that market participants are in "risk on" mode. The past three days that has not been the case. It's not a sign to panic, but it is beginning to raise my eyebrows. The following shows relative strength in the Russell 2000 throughout 2016, but a sudden reversal this month:
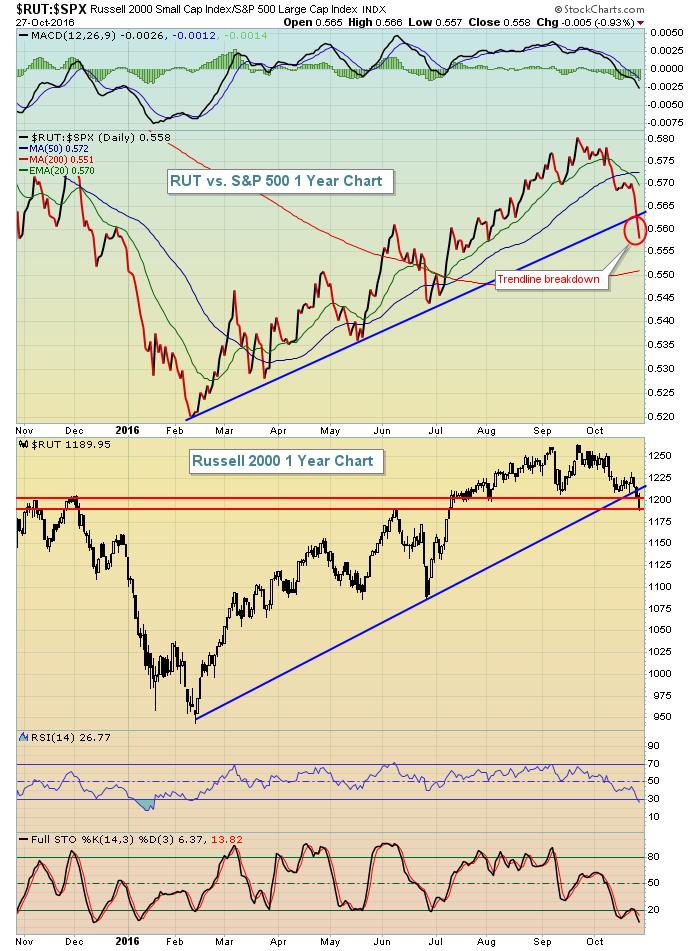
The action on Thursday broke both trendline support and absolute price support. There is further price support just below 1190, which is exactly where the Russell 2000 closed today. Tomorrow begins a very bullish historical period for U.S. stocks and, based on this chart, it's fairly important to see the Russell 2000 begin to outshine the other indices right away.
Happy trading!
Tom
IWM DAY FOLLOWING ART HILL
Pattern Trading versus Mean-Reversion Systems by ART HILL
And now for the biggest conundrum of all! Actually, there is no conundrum if you already have a strategy and you are trading according to that strategy. This is why it is of the utmost importance to plan your trade before making the trade and then trade that plan. No ifs, ands or buts. The broad market environment remains bullish and SPY is in a long-term uptrend, but small-caps are dragging their feet as IWM broke flag support on Wednesday. This is negative for pattern traders and I am marking first resistance at 122. A recovery and breakout here would put small-caps back on the bullish track.
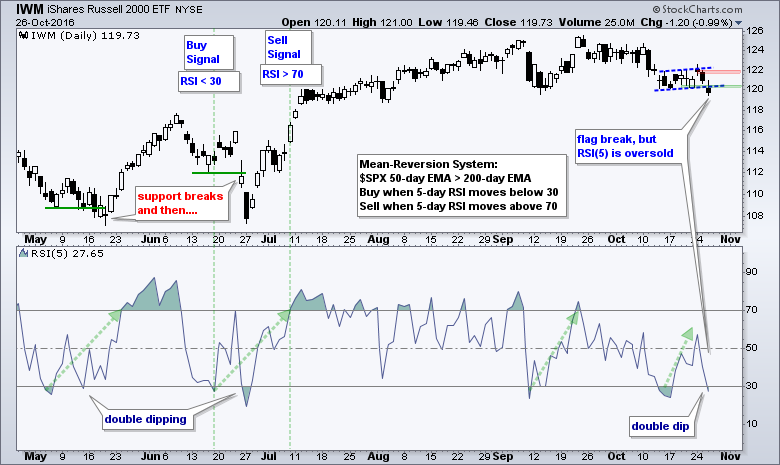
Mean-reversion traders will notice that RSI(5) moved below 30 to set up another mean-reversion trade. This is the second double-dip in the last six months. Notice that RSI(5) also did the double-dip in May and June. These double-dips were challenging because IWM broke support each time. And then rallied. This system does not use a stop-loss and instead exits when RSI(5) moves above 70. Obviously, this is not going to happen in the next day or two, but it does not take much to push 5-day RSI to its extremes. A 4-7% surge often does the trick. This does, however, mean that IWM could decline further and RSI(5) will not trigger an exit until the next bounce. For example, IWM could decline to 117 and then bounce above 122 to trigger an exit. This would also trigger a breakout on the price chart. See the conundrum between the two strategies? Visual pattern trading says one thing when quant driven mean-reversion trading says another.
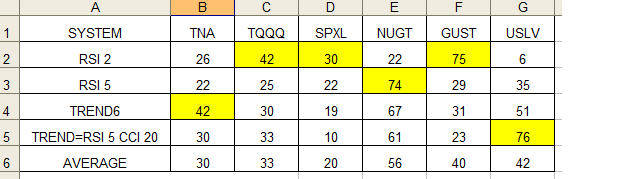
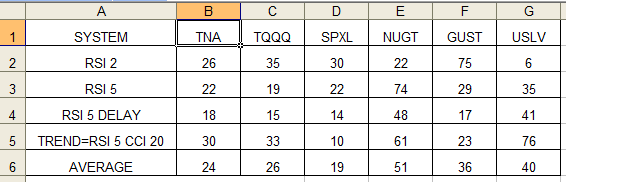
RESULTS 5 MONTHS AS OF 10/25/16
LONGER TREND UP BASED ON RSI(14) > 60 GREEN
LONGER TREND DOWN BASED ON RSI(14) < 40 RED

Using RSI(14) TO DETERMINE TREND
In Technical Analysis for the Trading Professional, Constance Brown suggests that oscillators do not travel between 0 and 100. This also happens to be the name of the first chapter. Brown identifies a bull market range and a bear market for RSI. RSI tends to fluctuate between 40 and 90 in a bull market (uptrend) with the 40-50 zones acting as support. These ranges may vary depending on RSI parameters, strength of trend and volatility of the underlying security. Chart 9 shows 14-week RSI for SPY during the bull market from 2003 until 2007. RSI surged above 70 in late 2003 and then moved into its bull market range (40-90). There was one overshoot below 40 in July 2004, but RSI held the 40-50 zone at least five times from January 2005 until October 2007 (green arrows). In fact, notice that pullbacks to this zone provided low risk entry points to participate in the uptrend.

On the flip side, RSI tends to fluctuate between 10 and 60 in a bear market (downtrend) with the 50-60 zone acting as resistance. Chart 10 shows 14-day RSI for the US Dollar Index ($USD) during its 2009 downtrend. RSI moved to 30 in March to signal the start of a bear range. The 40-50 zone subsequently marked resistance until a breakout in December.

RSI is capable of identifying intermediate and long-term trends and often with less lag and fewer whipsaws than a moving average.
Which is better - CCI or RSI?
Arthur Hill | May 09, 2009 at 06:11 AM
http://stockcharts.com/articles/mailbag/2009/05/which-is-better-cci-or-rsi.html?st=rsi
RSI(2) INFO
Have determined that I can set an inter day value of TNA for a RSI(2) > 90 for an exit.
BY ART HILL Mean-reverting with Breadth Indicators
Mean-reversion is my preferred method of short-term trading. This means I define the bigger trend and look for short-term counter-trend moves. The idea is that short-term pullbacks will revert back to the mean of the bigger uptrend. A mean-reversion strategy can be applied to breadth indicators for broad market timing. The breadth indicators above imply that the broad market environment is bullish. This means I can use short-term breadth indicators to look for short-term oversold conditions. The chart below shows the %Above 20-day EMA for four major indexes. A move below 30% triggers a short-term oversold signal and this occurred the second week of October. The indicators bounced last week and this means they are in the midst of an oversold bounce. In other words, the short-term trend is turning up.

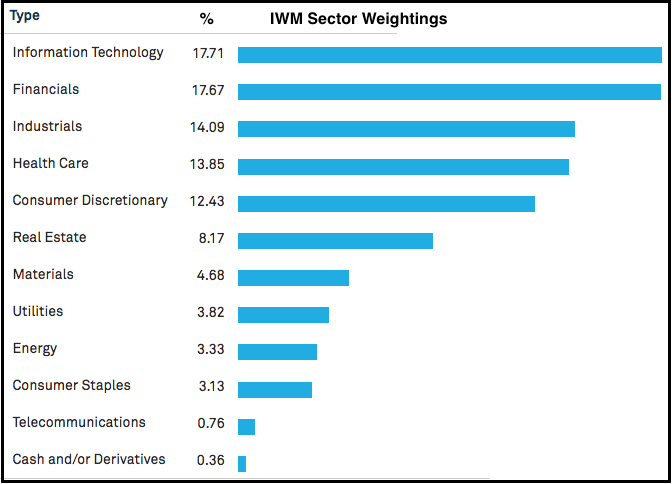
IWM remains at a most interesting juncture. The broad market environment is bullish, IWM is at support and financials are leading. Note that the financials sector accounts for 17.67% of IWM. This used to be higher, but REITs have been removed and this group accounts for 8.17% of the ETF. Information Technology is the biggest sector at 17.71%. Together, finance and technology account for around 35% of IWM and these are the strongest sectors right now.
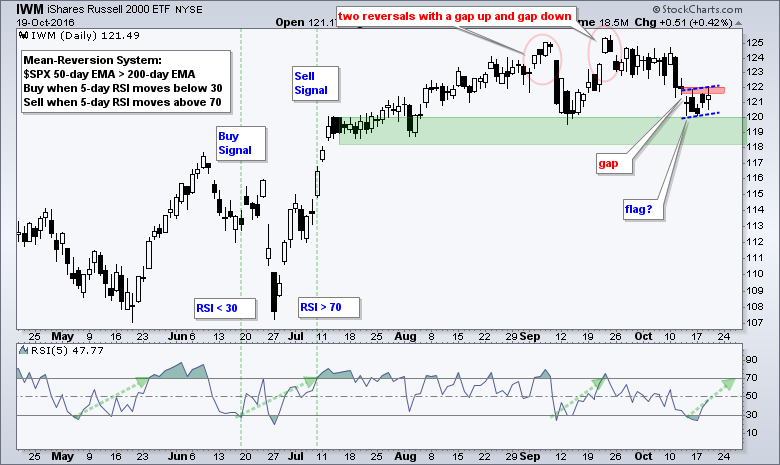
On the price chart, IWM gapped down and RSI(5) became oversold for a mean-reversion setup last week. The ETF firmed after this gap and I am watching 122 for a short-term breakout. As with SPY and QQQ, my short-term concern is with the rising flag and a break below 122 would be short-term bearish.
10/17/16 NUGT STILL ON BUY.
GUST TQQQ TNA SPXL IN CASH
YES The buy was at the close on Thursday.
|
Followers
|
164
|
Posters
|
|
|
Posts (Today)
|
0
|
Posts (Total)
|
17387
|
|
Created
|
07/03/08
|
Type
|
Free
|
| Moderators | |||
TADEING TNA AND TZA .... (1) No penny stocks (2) No Politics nor religion (3) No one who sells on
| Volume | |
| Day Range: | |
| Bid Price | |
| Ask Price | |
| Last Trade Time: |